 Open Access Article
Creative Commons Attribution 3.0 Unported Licence
The air entrapment under a drop impacting on a nano-rough surface†
Kenneth R.
Langley
 *a,
Er Qiang
Li
 ab,
Ivan U.
Vakarelski
 a and
Sigurdur T.
Thoroddsen
 a
a
aDivision of Physical Sciences and Engineering, King Abdullah University of Science and Technology (KAUST), Thuwal, 23955-6900, Saudi Arabia. E-mail: kenneth.langley@kaust.edu.sa
bDepartment of Modern Mechanics, University of Science and Technology of China, Hefei 230027, China
First published on 2nd August 2018
Abstract
We study the impact of drops onto a flat surface with a nano-particle-based superhydrophobic coating, focusing on the earliest contact using 200 ns time-resolution. A central air-disc is entrapped when the drop impacts the surface, and when the roughness is appropriately accounted for, the height and radial extent of the air-disc follow the scaling laws established for impacts onto smooth surfaces. The roughness also modifies the first contact of the drop around the central air-disc, producing a thick band of micro-bubbles. The initial bubbles within this band coalesce and grow in size. We also infer the presence of an air-film residing inside the microstructure, at radial distances outside the central air-disc. This is manifest by the sudden appearance of microbubbles within a few microseconds after impact. The central air-disc remains pinned on the roughness, unless it is chemically altered to make it superhydrophilic.
1 Introduction
Drop impacts on solid surfaces are fundamental to many natural and industrial processes. Examples include raindrops impacting on pavement or plant leaves, spray coating and cooling, and ink-jet printing of organic displays.1,2As a drop approaches a solid surface, the air beneath the drop center is unable to escape, and the resulting pressure rise in the air is sufficient to deform the drop, ultimately entrapping a thin disc of air as the drop makes contact with the surface along a ring. This air entrapment can have a detrimental effect on the uniformity and conduction in a solidified coating,3,4 and its early dynamics have been studied extensively for more than 2 decades revealing a better understanding of this phenomenon as experimental,5–11 theoretical and numerical12–16 capabilities have improved. Some studies use a combination of these techniques such as Bouwhuis et al.17 who used experiments, theory, and numerics to study the maximal air entrapment under an impacting drop noting that the maximum occurs in the transition from a surface tension dominated regime to an inertia dominated regime.
Of particular interest are the results of Mandre, Mani and Brenner,14 who looked at the role of the compressibility of the intervening air layer and its role in determining the size of the central dimple. The compressibility of the gas causes a reduction in the height of the central air disc and should be accounted for when the compressibility parameter ε−1 is significantly larger than 1,
 | (1) |
![[small script l]](https://www.rsc.org/images/entities/char_e146.gif) and g, respectively. Hicks and Purvis15,16 studied the radial extent of the entrapped air disk, Lo, and found that it is invariant to the effects of compressibility at atmospheric pressure,
and g, respectively. Hicks and Purvis15,16 studied the radial extent of the entrapped air disk, Lo, and found that it is invariant to the effects of compressibility at atmospheric pressure, | (2) |
Many of the early studies were preformed for idealized cases, using low viscosity or inviscid drops and impacting onto perfectly smooth surfaces. The impact dynamics for even these idealized conditions can be quite complex such as noted by Kolinski et al.20 who used total internal reflection microscopy to study a thin layer of air, less than 100 nm thick, upon which the low-impact-velocity drop skates as it spreads laterally. Conditions in real applications can be much more complex, thus it is important to understand how such complexities affect the scaling laws proposed in the literature. Some studies have already begun adjusting parameters yielding unexpected results such as the remarkable gliding of the drop on a thin air layer and extreme wetting seen in the impact of ultra-viscous drops18 and double contact of the drop with the substrate due to rarified gas effects.19
While studying the rebound of drops from hydrophilic surfaces, Kolinski et al.21 first noted the importance of the nanometer scale roughness. They found that single asperities on otherwise smooth surfaces that were thicker than the cushioning air film could cause the premature rupture of the air film thus preventing rebound.
Li, Vakarelski and Thoroddsen22 reported that nano-scale roughness can have an effect on the entrainment of microbubbles at the location of first contact. In their study they noted that impacts on microscope slides with an RMS roughness, Rq, of 2 nm was sufficient to form a faintly visible ring of microbubbles at the location of ring contact between a water drop and the glass substrate while impacts onto microscope slides with Rq = 7 nm had noticeably more bubbles entrained, while impacts on molecularly smooth mica had no visible microbubbles entrained.
The overall effects of surface roughness particularly as it relates to superhydrophobic surfaces have been intensively studied due to the potential for drag reduction,23,24 self-cleaning surfaces25 and prevention of icing of aircraft wings,26 among others. Typically, superhydrophobic surfaces are created by a natural or tailored texture or pattern, such as an array of micro-pillars or ribs, imprinted on the surface and then coating the surface with a hydrophobizing agent, if necessary. Drop impacts onto regular micropillar arrays have been studied to better understand the macro-dynamics of bouncing, sticking and splashing,27–33 the heat transfer characteristics,34,35 and how the micropillars affect the formation of the central dimple as the droplet approaches the surface.36–38
Tsai et al.36 looked at impacts onto micropillars and noted that a central bubble was entrapped and the droplet penetrated the micropillars to fully wet the surface in the region around the central bubble for high Weber numbers. Van der Veen et al.37 varied the height, width and spacing of the micropillars and concluded that the height of the micropillars has little effect on the height and radius of the entrapped air disc, but as the packing density of the pillars increases, the height of the dimple with respect to the bottom of the pillars increases as well. This is mainly due to the potentially trapped air not being able to easily escape between the pillars. Similarly, Hicks and Purvis38 theoretically studied inviscid drop impacts onto porous surfaces using micropillar arrays as an analog for the porous surface. They reported that as the substrate permeability increased, the radial extent and disc height were decreased.
In this study, we investigate the effects of surface roughness generated by a superhydrophobic nano-particle coating (Rq ∼ 70–140 nm) on the early dynamics surrounding the first contact of a drop with a solid surface in the vicinity of the central entrapped air disc using ultra-high-speed interferometry. This reveals the formation of a thick band of microbubbles that is entrained near the area of first contact and contains a range of bubble sizes and distributions. Our time-resolved imaging also reveals three basic mechanisms for microbubble formation.
2 Experimental setup
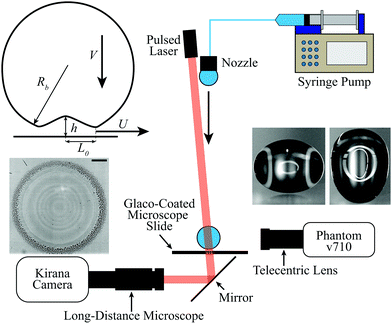
The experimental configuration is shown in Fig. 1. Large droplets of deionized water from a Milli-Q system with a spherical equivalent radius of 2.8 mm were released from an adjustable height nozzle. The release height was varied between 4–79 cm resulting in measured impact velocities between 0.66–3.90 m s−1. The corresponding standard non-dimensional quantities are as follows: the Reynolds number, | (3) |
 | (4) |
 | (5) |
2.1 Imaging setup
To observe the dynamics at the point of contact we use a high-speed interferometry setup as in our other recent papers.11,18,19,22 We use an ultra-high-speed camera (Kirana-05M, Specialized Imaging) filming at up to 5 million frames per second with a resolution of 924 × 768 pixels to view the impact through the bottom glass slide. The camera was equipped with a long distance microscope (Leica Z16 APO) with adjustable magnification yielding a spatial resolution of 1.02 μm per pixel at maximum magnification. A pulsed laser diode (SI-LUX640, Specialized Imaging) with wavelength λ = 640 nm provided illumination from above for transmission interferometry, which also allows greater detail to be seen near the contact between the drop and surface compared with reflective interferometry.39 The smallest film height that can be accurately resolved with this setup is a quarter of the wavelength of the laser, λ/4 = 160 nm.Since the droplets used were much larger than the capillary length of water, there was significant oscillation after pinch off,40 see inset of Fig. 1. This necessitates the use of a second high-speed camera (Phantom v710) equipped with a 1× tele-centric lens (Edmund Optics) to view the impact from the side and measure the drop velocity and the bottom radius of curvature of the drop, Rb, immediately before impact.
2.2 Surface preparation and characterization
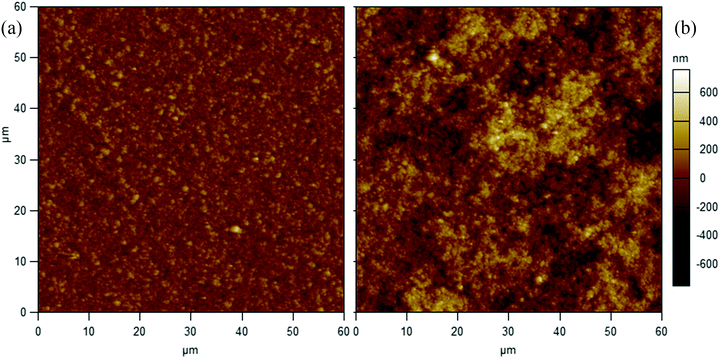
The coating of the surface follows our earlier protocol used to superhydrophobize steel spheres by Vakarelski et al.23,24 A glass microscope slide (Fisher Scientific) was coated with Glaco Mirror Coat Zero (Soft 99 Ltd, Japan), which is an alcohol suspension containing nano-particles (d ∼ 40 nm) and a superhydrophobizing agent. The coating was cured in an oven at 160 °C for 10 minutes. A slide was coated either only once or with 4 repeated applications of this technique to make roughness on a larger scale with a hierarchical structure. Fig. 2 compares the topography of the glass surface with 1 and 4 such nano-particle coatings, as characterized by an Atomic Force Microscope (AFM). For a single coating of Glaco, the RMS roughness was Rq = 70 nm with a maximum valley to peak height of 907 nm. For 4 coatings of Glaco the Rq was 138 nm with a maximum valley to peak height of 1.3 μm. When coated with the Glaco coating the static wetting angle for water is >160°. To convert the coated superhydrophobic surfaces into their superhydrophilic counterpart, they were treated in an oxygen plasma for 3 minutes. This treatment retained the roughness due to the nano-particles but removes the superhydrophobizing agent allowing water to wet the surface.3 Results and discussion
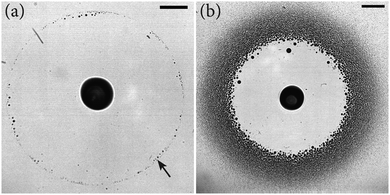
Fig. 3 compares the effects of nano-roughness for drop impacts at the same impact velocity onto a smooth, glass microscope slide Rq = 2 nm, and a microscope slide coated with 1 coating of Glaco and then plasma-cleaned to restore hydrophilicity, Rq = 70 nm. The images are shown after the central disc has fully contracted into a large central bubble. The smooth surface entrains a faint ring of microbubbles marking the location of the first contact. In contrast, the rougher surface entrains a wide band of microbubbles, with the inner edge of the band marking the location of the first contact.Fig. 4(a) shows zoomed-in time series images of first contact and the formation of a band of microbubbles as the drop spreads radially outward for a drop, Rb = 5.6 mm, impacting a 1 time Glaco coated surface, V = 3.7 m s−1. The first contact is faint and occurs in a bright fringe marked by an arrow in the first panel of the figure. After contact is made the drop further penetrates the roughness and the formation of the initial band of microbubbles occurs in the first ∼1 μs. Note that the drop has already spread past this forming band of microbubbles as highlighted by the arrow in each frame. As the drop continues to spread, the band of microbubbles thickens slightly. Fig. 4(b) shows profiles of the air disc after contact until the end of the first expansion. After first contact, the air disc begins to expand slowly for 1.2 μs and then begins to rapidly expand reaching its peak height 4.2 μs after first contact. The rapid expansion begins after the drop has fully penetrated the roughness and formed the initial band of microbubbles. This indicates that the air is able to slowly escape between the roughness asperities during the penetration process. The entire expansion takes nearly twice as long as for a similar impact onto a smooth surface, which occurs in 2.2 μs for an impact at 4.05 m s−1 in the study by Li and Thoroddsen.11
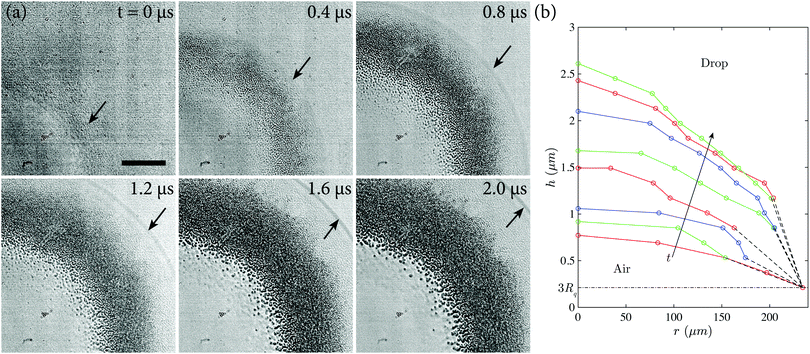 | ||
| Fig. 4 (a) Zoomed-in time series images of the first contact of a drop with a 1 time Glaco coated surface (V = 3.7 m s−1, Rb = 5.6 mm, Rq = 70 nm). After initial contact, microbubbles form as the drop penetrates the roughness and spreads radially outward. Arrows in each frame show the outer contact of the drop. The scale bar is 100 μm long. Video available online (ESI†). (b) Air layer profiles showing the shape of the air disc from the centerline to the contact point during the initial expansion after first contact for the same impact shown in (a). Profiles are spaced 600 ns apart corresponding to 0, 0.6, 1.2, 1.8, 2.4, 3.0, 3.6, and 4.2 μs from bottom to top relative to first contact. Since the surface is superhydrophobic, the contact location is pinned. Marker locations show the center of each fringe. | ||
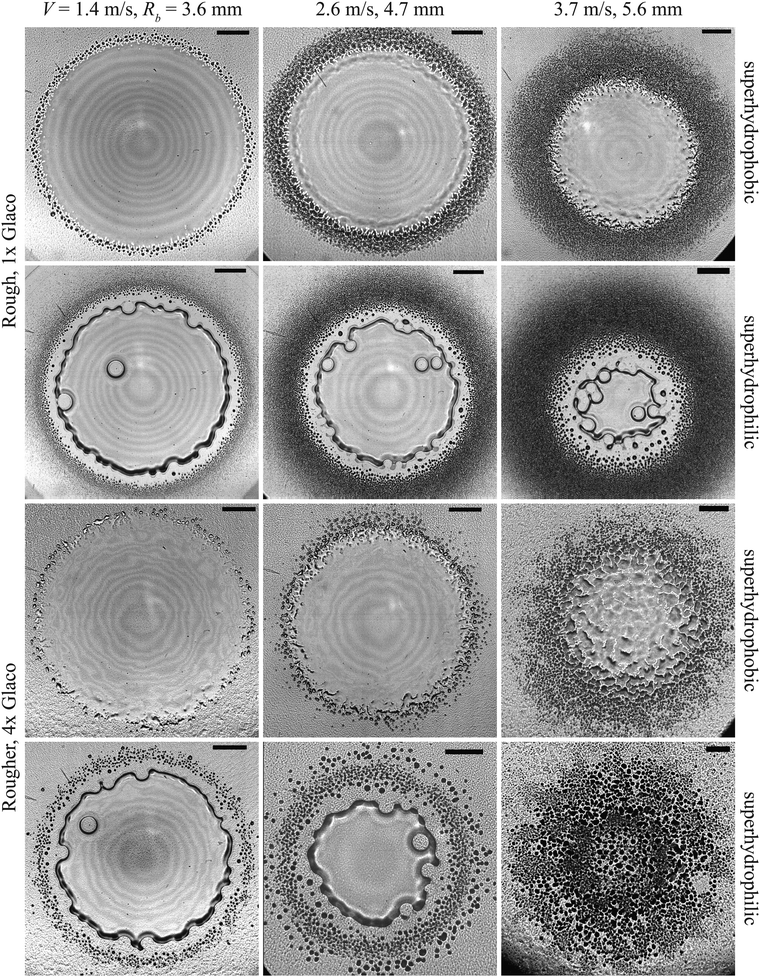
Fig. 5 compares bottom-view images for 3 impact velocities 7 μs after initial contact between the drop and each of the 4 nano-rough surfaces used in this study. Across all surfaces, an increase in the impact velocity resulted in a wider band of microbubbles entrained. The effect of the roughness on the dynamics of the central entrapped bubble will now be discussed in Section 3.1, the effects of the size of the roughness on the formation of microbubbles will be discussed in Section 3.2. The effects of the surface wettability will be discussed in Section 3.3, and the mechanisms for the formation of the microbubbles are discussed in Section 3.4.
3.1 Central entrapped air disc
The behavior of the entrapped air disc qualitatively follows what would be expected for impacts onto a smooth surface as the impact velocity is increased, both the centerline height, H*, and radial extent, L0, of the air disc decrease with increasing velocity. As the compressibility parameter, ε−1, increases, the effects of compressibility are also seen as a further decrease in the centerline height of the air disc at impact. However, when quantitative comparisons are made between our measurements and theories from the literature, both the centerline height and radial extent are over-predicted with the mismatch being larger for larger scale roughness; thus, the scaling laws require adjustment to retain reasonable predictive capability.Starting with the centerline height, H*, Mandre et al.14 proposed that the centerline height scales as H* = 3.4RbSt2/3 for incompressible cushioning and as H*/RbSt2/3 = 3.2ε1/3 for adiabatic compression. The work of Li and Thoroddsen11 showed that the adiabatic compression was a reasonable fit to experimental data but provided a slight empirical correction to H*/RbSt2/3 = 4.2ε0.4, which fit the data better in the range of their experiments.
Our raw measurements show relative centerline heights at first contact that are smaller than those predicted by theory. Since we are using monochromatic interferometry, a reference height is required to determine the absolute height of the droplet profile. For a smooth surface the point of first contact with the solid surface is taken as the zero height, but in the case we are considering at present, there are several possible options for the reference height: the mean roughness height, the RMS roughness, the lowest valley, etc. Keep in mind that the measured value is relative to the first observed contact and as the drop approaches the surface, it first comes into contact with the tallest asperities of the roughness. Therefore, we presume that the tallest asperities are approximately 3 times the RMS value Rq, we add this to our measured value,  and recover the values predicted by the theory of Mandre et al.,
 | (6) |
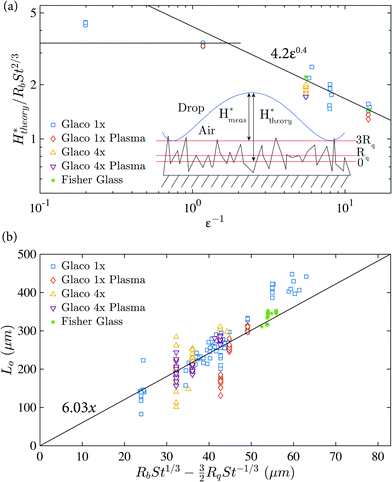 | ||
| Fig. 6 (a) Plot of normalized centerline height of the central air disc at first contact versus the compressibility parameter ε−1. The measured values of H* have been augmented by 3 times the RMS roughness value Rq as in eqn (6). (b) Plot of radial extent of central air disc showing experimental data compared with eqn (7) with a = 3/2. | ||
Interferometric measurements were not possible for the lowest and highest velocity impacts onto the 4 times coated surfaces. At the lowest velocities of V = 0.66 m s−1, the profile is significantly distorted by the presence of the large hierarchical structures of the roughness. Whereas at the highest velocities, the thickness of the air disc is of the same order as the tallest roughness asperities causing the disc to breakup into small microbubbles of a similar size to the main band of entrained microbubbles at the outer edge of the central contract.
To obtain an expression for the radial extent of the air disc, we follow the scaling arguments of Mandre et al.14 making some adjustments to account for the roughness of the surface. As the droplet approaches the surface with a velocity V, the dimple begins to form under the center when the drop is at a height H = RbSt2/3 above the surface. To account for the surface roughness, we lessen the height H by a multiple of the RMS surface roughness, H′ = H − aRq, where a is a fitting constant. This gives a time scale for the formation of the central disk as τ = H′/V = (RbSt2/3 − aRq)/V. The kink at the edge of the central dimple moves outward with a constant large velocity, U ∼ VSt−1/3.11 The radial extent of the dimple and thus the central air disk at first contact can then be calculated by determining how far the kink moves over the characteristic time τ,
| L0 = Uτ = B(RbSt1/3 − aRqSt−1/3), | (7) |
For both H* and L0, the largest deviations occur for the lowest velocity impacts onto the 1 time coated surfaces. In both cases, the measured value is larger than the predicted value. Physically, the disagreement is self-consistent, since the centerline height is larger than predicted, the kink in the bottom of the droplet has more time to travel outward thus entrapping a larger radius disc. The Weber number of these low-speed impacts is 16, which is in the similar regime where Bouwhuis et al.17 denoted the transition from a surface tension dominated regime to an inertia dominated regime and where they noted maximal bubble entrainment occurs.
3.2 Effects of roughness size
As discussed in the previous section, the surface roughness has the effect of decreasing the radial extent of the central air disc as well as modifying the reference height used for interferometry. It also plays a significant role in the formation of microbubbles in the band surrounding the central air disc. The average microbubble diameter, dmb for the superhydrophobic Glaco 1× surface is 10–15 μm, top row of Fig. 5. For the superhydrophilic counterpart, the average bubble size is much smaller, near 1 μm, second row of Fig. 5. In contrast, for the 4 times coated superhydrophobic surfaces, the average bubble diameter was ∼11 μm, third row of Fig. 5, and the average diameter ranged from 8–20 μm for the superhydrophilic 4 times coated surface, with higher impact velocities entrapping slightly larger bubbles, last row of Fig. 5.Given a surface characterization such as in Fig. 2, the expected size of microbubbles within the band can be estimated by measuring the distance between the peaks of the roughness that are at least as tall as the RMS value. For the 1 times coated surface, the average distance between peaks was 2.2 μm. For the superhydrophilic surfaces, the measured average bubble diameter was 1.5 μm or less across all impact velocities, which is in reasonable agreement; on the other hand, the measured bubble size on the superhydrophobic case gives an average diameter of 11–15 μm. This means that the contact lines of the microbubbles are pinned on asperities taller than Rq. If we instead look at the distance between peaks that are taller than 3Rq, we find that the average distance is 11 μm.
For the 4 times coated surface, the distance between roughness peaks >Rq was 10 μm. Again, this corresponds reasonably well with the measured diameter of microbubbles on both the superhydrophobic, measured as 11 μm, and superhydrophilic, measured between 8–11 μm, surfaces. For some of the superhydrophilic surfaces at moderate impact velocities, there is an inner ring of evenly distributed microbbules of roughly the same size surrounded by an outer ring of larger bubbles less evenly distributed (see the middle panel in the bottom row of Fig. 5). The larger bubbles are about 1.5 times the size of the distance between peaks. The difference can be attributed to the different ways in which the bubbles in the inner and outer rings are formed, which will be discussed in Section 3.4.
Fig. 7 shows a plot of the measured width of the band of microbubbles, w, as a function of the Stokes number. Notably as the impact velocity increases (smaller values of St), the bandwidth increases also. The superhydrophilic cases also have much wider bands due to the formation of the outer ring of bubbles as mentioned in the preceding paragraph. While the data does not collapse onto a single line, the bandwidth of microbubbles has an overall trend, w/Rq ∼ St−4/3.
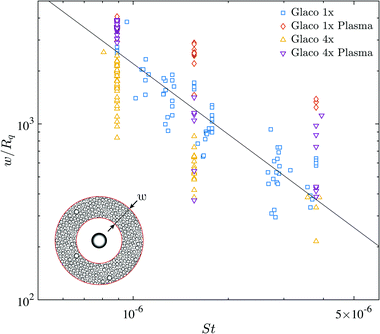 | ||
| Fig. 7 Plot of the maximum radial width of the entrapped band of microbubbles versus the Stokes number. The solid line has a slope of −4/3. | ||
The number of microbubbles contained within the band can be estimated by modeling the band as a set of circles whose diameter is equal to the average diameter of microbubbles for the given surface, dmb, spaced with a third of a diameter between adjacent circles,
 | (8) |
In Fig. 5, the top left panel has approximately 400 microbubbles with an average diameter of 11.3 ± 2.3 μm. Eqn (8) estimates that there are between 327 and 485 microbubbles. In the middle bottom panel of the same figure, there are about 900 microbubbles with an average diameter of about 14.2 ± 3.4 μm, and the above equation estimates there are between 480 and 1389 microbubbles. Applying this to the case from the second row and third column, where the average bubble diameter is less than 1.5 μm and there are too many to count manually, this would estimate that there are at least 1.2 × 10⁵ microbubbles contained within the cloud of bubbles.
3.3 Effects of surface wettability
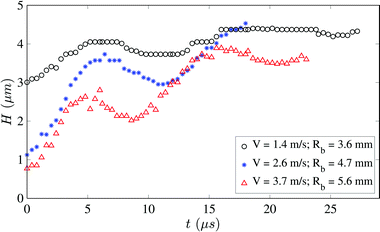
The main effect of the wettability of the substrate is on the dynamics of the contact lines of the central bubble and microbubbles. For the superhydrophobic surfaces, the contact lines are all pinned and remain nearly static. For impacts within the incompressible regime (ε−1 < 1), the central bubble retains a spherical cap shape formed during the impact. When the compressibility of the intervening air layer is significant (i.e., ε−1 > 1), the entrapped air disc rapidly expands after contact is fully made with the substrate and then oscillates in place since the contact lines are pinned.Fig. 8 shows traces of the centerline height, H, of the air disc as it oscillates due to compression and expansion for impacts at 3 separate velocities onto a surface coated 1 time with Glaco coating. The contact line is pinned at the location of first contact. In all 3 cases, the disc expands, then compresses slightly, and then continues to expand reaching a higher peak height on the second expansion indicating that the disc does not fully expand during the first rapid expansion. This can explain why there was a larger final volume of air measured in the bubble after the disc had fully contracted than the volume measured in the disc after the first expansion as noted by Li and Thoroddsen.11
The frequency at which the air disc oscillates is also of interest. Measuring the half-period from the peak of the first expansion to the subsequent valley for each of the cases shown in Fig. 8 gives frequencies of oscillation of 101.6 kHz, 102.3 kHz, and 142.3 kHz, for velocities of 1.4 m s−1, 2.6 m s−1 and 3.7 m s−1, respectively with the frequency slowing with additional oscillations.
Minnaert41 proposed that a bubble should have a resonant frequency of
 | (9) |
In the case of the superhydrophilic surfaces, the central disc and all of the microbubbles contract. For low and moderate velocities, this resulted in a large central bubble and a band of much smaller microbubbles around the perimeter of first contact and extending further radially. For the highest velocities in our experiments, where the height of the central disc at impact is of the same order as the largest roughness asperities, the central disc contracts into myriad microbubbles of the same size as the bubbles around the periphery as shown in the bottom right panel of Fig. 5.
In all cases, the hydrophilic surfaces entrained more microbubbles than the hydrophobic counterpart. This is due to the bubbles that are entrained by the motion of the contact line and the instability of the plastron, which is discussed in more detail in Section 3.4.
3.4 Microbubble formation
Fig. 9 and 10 show time series of the initial contact and formation of the bands of microbubbles for 1 time coated surfaces and 4 times coated surfaces, respectively. When comparing the formation of the microbubbles between the two different roughnesses, it is evident that the overall bubble formation process is longer for the rougher surface, ∼7 μs, versus ∼2 μs for the smoother surface.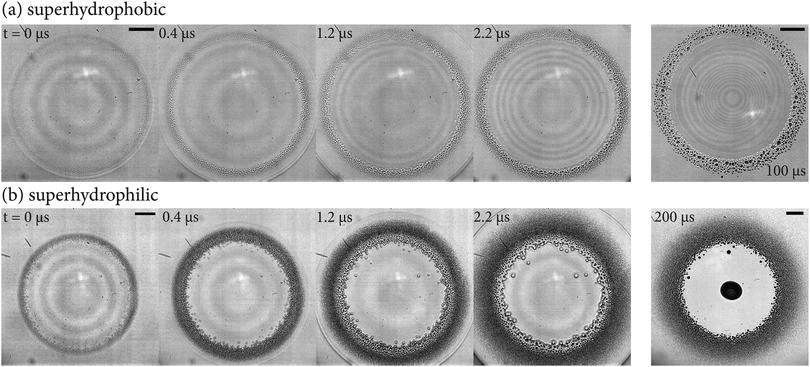 | ||
| Fig. 9 Time series images from the bottom view of drop impacts (V = 2.7 m s−1, Rb = 4.1 mm) on to surfaces coated one time with Glaco (a) superhydrophobic, (b) superhydrophilic. On the superhydrophobic surface, the central entrapped air disk does not contract as the contact line remains pinned, last panel of (a). The last panel of (b) shows the impact on the superhydrophilic surface after the central bubble has fully contracted. Times are relative to first touchdown. Scale bars are 100 μm long. Supplemental videos available online (ESI†). | ||
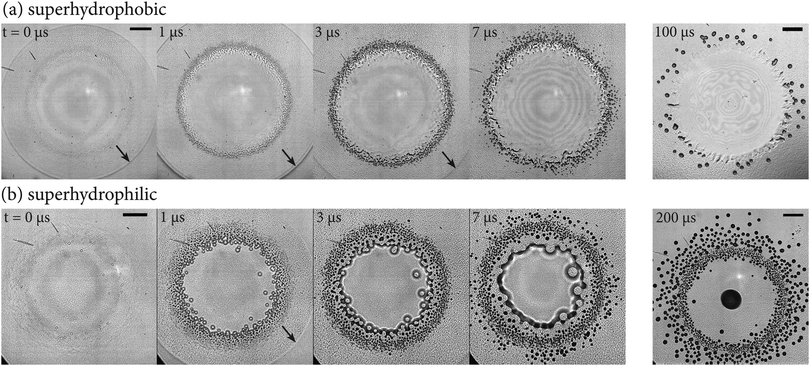 | ||
| Fig. 10 Time series images from the bottom view of drop impacts (V = 2.6 m s−1, Rb = 4.7 mm) on to surfaces coated four times with Glaco (a) superhydrophobic, (b) superhydrophilic. On the superhydrophobic surface, the central entrapped air disk does not contract as the contact line remains pinned, see last panel of (a). The last panel of (b) shows the impact on the superhydrophilic surface after the central bubble has fully contracted. Between 7 and 200 μs microbubbles continue to form on the outer edges of the impact region in the superhydrophilic case. Times are relative to first touchdown. Scale bars are 100 μm long. Black arrows mark the edge of the spreading drop. Supplemental videos available online (ESI†). | ||
We have identified 3 mechanisms for microbubble formation: (I) the drop penetrating the roughness, (II) entrapment of bubbles due to movement of the contact line, and (III) breakdown of the plastron.
Mechanism I occurs during the initial contact of the drop and solid surface and entraps a relatively even distribution of bubbles of a similar size around the perimeter of the contact. This entrapment occurs due to the drop fully penetrating the nano-rough texture of the surface. Unlike the case of impact onto a micropillar array, here the gas below the drop center has no direct escape path and therefore gets trapped in the valleys of the roughness. The size of these microbubbles are indicative of the lateral distances between the roughness peaks as discussed in Section 3.2. The width of the band of microbubbles entrapped due to this mechanism is similar for both the superhydrophobic and superhydrophilic cases and occurs within the 1–3 μs after first contact as shown in Fig. 9 and 10.
Mechanism II occurs as the contact line of the entrapped central air disc moves inward owing to the contraction of the central bubble. Thoroddsen et al.42 noted a similar phenomenon that occurs during the outward motion of the contact line as an impacting viscous drop spreads rapidly along a solid surface. In their experiments, localized contacts between levitated lamella and the solid surface ahead of the advancing contact line caused air bubble entrapment when reached by the contact line. Similar entrapment was evidenced in studies by Driscoll et al.43 and Palacios et al.44 In our study, the localized contacts ahead of the moving contact line are caused by the roughness asperities contacting the top of the contracting air film, as also noted by Li et al.,22 see their Fig. 1. Since the contact line of the central disc is pinned on the superhydrophobic surfaces, this mechanism is only seen for the superhydrophilic cases. This mechanism is active until the central air disc becomes significantly thicker than the tallest roughness asperities. The central air disc fully contracts within ∼ 100 μs which is similar to the contraction time of the central bubble on a smooth surface.8
Mechanism III occurs simultaneously with mechanism II after the drop has spread radially outward beyond the first contact. These bubbles result from the breakdown of the plastron, or thin layer of air trapped between the liquid and valleys of the roughness. Naturally, the hydrophilic surfaces cannot sustain the plastron and thus myriad microbubbles are easily formed. In isolated instances we have observed this on superhydrophobic surfaces, which can be attributed to the break down of the coating.
In many cases these bubbles are not formed immediately upon the wetting of the surface but pop up slightly later at random times. Fig. 10(b) shows these bubbles popping up around the entire periphery starting about 3 μs after first contact. Note that by this time the drop has spread well beyond the region where the bubbles appear.
Fig. 11(a) shows a zoomed-in frame sequence of the formation of a microbubble by the breakdown of the plastron. The bubble is nucleated and grows to its final size in approximately 800 nanoseconds. The plastron does not break down at a single moment but over time, so although the formation of a single bubble happens rapidly, the formation of the outer ring of larger bubbles takes several microseconds. The plastron breakdown also is not limited to occurring only near the point of impact. Fig. 11(b) shows an example of bubbles that are formed several hundred micrometers from the band of microbubbles formed at first contact. The bubbles that are formed further away are infrequent and appear on a longer time scale than those closer to the main band of bubbles.
After the initial formation of the microbubbles, the closely packed microbubbles can coalesce with neighboring bubbles. This occurs on both the superhydrophobic and superhydrophilic surfaces, compare the last two panels of Fig. 10(a and b).
4 Conclusions
In this study, we investigated the effects of nano-scale roughness on the entrainment of air during drop impacts onto solid surfaces. Two separate values of surface roughness were used (Rq = 70 nm and 138 nm) with each surface having a superhydrophilic and superhydrophobic counterpart. A central air disc is entrapped due to deformation of the drop by the intervening air layer prior to impact. The centerline height of the central air disc is similar to that for impacts onto smooth surfaces using a measurement reference height of 3Rq while the radial extent is smaller than expected from previous theories; however, this can be corrected by accounting for the surface roughness as given in eqn (7). When the predicted thickness of the air disc is of a similar magnitude to the tallest asperities of the roughness, the entrapped disc breaks down into small bubbles.Myriad microbubbles are entrained in the region surrounding the central disc ranging in size from <1 μm to as much as 20 μm, depending on the lateral distance between roughness peaks. Three mechanisms were identified for the formation of these bubbles: (I) air entrapment due to the drop penetrating the roughness at first contact, (II) air entrapment due to local contacts ahead of a retracting contact line, and (III) air entrapment due to the breakdown of the plastron.
The dynamics studied in this paper have been limited to the formation and very early dynamics of these microbubbles. The lifetime and ultimate fate of these microbubbles remains an open question that merits further study. As discussed by Lohse and Zhang,45 liquid impacts onto rough surfaces are a method for generating nanobubbles that can have surprisingly long lifetimes of days. Herein, we have shown that the sizes and density of such entrained bubbles are sensitive to the impact conditions.
In applications where air entrainment is undesirable, the smoothness of the surface is paramount as hierarchical roughness of even a few tens of nanometers entrains a band of multitudinous microbubbles in addition to the central air disc.
Conflicts of interest
The authors declare no conflicts of interest.Acknowledgements
The authors would like to thank Peter Hicks for useful discussions. The work reported herein was supported by funding from King Abdullah University of Science and Technology (KAUST) under Grant No. URF/1/2621-01-01. E. Q. Li acknowledges the Thousand Young Talents Program of China, the National Natural Science Foundation of China (Grant No. 11772327, 11642019, & 11621202) and Fundamental Research Funds for the Central Universities (Grant No. WK2090050041).References
- A. L. Yarin, Annu. Rev. Fluid Mech., 2006, 38, 159–192 CrossRef.
- C. Josserand and S. T. Thoroddsen, Annu. Rev. Fluid Mech., 2016, 48, 365–391 CrossRef.
- H. Yi, L. H. Qi, J. Luo, Y. Jiang and W. Deng, Appl. Phys. Lett., 2016, 108, 041601 CrossRef.
- D. Shen, G. Zou, L. Liu, W. W. Duley and Y. Norman Zhou, Soft Matter, 2016, 12, 295–301 RSC.
- S. Chandra and C. T. Avedisian, Proc. R. Soc. London, Ser. A, 1991, 432, 13–41 CrossRef.
- S. T. Thoroddsen and J. Sakakibara, Phys. Fluids, 1998, 10, 1359–1374 CrossRef.
- D. B. van Dam and C. Le Clerc, Phys. Fluids, 2004, 16, 3403–3414 CrossRef.
- S. T. Thoroddsen, T. G. Etoh, K. Takehara, N. Ootsuka and Y. Hatsuki, J. Fluid Mech., 2005, 545, 203–212 CrossRef.
- M. M. Driscoll and S. R. Nagel, Phys. Rev. Lett., 2011, 107, 154502 CrossRef PubMed.
- J. de Ruiter, F. Mugele and D. van den Ende, Phys. Fluids, 2015, 27, 012104 CrossRef.
- E. Q. Li and S. T. Thoroddsen, J. Fluid Mech., 2015, 780, 636–648 CrossRef.
- F. T. Smith, L. Li and G. X. Wu, J. Fluid Mech., 2003, 482, 291–318 CrossRef.
- A. A. Korobkin, A. S. Ellis and F. T. Smith, J. Fluid Mech., 2008, 611, 365–394 Search PubMed.
- S. Mandre, M. Mani and M. P. Brenner, Phys. Rev. Lett., 2009, 102, 134502 CrossRef PubMed.
- P. D. Hicks and R. Purvis, J. Fluid Mech., 2010, 649, 135–163 CrossRef.
- P. D. Hicks and R. Purvis, J. Fluid Mech., 2013, 735, 120–149 CrossRef.
- W. Bouwhuis, R. C. A. Van Der Veen, T. Tran, D. L. Keij, K. G. Winkels, I. R. Peters, D. Van Der Meer, C. Sun, J. H. Snoeijer and D. Lohse, Phys. Rev. Lett., 2012, 109, 264501 CrossRef PubMed.
- K. Langley, E. Q. Li and S. T. Thoroddsen, J. Fluid Mech., 2017, 813, 647–666 CrossRef.
- E. Q. Li, K. R. Langley, Y. S. Tian, P. D. Hicks and S. T. Thoroddsen, Phys. Rev. Lett., 2017, 119, 214502 CrossRef PubMed.
- J. M. Kolinski, S. M. Rubinstein, S. Mandre, M. P. Brenner, D. A. Weitz and L. Mahadevan, Phys. Rev. Lett., 2012, 108, 074503 CrossRef PubMed.
- J. M. Kolinski, L. Mahadevan and S. M. Rubinstein, EPL, 2014, 108, 24001 CrossRef.
- E. Q. Li, I. U. Vakarelski and S. T. Thoroddsen, J. Fluid Mech., 2015, 785, R2 CrossRef.
- I. U. Vakarelski, N. A. Patankar, J. O. Marston, D. Y. C. Chan and S. T. Thoroddsen, Nature, 2012, 489, 274–277 CrossRef PubMed.
- A. Jetly, I. U. Vakarelski and S. T. Thoroddsen, Soft Matter, 2018, 14, 1608–1613 RSC.
- R. Blossey, Nat. Mater., 2003, 2, 301–306 CrossRef PubMed.
- P. Tourkine, M. Le Merrer and D. Quéré, Langmuir, 2009, 25, 7214–7216 CrossRef PubMed.
- C. Antonini, A. Amirfazli and M. Marengo, Phys. Fluids, 2012, 24, 102104 CrossRef.
- D. Bartolo, F. Bouamrirene, E. Verneuil, A. Buguin, P. Silberzan and S. Moulinet, Europhys. Lett., 2006, 74, 299–305 CrossRef.
- L. Courbin, E. Denieul, E. Dressaire, M. Roper, A. Ajdari and H. A. Stone, Nat. Mater., 2007, 6, 661–664 CrossRef PubMed.
- M. A. Raza, J. Van Swigchem, H. P. Jansen, H. J. W. Zandvliet, B. Poelsema and E. S. Kooij, Surf. Topogr.: Metrol. Prop., 2014, 2, 035002 CrossRef.
- M. Reyssat, A. Pépin, F. Marty, Y. Chen and D. Quéré, Europhys. Lett., 2006, 74, 306–312 CrossRef.
- M. Reyssat, D. Richard, C. Clanet and D. Quéré, Faraday Discuss., 2010, 146, 19–33 RSC.
- L. Xu, L. Barcos and S. R. Nagel, Phys. Rev. E: Stat., Nonlinear, Soft Matter Phys., 2007, 76, 66311 CrossRef PubMed.
- T. Tran, H. J. J. Staat, A. Susarrey-Arce, T. C. Foertsch, A. van Houselt, H. J. G. E. Gardeniers, A. Prosperetti, D. Lohse and C. Sun, Soft Matter, 2013, 9, 3272 RSC.
- T. Maitra, C. Antonini, M. K. Tiwari, A. Mularczyk, Z. Imeri, P. Schoch and D. Poulikakos, Langmuir, 2014, 30, 10855–10861 CrossRef PubMed.
- P. Tsai, M. H. W. Hendrix, R. R. M. Dijkstra, L. Shui and D. Lohse, Soft Matter, 2011, 7, 11325–11333 RSC.
- R. C. A. van der Veen, M. H. W. Hendrix, T. Tran, C. Sun, P. A. Tsai and D. Lohse, Soft Matter, 2014, 10, 3703–3707 RSC.
- P. D. Hicks and R. Purvis, J. Eng. Math., 2017, 102, 65–87 CrossRef.
- K. R. Langley, E. Q. Li and S. T. Thoroddsen, in The Micro-World Observed by Ultra High-Speed Cameras: We See What You Don't See, ed. K. Tsuji, Springer International Publishing AG, 2017, pp. 321–341 Search PubMed.
- M. J. Thoraval, K. Takehara, T. G. Etoh and S. T. Thoroddsen, J. Fluid Mech., 2013, 724, 234–258 CrossRef.
- M. Minnaert, London, Edinburgh, Dublin Philos. Mag. J. Sci., 1933, 16, 235–248 CrossRef.
- S. T. Thoroddsen, K. Takehara and T. G. Etoh, Phys. Fluids, 2010, 22, 051701 CrossRef.
- M. M. Driscoll, C. S. Stevens and S. R. Nagel, Phys. Rev. E: Stat., Nonlinear, Soft Matter Phys., 2010, 82, 036302 CrossRef PubMed.
- J. Palacios, J. Hernandez, P. Gomez, C. Zanzi and J. Lopez, Exp. Fluids, 2012, 52, 1449–1463 CrossRef.
- D. Lohse and X. Zhang, Rev. Mod. Phys., 2015, 87, 981–1035 CrossRef.
Footnotes |
| † Electronic supplementary information (ESI) available. See DOI: 10.1039/c8sm01070f |
| ‡ Note that this definition of the Stokes number, often used in drop-impact studies, is the inverse of the traditionally defined Stokes number. |
| This journal is © The Royal Society of Chemistry 2018 |

