 Open Access Article
Tuning the phase transition temperature of ferronematics with a magnetic field
Tibor
Tóth-Katona
 *a,
Veronika
Gdovinová
 b,
Natália
Tomašovičová
 b,
Nándor
Éber
a,
Katalin
Fodor-Csorba
a,
Alena
Juríková
b,
Vlasta
Závišová
b,
Milan
Timko
b,
Xavier
Chaud
c and
Peter
Kopčanský
b
b,
Nándor
Éber
a,
Katalin
Fodor-Csorba
a,
Alena
Juríková
b,
Vlasta
Závišová
b,
Milan
Timko
b,
Xavier
Chaud
c and
Peter
Kopčanský
b
aInstitute for Solid State Physics and Optics, Wigner Research Centre for Physics, Hungarian Academy of Sciences, P.O. Box 49, H-1525 Budapest, Hungary. E-mail: tothkatona.tibor@wigner.mta.hu; Tel: +36 1 392 2222
bInstitute of Experimental Physics, Slovak Academy of Sciences, Watsonova 47, 040 01 Košice, Slovakia
cGrenoble High Magnetic Field Laboratory, CNRS, 25 Avenue des Martyrs, Grenoble, France
First published on 29th January 2018
Abstract
The influence of magnetic field on the isotropic-to-nematic phase transition temperature is investigated in neat bent-core and calamitic liquid crystals, in their mixture, and in samples doped with spherical magnetic nanoparticles for two different orientations of the magnetic field. A magnetic-field-induced negative or positive shift of the transition temperature was detected depending on the magnetic field orientation with respect to the initial orientation of the nematic phase, and on the type of liquid crystal matrix.
1 Introduction
Suspensions of magnetic nanoparticles (MNPs) in nematic liquid crystals, the so-called ferronematics (FNs), have become a promising target for experimental and theoretical studies in many aspects.1–3 As a representative example, the presence of the magnetic admixture may enhance the magnetic susceptibility of ferronematics in comparison to that of the undoped nematic liquid crystals and allows controlling their orientation with much lower magnetic fields.4 It has recently been demonstrated5–7 that even a very low magnetic field (of induction B < 0.1 T) may induce a significant optical or dielectric response in ferronematics. It was shown theoretically,8 as well as experimentally,9 that the presence of any solid admixture may also affect the temperature of the isotropic-to-nematic phase transition. Moreover, it has been demonstrated10 that in calamitic liquid crystals doped with rod-like MNPs, the magnetic field-induced isotropic-to-nematic phase transition can be just as effective as in bent-core nematics.11,12 Recently, a consistent molecular mean-field theoretical model has been developed by Raikher et al. for the field-induced shift of the temperature of the equilibrium isotropic-to-nematic phase transition (clearing point) in ferronematics.13 It has been shown that, depending on the anchoring conditions at the surface of the rod-like particle, the particles might either increase or decrease the clearing temperature of the suspension, and that the expected magnitude of the effect depends on the material parameters of the ferronematics. The theoretically predicted, magnetic field-induced decrease of the clearing temperature13 has been demonstrated experimentally in our recent work14 in the 50![[thin space (1/6-em)]](https://www.rsc.org/images/entities/char_2009.gif) :
:![[thin space (1/6-em)]](https://www.rsc.org/images/entities/char_2009.gif) 50 wt% mixture of the bent-core 4,6-dichloro-1,3-phenylene bis(4′-(10-undecenyloxy)biphenyl-4-carboxylate) (11DClPBBC) and the calamitic 4-n-octyloxyphenyl 4-n-hexyloxybenzoate (6OO8) liquid crystals (LCs) doped with spherical magnetic particles in a volume fraction of ϕ = 2 × 10⁻⁴.
50 wt% mixture of the bent-core 4,6-dichloro-1,3-phenylene bis(4′-(10-undecenyloxy)biphenyl-4-carboxylate) (11DClPBBC) and the calamitic 4-n-octyloxyphenyl 4-n-hexyloxybenzoate (6OO8) liquid crystals (LCs) doped with spherical magnetic particles in a volume fraction of ϕ = 2 × 10⁻⁴.
The present work is devoted to reveal experimentally the background of this magnetic-field-induced “negative shift” (decrease) of the phase transition temperature by investigating the response to magnetic fields of the individual LC compounds mentioned above, their 50![[thin space (1/6-em)]](https://www.rsc.org/images/entities/char_2009.gif) :
:![[thin space (1/6-em)]](https://www.rsc.org/images/entities/char_2009.gif) 50 wt% binary mixture, and by studying the influence of doping these materials with magnetic particles in a much higher volume fraction than that employed in ref. 14. To our expectations, the increase of the volume fraction of MNPs will lead to a larger magnetic-field-induced phase transition temperature shift, and on the other hand, will increase the aggregation tendency of the particles – the inevitable process, which is one of the central problems in the preparation of ferronematics, and in other colloidal systems in general.
50 wt% binary mixture, and by studying the influence of doping these materials with magnetic particles in a much higher volume fraction than that employed in ref. 14. To our expectations, the increase of the volume fraction of MNPs will lead to a larger magnetic-field-induced phase transition temperature shift, and on the other hand, will increase the aggregation tendency of the particles – the inevitable process, which is one of the central problems in the preparation of ferronematics, and in other colloidal systems in general.
2 Experimental
The synthesis and physical properties of the bent-core 11DClPBBC (as well as its single unit shorter alkyl-end-chain homologue 10DClPBBC) and the calamitic 6OO8 liquid crystals are described in ref. 15 and 16, respectively. Differential scanning calorimetry (DSC) and polarizing microscopic observations have shown complete miscibility of 6OO8 with 10DClPBBC, and a considerable expansion of the mesophase temperature range around their eutectic mixture (≈50![[thin space (1/6-em)]](https://www.rsc.org/images/entities/char_2009.gif) :
:![[thin space (1/6-em)]](https://www.rsc.org/images/entities/char_2009.gif) 50 wt%).17 A similar miscibility is expected for the 11DClPBBC-6OO8 system. Moreover, 11DClPBBC possesses a considerably wider temperature range of the nematic phase (extending to lower temperatures) than that of 10DClPBBC.15
50 wt%).17 A similar miscibility is expected for the 11DClPBBC-6OO8 system. Moreover, 11DClPBBC possesses a considerably wider temperature range of the nematic phase (extending to lower temperatures) than that of 10DClPBBC.15
The synthesis of the spherical magnetic nanoparticles was based on co-precipitation of Fe2+ and Fe3+ salts by NH4OH at 60 °C. To obtain a Fe3O4 precipitate, FeCl2·4H2O and FeCl3·6H2O were dissolved in deionized water by vigorous stirring. The Fe3+![[thin space (1/6-em)]](https://www.rsc.org/images/entities/char_2009.gif) :
:![[thin space (1/6-em)]](https://www.rsc.org/images/entities/char_2009.gif) Fe2+ ratio was 2
Fe2+ ratio was 2![[thin space (1/6-em)]](https://www.rsc.org/images/entities/char_2009.gif) :
:![[thin space (1/6-em)]](https://www.rsc.org/images/entities/char_2009.gif) 1. The solution was heated to 80 °C and 25% NH4OH was added. The precipitate was isolated from the solution by magnetic decantation upon washing with water. Oleic acid was used as a surfactant for the MNPs, in order to avoid their aggregation.
1. The solution was heated to 80 °C and 25% NH4OH was added. The precipitate was isolated from the solution by magnetic decantation upon washing with water. Oleic acid was used as a surfactant for the MNPs, in order to avoid their aggregation.
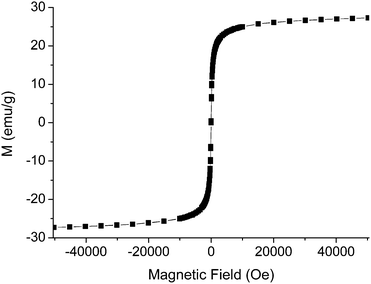
The magnetization curve of the powder of MNPs has been measured using a SQUID magnetometer (Quantum Design MPMS XL-5), and the results are presented in Fig. 1. The data clearly indicate superparamagnetic behavior of the nanoparticles.
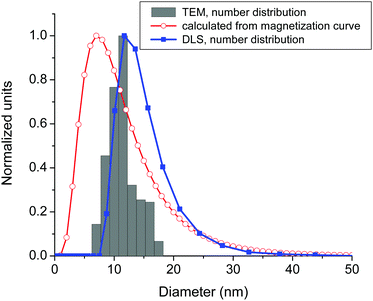
The size (diameter) distribution of the MNPs has been determined using different, independent methods. The results obtained using a transmission electron microscope (TEM) have already been reported;18 however, we have shown those data again in Fig. 2 (histogram) for an easier comparison with the results of other methods. The number-distribution of the hydrodynamic diameter of the particles was determined using dynamic light scattering measurements (DLS, Zetasizer, Malvern Instruments Ltd) and is also shown in Fig. 2 (closed squares). Moreover, in Fig. 2 we present the calculated magnetic-core-diameter obtained from the magnetization curves using the Langevin function19 (open circles). As one can see, the TEM and DLS results are in excellent agreement, taking into the account that TEM measurements provide information about the size of the magnetic core (without the surfactant), while DLS measures the diameter of the particle together with the surfactant and the eventual surface charge around the particle. The magnetic-core-diameter calculated from the magnetization curve somewhat underestimates the size of the particles, presumably because it assumes that all particles are magnetite, in contrast to the real experimental samples that also contain maghemite, hematite and other by-products of the preparation procedure. Based on these measurements, we estimate that the mean diameter of the nanoparticles is d = 11.6 nm with a relatively low polydispersity (which is important, as the polydispersity is known to promote aggregation in colloidal systems20).
Neat LC samples of the calamitic 6OO8 (RLC) and the bent-core 11DClPBBC (BLC), as well as their 50![[thin space (1/6-em)]](https://www.rsc.org/images/entities/char_2009.gif) :
:![[thin space (1/6-em)]](https://www.rsc.org/images/entities/char_2009.gif) 50 wt% mixture (BRLC) served as etalons for the magnetic field-induced phase transition temperature shifts to be observed in the respective ferronematics. These respective ferronematics (RS, BS and BRS) were obtained by doping the calamitic LC, the bent-core LC, and their mixture with MNPs in a high volume fraction of ϕ = 10−2. To ensure as homogeneous dispersion of particles as possible, a standard procedure has been employed. MNPs coated with an oleic acid layer were dissolved in cyclohexane. The solution was admixed with the corresponding LC in its isotropic phase, and then the solvent was allowed to evaporate during an ultrasonication process.
50 wt% mixture (BRLC) served as etalons for the magnetic field-induced phase transition temperature shifts to be observed in the respective ferronematics. These respective ferronematics (RS, BS and BRS) were obtained by doping the calamitic LC, the bent-core LC, and their mixture with MNPs in a high volume fraction of ϕ = 10−2. To ensure as homogeneous dispersion of particles as possible, a standard procedure has been employed. MNPs coated with an oleic acid layer were dissolved in cyclohexane. The solution was admixed with the corresponding LC in its isotropic phase, and then the solvent was allowed to evaporate during an ultrasonication process.
DSC measurements were performed using a TA Instruments Q2000 apparatus. The samples were encapsulated in sealed aluminium crucibles and then measured upon cooling from 120 °C with the rate of 2 °C min−1 in a protecting atmosphere of nitrogen flowing with the rate of 40 ml min−1.
The structural transitions in the samples were monitored by capacitance measurements in a capacitor made of indium-tin-oxide-coated glass electrodes, covered with a rubbed polyimide layer that assured the planar initial alignment (the nematic director n0 parallel with the bounding plates). The electrode area was approximately 0.5 cm × 0.5 cm, while the distance between the electrodes (sample thickness) was D = 20 μm. The capacitance was measured at a test voltage of U = 0.1 V, f = 1 kHz, using a high precision capacitance bridge Andeen Hagerling with an accuracy of 0.8 aF.
The capacitor was placed in a regulated thermostatic system. The actual temperature of the sample was measured using a calibrated Pt thermometer. The samples were heated above the clearing point (to approximately 110 °C). A constant magnetic induction B was applied either parallel with (Fig. 3(a)), or perpendicular to (see Fig. 3(b)) the surface of the electrodes and then the samples were cooled at a rate of 2 °C min−1. Variation of the capacitance with the change of the external field and/or the temperature reflects the appearance of the orientational order, as well as the re-orientation of the nematic molecules by the magnetic field.
 | ||
| Fig. 3 Experimental geometries used in capacitance measurements: (a) the magnetic induction B is parallel with the initial director n0; (b) B is normal to n0. | ||
3 Results and discussion
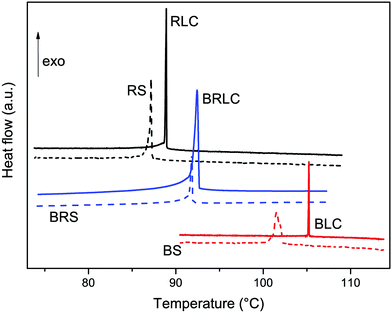
Typical DSC traces, indicating the occurrence of phase transitions upon cooling at a rate of 2 °C min−1, can be seen in Fig. 4. The isotropic-to-nematic phase transition was confirmed to occur for all samples. The temperatures of the isotropic-to-nematic phase transition (TIN), and the corresponding enthalpy changes are summarized in Table 1. Doping with magnetite nanoparticles decreased TIN in all studied samples. The reduction of the transition temperature was 3.68 °C for the bent-core BS, 1.75 °C for the calamitic RS, and 0.60 °C in the case of the BRS mixture. By the addition of the nanoparticles, the enthalpy of the phase transition roughly remains the same (BS), or slightly decreases (RS and BRS) compared to that of the neat LCs.| Sample | T IN (°C) | ΔH (J g−1) |
|---|---|---|
| RLC | 88.91 | 4.73 |
| RS | 87.16 | 4.25 |
| BLC | 105.23 | 1.46 |
| BS | 101.55 | 1.51 |
| BRLC | 92.43 | 2.85 |
| BRS | 91.83 | 1.99 |
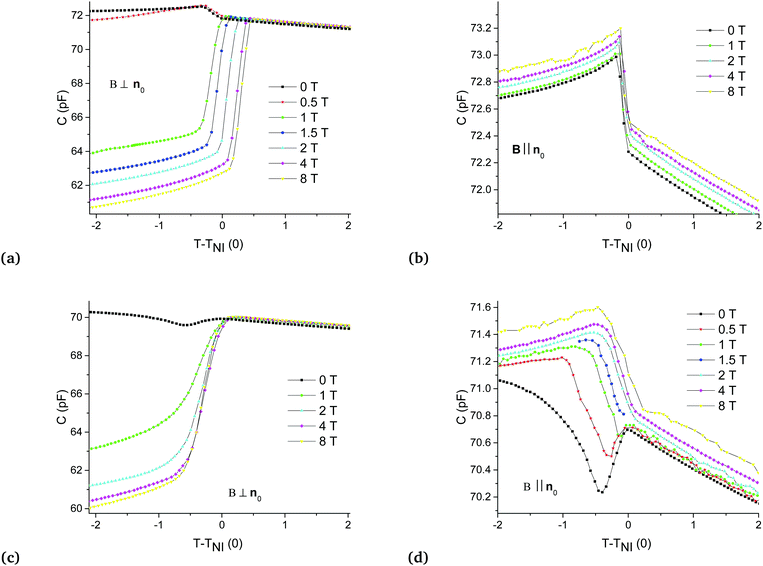
The magnetic field-induced isotropic-to-nematic phase transition was studied on the same materials using dielectric measurements. Fig. 5 shows the temperature dependence of the capacitance in the vicinity of the phase transition [TIN(0) is the onset temperature of the isotropic-to-nematic phase transition for B = 0] for the neat calamitic LC [RLC – Fig. 5(a) and (b)], and for the RLC doped with spherical magnetic particles [RS – Fig. 5(c) and (d)] in both B ⊥ n0 [Fig. 5(a) and (c)] and B ‖ n0 [Fig. 5(b) and (d)] experimental geometries. As one sees, in the B ‖ n0 geometry no significant change in the phase transition temperature is induced by the magnetic field [Fig. 5(b) and (d)]. The same holds for RLC in the B ⊥ n0 geometry [Fig. 5(a)]. In RS, however, in the presence of magnetic particles, the magnetic field induces a considerable negative shift in the transition temperature, e.g., ΔTIN = TIN(B) − TIN(0) ≈ −1.2 °C at B = 8 T [Fig. 5(c)].
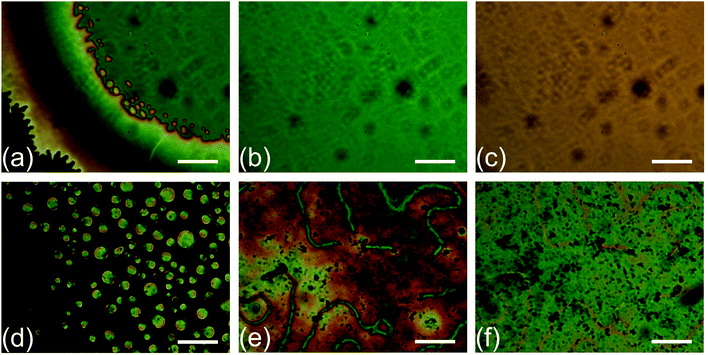
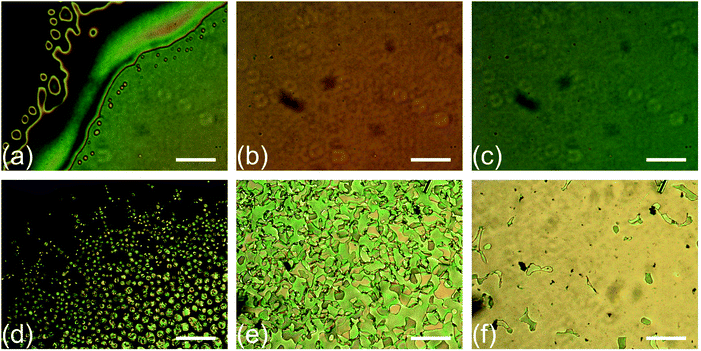
Fig. 5(c) and (d) also demonstrate an unusual temperature dependence of the capacitance for the RS sample: C(T) possesses a local extremum just below TIN(0) for all values of B in the B ‖ n0 geometry [Fig. 5(d)], and for small B in the B ⊥ n0 geometry [Fig. 5(c)]. To reveal the background of this unusual dependence, polarizing microscopy (POM) investigations have also been performed on the samples in the absence of a magnetic field. Fig. 6 shows microphotographs taken under a polarizing microscope with crossed polarizers for RLC [Fig. 6(a–c)] and RS [Fig. 6(d–f)] at different temperatures δT = T − TIN(0): δT = 0 [Fig. 6(a)], δT = −0.2 °C [Fig. 6(b)], δT = −1.1 °C [Fig. 6(c)], δT = 0 [Fig. 6(d)], δT = −0.5 °C [Fig. 6(e)], and δT = −1.4 °C [Fig. 6(f)]. Though both RLC and RS samples exhibit a certain temperature range of coexistence of isotropic and nematic phases, obviously, the isotropic-to-nematic phase transition scenario differs in RS from that in RLC. In RLC at δT = 0 the nematic phase appears as a front propagating through a certain part of the sample, with a varying thickness near the isotropic–nematic interface, and then the interface equilibrates. Far enough from the interface in the nematic phase the thickness of the nematic reaches the sample thickness, and the homogeneous planar orientation dictated by the boundary conditions is immediately established [see Fig. 6(a)]. With a slight further decrease of the temperature [δT = −0.2 °C, Fig. 6(b)] the phase transition is completed and a uniform planar orientation is obtained, which does not change with a further decrease of temperature [Fig. 6(c)]. In contrast, in RS, at δT = 0 the nematic phase appears in the form of unoriented droplets [Fig. 6(d)], which grow and coalesce with the decrease of temperature and finally, at δT = −0.5 °C the phase transition is finished and the nematic layer is formed [Fig. 6(e)]. However, the orientation of the nematic layer is not homogeneously planar: topological defects are formed (presumably because of the presence of nanoparticle aggregates), majority of which remain even in the case of further cooling as illustrated in Fig. 6(f) taken at δT = −1.4 °C.
In summary, POM investigations have revealed at the vicinity of TIN in the RS sample that the director field is not dictated only by the bounding surfaces (contrary to the case of RLC), but it is to a large extent influenced by the unoriented droplet state and by the presence of topological defects. This can explain the presence of the local extremum in C(T) dependence [Fig. 5(c) and (d)].
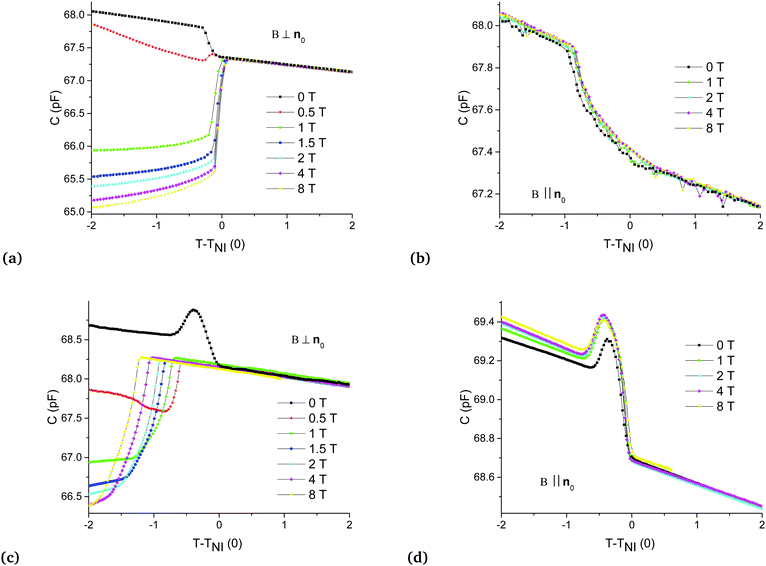
Fig. 7(a–d) show the temperature dependence of the capacitance of the neat BLC and of the nanoparticle-doped BS, respectively, for the B ⊥ n0 [Fig. 7(a) and (c)] and B ‖ n0 [Fig. 7(b) and (d)] geometries. The magnetic field induces a considerable positive shift of the phase transition temperature for the neat BLC in the B ⊥ n0 geometry, ΔTIN ≈ 0.5 °C at B = 8 T – Fig. 7(a). An even larger increase of ΔTIN ≈ 4 °C has been reported recently in another bent-core nematic compound upon the application of B = 1 T only.12 Such an extraordinary sensitivity to the magnetic field has been assigned to the peculiar biaxial-cluster structure of the cybotactic nematic phase Ncyb formed by the bent-core molecules. In the B ‖ n0 geometry the positive shift ΔTIN is almost negligible for BLC – see Fig. 7(b). Most interestingly, the presence of spherical magnetic particles inhibits the shift ΔTIN in the B ⊥ n0 geometry [cf.Fig. 7(c) and (a)], and at the same time enhances it in the B ‖ n0 geometry [cf.Fig. 7(d) and (b)]. One has to also note that the character of the C(T) dependence changes by doping with MNPs even in the absence of the magnetic field [cf.Fig. 7(a) and (c), as well as Fig. 7(b) and (d) for B = 0]. These observations suggest that the presence of magnetic particles strongly influences the ordering of BLC molecules.
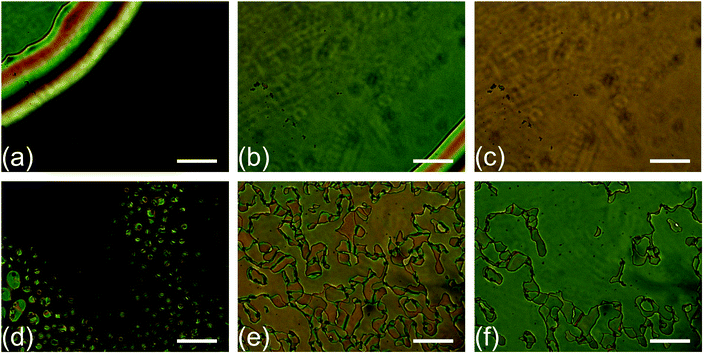
POM investigations on the phase transition in BLC and BS samples in the absence of the magnetic field has led to similar results as those obtained on RLC and RS. In BLC, at δT = 0 the nematic phase appears as a propagating front [Fig. 8(a)] in a narrow temperature range of phase coexistence [δT ≈ −0.2 °C, Fig. 8(b)], below which a homogeneous planar orientation dictated by the boundary conditions is established [Fig. 8(c)]. In BS, at δT = 0 the nematic phase appears in the form of unoriented droplets [Fig. 8(d)], which grow and coalesce in a much wider phase coexistence temperature range and finally, at δT = −0.9 °C the phase transition is finished and the nematic layer is formed [Fig. 8(e)]. However, similarly to the RS sample, the orientation of the nematic layer is not homogeneously planar: topological defects are formed, majority of which remain even in the case of further cooling as illustrated in Fig. 8(f) taken at δT = −1.5 °C.
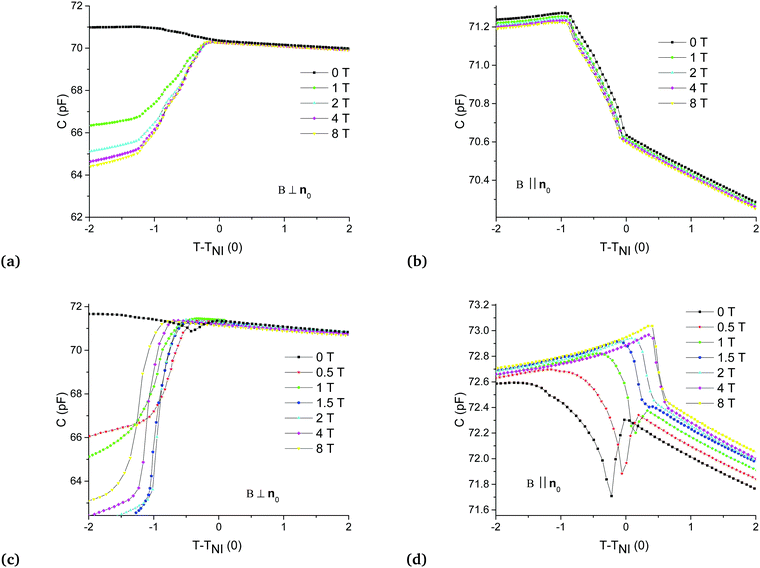
Lastly, the temperature dependence of the capacitance for the 50–50 wt% mixture of the bent-core 11DClPBBC and the calamitic 6OO8 LC (BRLC), and for the mixture doped with MNPs (BRS) is presented in Fig. 9(a)–(d), respectively, for both the B ⊥ n0 [Fig. 9(a) and (c)] and the B ‖ n0 [Fig. 9(b) and (d)] experimental geometries. Practically, no magnetic field-induced shift of the phase transition temperature has been observed in the BRLC sample, i.e., mixing the bent-core LC with the calamitic compound inhibits the magnetic field-induced positive shift of the phase transition temperature detected in the neat BLC in the B ⊥ n0 geometry (only the detailed analysis will reveal a slight negative shift of the order of the experimental error – see below). In the MNP-doped, BRS sample, however, large magnetic field-induced shifts of the phase transition temperature have been observed: ΔTIN ≈ −1.0 °C for B ⊥ n0, and ΔTIN ≈ +0.6 °C for B ‖ n0 at B = 8 T.
Polarizing optical microscopy on BRLC and BRS samples in the vicinity of the isotropic-to-nematic phase transition temperature has shown similar results to those obtained on the individual compounds RLC and BLC, as well as on their MNP-doped variants. In the case of BRLC [Fig. 10(a)–(c)], the phase transition occurs via propagating front of the nematic phase. The relatively narrow phase coexistence temperature range of the nematic and isotropic phases (δT < −0.4 °C) is roughly the same as those found in RLC and in BLC, and supports the statement of a complete miscibility of 11DClPBBC with 6OO8 (as it was found for 10DClPBBC and 6OO817). In the case of BRS [Fig. 10(d)–(f)], the phase transition appears via growing nematic droplets and ends in a non-homogeneous (non-planar) nematic phase, with lots of topological defects (disclination lines) persisting far below TNI (δT > −1.4 °C).
The results presented in Fig. 5, 7 and 9 can be summarized in terms of the magnetic induction dependence of the magnetic field-induced shift of the phase transition temperature ΔTIN. For that purpose, the phase transition temperatures TIN(B) have been determined using the common linear extrapolation method of the C(T) curves in Fig. 5, 7, and 9, in the vicinity of the phase transition temperature. The error in determination of ΔTIN using this method is estimated to be less than ±0.1 °C, and the obtained values are plotted in Fig. 11(a) and (b) for the undoped LCs and for the ferronematics, respectively.
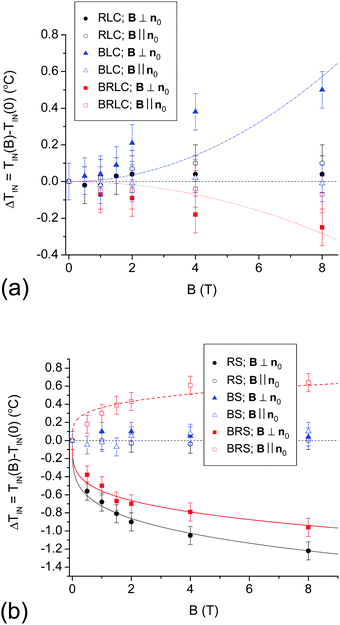 | ||
| Fig. 11 Magnetic field-induced shift of the isotropic-to-nematic phase transition temperature as a function of magnetic induction for undoped LCs (a), and for ferronematics (b). Full and empty symbols stand for B ⊥ n0 and B ‖ n0, respectively. The dashed-dotted and the dotted lines in subfigure (a) represent a one-parameter fit of eqn (1) for BLC and for BRLC in the B ⊥ n0 geometry, respectively. The three lines in subfigure (b) are one-parameter fits of eqn (2) for RS in the B ⊥ n0 geometry and for BRS in both geometries. The horizontal straight line denotes ΔTIN = 0 in both subfigures. | ||
Fig. 11(a) convincingly demonstrates the absence of magnetic field-induced shift of TIN in case of the RLC. This is not very surprising, because the estimated critical magnetic induction for the phase transition temperature shift in the case of traditional calamitic LCs is well over 100 T, and only a ΔTIN ≈ 0.005 °C shift has been measured at B = 15 T for the calamitic LC 8CB.21 For BLC, a positive magnetic field-induced shift ΔTIN of about 5 times larger than the experimental error has been detected in the B ⊥ n0 geometry. This is in agreement with the experimental finding obtained on the unoriented sample of another bent-core LC,11 as well as with theoretical expectations. Namely, based on simple thermodynamical arguments,21 the magnetic field-induced phase transition temperature shift in LCs is given by
 | (1) |
![[thin space (1/6-em)]](https://www.rsc.org/images/entities/char_2009.gif) :
:![[thin space (1/6-em)]](https://www.rsc.org/images/entities/char_2009.gif) 50 wt% BRLC mixture of calamitic and bent-core LCs, in the B ⊥ n0 geometry. A small, but measurable (about two times larger than the experimental error) negative shift ΔTIN < 0 has been detected, which follows reasonably well the quadratic dependence on B as shown in Fig. 11(a) (dotted line).22 This negative shift of ΔTIN cannot be explained in the frame of the simple thermodynamical consideration presented by eqn (1), because the rigid cores of both RLC and BLC components of the BRLC mixture are built of benzene rings, and therefore, χa > 0 is expected for the constituting compounds, as well as for their mixture. Consequently, according to eqn (1), ΔTIN should be >0. A similar negative shift of the phase transition temperature, which is in gross disagreement with the thermodynamical prediction of eqn (1) has been found in another calamitic compound EMBAC,23 however, for the nematic-to-smectic-A phase transition. To our knowledge a convincing explanation for the effect is still missing. As a further complication, in the B ‖ n0 geometry no magnetic field-induced shift of the phase transition temperature is detected for BRLC, indicating again the influence of the anchoring conditions at the bounding surfaces.
50 wt% BRLC mixture of calamitic and bent-core LCs, in the B ⊥ n0 geometry. A small, but measurable (about two times larger than the experimental error) negative shift ΔTIN < 0 has been detected, which follows reasonably well the quadratic dependence on B as shown in Fig. 11(a) (dotted line).22 This negative shift of ΔTIN cannot be explained in the frame of the simple thermodynamical consideration presented by eqn (1), because the rigid cores of both RLC and BLC components of the BRLC mixture are built of benzene rings, and therefore, χa > 0 is expected for the constituting compounds, as well as for their mixture. Consequently, according to eqn (1), ΔTIN should be >0. A similar negative shift of the phase transition temperature, which is in gross disagreement with the thermodynamical prediction of eqn (1) has been found in another calamitic compound EMBAC,23 however, for the nematic-to-smectic-A phase transition. To our knowledge a convincing explanation for the effect is still missing. As a further complication, in the B ‖ n0 geometry no magnetic field-induced shift of the phase transition temperature is detected for BRLC, indicating again the influence of the anchoring conditions at the bounding surfaces.
The consistent mean-field description of the magnetic field-induced phase transition temperature shift in ferronematics made of rod-like MNPs in nematic LCs predicts the quadratic dependence of ΔTIN on B at low magnetic fields only.13 On the other hand, according to the model, the magnetic field-induced alignment of MNPs saturates at rather low fields (∼1 T), and the temperature shift cannot exceed some limiting value of ΔTNI ≈ ±1.5 °C for the set of material parameters used in ref. 13. Most importantly, the model allows for both increase (positive shift) and decrease (negative shift) of the phase transition temperature under the action of magnetic field, depending on the sign of the coupling constant ω, which is the relative strength of the LC molecule–MNP vs. the molecule–molecule orientational couplings. For ω > 0 the temperature shift is positive, while for ω < 0 it is negative. In the absence of information about the relevant material parameters for our FN systems (for RS, BS, and BRS), and since the theoretical model13 is constructed for rod-like MNPs, in the following, instead of a quantitative comparison between the experimental data and the model, we will make some qualitative analysis and conclusions.
The magnetic field dependence of the phase transition temperature shift for ferronematics is presented in Fig. 11(b). For the FN having a calamitic LC matrix (RS) in the B ‖ n0 geometry (open circles) no magnetic field-induced shift of TIN has been detected, similarly to the case of another calamitic LC (6CHBT) doped with spherical MNPs in this geometry.10 In the B ⊥ n0 geometry (which was not studied in ref. 10), however, a large decrease of TIN induced by the magnetic field has been detected [solid circles in Fig. 11(b)]. Obviously, the magnetic field dependence of ΔTIN(B) is much weaker than a quadratic dependence, and it shows the saturating character at high magnetic fields as predicted for the coupling constant ω < 0 in ref. 13. In our previous work14 a negative shift of TIN(B) having similar characteristics has been detected for the BRS ferronematic with a much lower volume fraction of spherical MNPs (ϕ = 2 × 10⁻⁴). Those experimental data have been fitted fairly well using a power law, having the form
 | (2) |
For the BS ferronematics, no magnetic field induced phase transition temperature shift has been detected either in the B ⊥ n0, or the B ‖ n0 geometry [solid and empty triangles in Fig. 11(b), respectively]. Obviously, for some reason, the addition of MNPs has suppressed the positive shift of the phase transition temperature detected for BLC in the B ⊥ n0 geometry.
The most intriguing results have been obtained for the BRS ferronematics, in which a large shift of the phase transition temperature has been detected for both the B ⊥ n0 and the B ‖ n0 geometries – see full and open square symbols in Fig. 11(b), respectively. Interestingly, the shift is negative for B ⊥ n0, and is positive for B ‖ n0. In terms of the theoretical model,13 such a sign change of the ΔTIN means that the coupling constant ω also changes its sign simply by the change of the experimental geometry. Moreover, the model13 states that under a given B, the absolute change of ΔTIN with negative ω is significantly larger than that in a ferronematic with the same, but a positive coupling constant. Interestingly, even this statement holds for the experimental data in the two geometries: at a given B, the negative shift of ΔTIN is larger in the B ⊥ n0 geometry than the positive one in the B ‖ n0 geometry. Experimental data for both geometries can be nicely fitted by eqn (2) as shown in Fig. 11(b) (full and dashed lines are the one-parameter fits to the square symbols).
The mean-field description,13 as well as eqn (2), predicts a linear dependence of the magnetic field-induced phase transition temperature shift on the volume fraction of the MNPs, ϕ. To test this prediction, it is desirable to compare ΔTIN(B) for ferronematics differing in the volume fraction of MNPs only (i.e., having the same type of LC matrix, the same type and size of MNPs, and – considering the results presented here – in the same experimental geometry). Fig. 12 shows the magnetic field-induced phase transition temperature shift as a function of the magnetic induction for the BRS ferronematic in the B ⊥ n0 geometry, for two different volume fractions ϕ = 10−2 and ϕ = 2 × 10⁻⁴ (data for the latter have been deduced from Fig. 5 of ref. 14). Obviously, for the larger ϕ, the negative shift ΔTIN(B) is larger. However, while the two concentrations differ by a factor of 50, the temperature shifts differ by a factor of about 4 only, and therefore, the predicted linear dependence of ΔTIN(B) on ϕ does not hold. The reason for that is the rapidly increasing tendency of the particles for aggregation at higher concentrations. Both the mean-field description13 and eqn (2) consider a homogeneous solution of single particles in a nematic matrix, while in the experiments at a higher concentration of MNPs, the aggregation is unavoidable. The contribution of a certain number of individual, single MNPs to the magnetic field-induced phase transition temperature shift is larger than that of the same number of MNPs joint in a relatively small number of aggregates. Therefore, the shift of ΔTIN(B) at high concentrations is much less than expected from the linear dependence on ϕ.
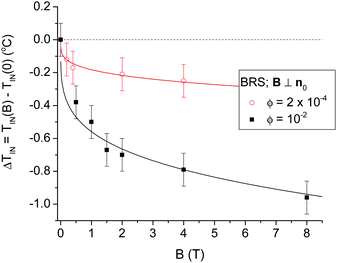 | ||
| Fig. 12 Magnetic field-induced shift of the isotropic-to-nematic phase transition temperature as a function of magnetic induction for BRS samples in the B ⊥ n0 experimental geometry, with two different volume fractions of MNPs, ϕ = 2 × 10⁻⁴ (deduced from Fig. 5 of ref. 14) and ϕ = 10−2 as indicated in the legend. The full lines are one-parameter fits of eqn (2). | ||
4 Summary and conclusion
The magnetic field-induced shift of the isotropic-to-nematic phase transition temperature ΔTNI(B) has been investigated in various LCs (RLC, BLC, BRLC), and in ferronematics (RS, BS, BRS) obtained by doping those LCs with spherical MNPs in a relatively high volume fraction of ϕ = 10−2. Two experimental geometries have been applied: B ⊥ n0 and B ‖ n0.The absence of the phase transition temperature shift for RLC, as well as its positive shift ΔTIN ∝ B2 for BLC in the B ⊥ n0 geometry is in agreement with the expectations,21 and is in accordance with previous experimental findings.11,12,21 However, the absence of the phase transition temperature shift for BLC in the B ‖ n0 geometry is rather unexpected, and may indicate the importance of the anchoring conditions at the bounding surfaces. Some of the previous experiments have been performed on thick and unoriented LC layers;11,21 in ref. 12 however, a planar LC cell of the same thickness as ours has been used, and a shift of ΔTIN ≈ 4 °C has been measured at B = 1 T in the B ‖ n0 geometry. Therefore, the latter result contradicts with our observations. Further complications are introduced with the binary BRLC mixture, where a very small, however, negative shift of the phase transition temperature has been detected in the B ⊥ n0 geometry, which is unexpected considering the molecular structure of the constituting LCs. Some kind of still unexplored, magnetic field assisted dilution effect could have caused this slight negative shift of ΔTIN(B). These intriguing findings surely deserve further investigations; however, they do not represent the main subject of the present work. Some insights into these problems can provide the study on the phase behavior of binary nematic liquid crystal mixtures (though not discussing bent-core LCs) based on the mean-field approximation,24 which has been later extended to include the effects of external fields.25 These investigations have predicted the decrease of TIN, as well as the increase of the nematic and isotropic phase coexistence temperature range. Moreover, they have shown that if the isotropic interaction is different for the two components, phase separation can be obtained, which may be influenced by an external field.
Let us turn now to the main questions of the present work, namely, how doping LCs with MNPs at high concentrations influences the isotropic-to-nematic phase transition temperature, and how the magnetic field influences this temperature in such composite systems.
Regarding the influence of doping with spherical MNPs on TIN, DSC measurements have shown that it decreases the phase transition temperature, and slightly decreases (for RS and BRS) or leaves the same (for BS) the enthalpy of transition, compared to those of the neat LCs – see Table 1. These observations are in-line with the mean-field theory of nematic LCs doped with nanoparticles,8 which among others, gives an approximate result for the practically important case of LCs doped with spherical NPs on average, but in general possesses a non-ideal shape (i.e., the particles have a statistical distribution of parameters, including the anisometry). In such a system the theory predicts a decrease of TIN by doping, primarily due to the so-called dilution effect, and at a high concentration of the particles even softening of the first-order character of the phase transition. At a closer look to the experimental data some of them seem to be counterintuitive. First, while in the case of calamitic and bent-core LC doping with MNPs triggers a large decrease of the phase transition temperature, the addition of nanoparticles to their binary mixture induces a much smaller decrease of TIN. This can be understood if one considers that mixing the calamitic LC with the bent-core one itself generates a dilution effect, and therefore, doping with MNPs produces a relatively smaller decrease of TIN. Second, doping RLC and BRLC with the particles decreases the enthalpy, i.e., softens the first-order phase transition, while the same does not hold for BLC. However, looking at the magnitudes of ΔH, one can notice that the phase transition enthalpies of RLCs and BRLCs are significantly larger than that of BLC, i.e., the first-order isotropic-to-nematic phase transition in BLC is already much softer than those in the two other LCs. Besides, from the DSC traces in Fig. 4, one can immediately see that the phase transition temperature range in BS becomes much wider than that in BLC.
The magnetic field-induced phase transition temperature shifts have been determined using dielectric measurements by monitoring the structural transitions via changes in the temperature dependence of the capacitance C. The measured C(T) dependence of the ferronematic samples (RS, BS, and BRS) showed an unusual local extremum just below TIN(0), not present in the neat LCs (RLC, BLC, and BRLC). POM investigations have revealed a substantial difference in the phase transition scenarios: in the neat LCs the nematic phase propagates in the form of a front, behind which the nematic phase is uniaxially oriented due to the orienting bounding surfaces; in contrast, in the ferronematics the nematic phase appears in the form of unoriented droplets which grow and coalesce with the production of many topological defects, persisting at temperature far below TIN(0). We associate the presence of the local extremum in the C(T) dependence for ferronematics with the unoriented droplet state and with the persistence of the topological defects over a relatively large temperature range below TIN(0).
As already mentioned, earlier experiments have found a much larger magnetic-field induced phase transition temperature shift in bent-core LCs,11,12 than in calamitic ones.21 It has also been shown that a temperature shift as large as in bent-core LCs can be achieved in ferronematics based on calamitic LCs.10 Therefore, from the substances considered here, the largest magnetic-field induced phase transition temperature shift is expected in the BS ferronematics. Contrary to this, no measurable ΔTIN(B) is detected in BS, which also means that even the considerable temperature shift observed for BLC in the B ⊥ n0 geometry is suppressed by doping with MNPs. On the other hand, large magnetic field-induced phase transition temperature shifts have been determined in the ferronematics RS (in the B ⊥ n0 geometry) and BRS (in both geometries). In general, those phase transition temperature shifts are in qualitative agreement with the mean-field description13 (cf. Fig. 11 and Fig. 4 in ref. 13). Namely, the absolute magnitude of ΔTIN(B) grows fast with B at low magnetic fields (B ≤ 2 T), but it starts to saturate at higher fields and seems not to exceed the value of |ΔTIN| ≈ 1.5 °C as predicted by the model. Moreover, for the same system with positive coupling constant ω at a given magnetic field, the theory predicts a considerably smaller positive shift of ΔTIN than the magnitude of the negative shift is for the negative ω. In the experiments, similar positive and negative shifts have been realized (with a smaller positive shift) in BRS by changing the experimental geometry (i.e., the direction of B).
At this point, we have to discuss the discrepancies between the mean-field theory13 and our experimental conditions. The mean-field model considers the ferronematic as a solution of single-domain particles of anisometric shape in nematic LCs (i.e., no aggregation of the particles), and discusses the behavior of the ferronematics inside the bulk, i.e., the boundaries rest at infinity. In contrast to that, the present experimental work discusses ferronematics with spherical MNPs, where the anisometry of particles is introduced only through statistical variations in shape (imperfections in shape), in which the aggregation is unavoidable especially at high concentrations as in our case. Moreover, the ferronematic samples are rather thin layers (≈20 μm), with rigid anchoring at the bounding surfaces. For these reasons, the theoretical model cannot discuss different experimental geometries (B ⊥ n0 and B ‖ n0 are identical for the model13 in the present case), which are according to the experimental results presented here, indeed extremely important. Relevant theoretical studies in this regard could be theoretical studies on the phase transitions in surface-aligned, thin nematic films, based on the Landau–de Gennes theory.26,27 These investigations have shown that in surface-aligned films a new boundary-layer phase transition may occur at a higher temperature than that in the bulk. The theoretical estimate for the boundary layer is ∼100 nm in the case of the well-known calamitic nematic LC, MBBA, with a phase transition temperature shift of ΔTIN = 0.17 °C, which may be influenced by external fields. It would be interesting to extend these studies to ferronematics, where the boundary layer at the particle–liquid crystal interface should also be taken into account.
The aggregation of the particles is the other important effect (especially at high volume fractions of particles, ϕ), which is not handled by the model. We assert that the aggregation of the MNPs at high concentrations causes the much weaker concentration dependence of ΔTIN(B) from the linear one predicted both by the mean-field description13 and by eqn (2) – see Fig. 12. As one can see from microphotographs, in our ferronematics, MNP aggregates of the size of few micrometers are formed especially in RS [Fig. 6(f)], but also in BS [Fig. 8(f)], and in BRS [Fig. 10(f)]. Without the knowledge of the relevant material parameters for our LCs and FNs, we can make only a rough estimate for the nematic correlation length K/W, where K is the average elastic constant and W is the anchoring energy at the particle–LC interface. Considering the compounds with known elastic constants, and with the closest chemical structures compared to our LCs, namely the 1OO8 calamitic LC,28 and the ClPbis10BB bent-core LC,29 we estimate K ∼ 10−12 N (i.e., few pN). Magnetic nanoparticles discussed here have been used for the preparation of ferronematics in various LC matrices, in which the anchoring energy values have been found in the range of W ∼ 10−3–10−7 N m−1.30 These values put the nematic correlation length somewhere in the range between 10 nm and 10 μm, which is presumably smaller than the size of the aggregates observed by microscopy (∼1 μm). Therefore, the aggregates potentially may serve as nucleation sites for the nematic phase. However, the positive and negative phase transition temperature shifts depending on the direction of the magnetic field, as observed in the BRS sample, cannot be explained only by the aggregates serving as nucleation centers.
As a final concluding remark, we admit that the present paper poses as many new questions, regarding the magnetic field-induced phase transition temperature shift, as it answers to the problem for which the first theoretical work was devoted not long ago.13 Definitely, for a better understanding of the complex behavior of systems investigated in this paper, a more extensive theoretical description is needed, which simultaneously takes into account the anisometric and magnetic properties of the MNPs, the dilution effect caused by the doping (and by eventual mixing the LC compounds), the type and the strength of the anchoring at the particle – LC surface and at the FN – bounding surface, as well as the experimental geometry (i.e., the direction of the magnetic field). The most promising, recent theoretical developments towards this direction are the molecular-statistical model of LC suspensions,31,32 the multiscale model using the homogenization theory,33 and the lattice model applied to the mixture of nematic LCs and anisotropic magnetic particles.34 In particular, in the molecular-statistical mean-field approach31 it has been shown that even small concentrations of nanoparticles significantly change the parameters of the phase transition, and that the transition temperature can be either increased or decreased compared with that of the pure nematic phase, depending on the anchoring energy of the particles to the LC matrix, on the concentration of the dispersed phase, and on the geometric size of the particles. In this approach, the phase transition in LC suspensions of MNPs in the presence of an external magnetic field has also been studied, and the free energy as well as the equations of magnetic and orientational equilibrium have been obtained in spherical approximation.32
Conflicts of interest
There are no conflicts to declare.Acknowledgements
This work was supported by project VEGA 2/0016/17, the Slovak Research and Development Agency [contract No. APVV- 015-0453 and APVV-SK-HU-2013-0009], Ministry of Education Agency for Structural Funds of EU [project 26220120033], National Research, Development and Innovation Office (NKFIH) Grant No. FK 125134, and the Grenoble High Magnetic Field Laboratory (CRETA).References
- J. P. F. Lagerwall and G. Scalia, Curr. Appl. Phys., 2012, 12, 1387–1412 CrossRef.
- A. Mertelj, D. Lisjak, M. Drofenik and M. Čopič, Nature, 2013, 504, 237–241 CrossRef CAS PubMed.
- C. Blanc, D. Coursault and E. Lacaze, Liq. Cryst. Rev., 2013, 1, 83–109 CrossRef CAS.
- N. Tomašovičová, P. Kopčanský and N. Éber, in Anisotropy research: new developments, ed. H. G. Lemu, Nova Science, Hauppauge (NY), 2012, ch. 11, pp. 245–276 Search PubMed.
- N. Podoliak, O. Buchnev, O. Buluy, G. D'Alessandro, M. Kaczmarek, Y. Reznikov and T. J. Sluckin, Soft Matter, 2011, 7, 4742–4749 RSC.
- O. Buluy, S. Nepijko, V. Reshetnyak, E. Ouskova, V. Zadorozhnii, A. Leonhardt, M. Ritschel, G. Schönhense and Y. Reznikov, Soft Matter, 2011, 7, 644–649 RSC.
- N. Tomašovičová, M. Timko, Z. Mitróová, M. Koneracká, M. Rajňak, N. Éber, T. Tóth-Katona, X. Chaud, J. Jadzyn and P. Kopčanský, Phys. Rev. E: Stat., Nonlinear, Soft Matter Phys., 2013, 87, 014501 CrossRef PubMed.
- M. V. Gorkunov and M. A. Osipov, Soft Matter, 2011, 7, 4348–4356 RSC.
- V. Gdovinová, N. Tomašovičová, N. Éber, T. Tóth-Katona, V. Závišová, M. Timko and P. Kopčanský, Liq. Cryst., 2014, 41, 1773–1777 CrossRef.
- P. Kopčanský, N. Tomašovičová, M. Koneracká, V. Závišová, M. Timko, M. Hnatič, N. Éber, T. Tóth-Katona, J. Jadzyn, J. Honkonen, E. Beaugnon and X. Chaud, IEEE Trans. Magn., 2011, 47, 4409–4412 CrossRef.
- T. Ostapenko, D. B. Wiant, S. N. Sprunt, A. Jákli and J. T. Gleeson, Phys. Rev. Lett., 2008, 101, 247801 CrossRef CAS PubMed.
- O. Francescangeli, F. Vita, F. Fauth and T. Samulski, Phys. Rev. Lett., 2011, 107, 207801 CrossRef PubMed.
- Y. L. Raikher, V. I. Stepanov and A. N. Zakhlevnykh, Soft Matter, 2013, 9, 177–184 RSC.
- N. Tomašovičová, M. Timko, N. Éber, T. Tóth-Katona, K. Fodor-Csorba, A. Vajda, X. Chaud and P. Kopčanský, Liq. Cryst., 2015, 42, 959–963 CrossRef.
- K. Fodor-Csorba, A. Vajda, A. Jakli, C. Slugovc, G. Trimmel, D. Demus, E. Gacs-Baitz, S. Holly and G. Galli, J. Mater. Chem., 2004, 14, 2499–2506 RSC.
- J. P. van Meter and B. H. Klanderman, Mol. Cryst. Liq. Cryst., 1973, 22, 271–284 CrossRef CAS.
- G. G. Nair, C. A. Bailey, S. Taushanoff, K. Fodor-Csorba, A. Vajda, Z. Varga, A. Bóta and A. Jákli, Adv. Mater., 2008, 20, 3138–3142 CrossRef CAS.
- P. Kopčanský, N. Tomašovičová, M. Koneracká, V. Závišová, M. Timko, A. Džarová, A. Šprincová, N. Éber, K. Fodor-Csorba, T. Tóth-Katona, A. Vajda and J. Jadzyn, Phys. Rev. E: Stat., Nonlinear, Soft Matter Phys., 2008, 78, 011702 CrossRef PubMed.
- M. Rasa, Eur. Phys. J. E: Soft Matter Biol. Phys., 2000, 2, 265–275 CrossRef CAS.
- A. Bradbury, S. Menear and R. W. Chantrell, J. Magn. Magn. Mater., 1986, 54-57, 745–746 CrossRef CAS.
- C. Rosenblatt, Phys. Rev. A: At., Mol., Opt. Phys., 1981, 24, 2236–2238 CrossRef CAS.
- We note here, that due to the smallnes, this shift has remained unnoticed in our previous measurement analysis extending up to 4 T14.
- A. Sakamoto, K. Yoshino, U. Kubo and Y. Inuishi, Jpn. J. Appl. Phys., 1976, 15, 545–546 CrossRef CAS.
- P. Palffy-Muhoray, A. J. Berlinsky, J. R. de Bruyn and D. A. Dunmur, Phys. Lett. A, 1984, 104, 159–162 CrossRef.
- P. Palffy-Muhoray, J. R. de Bruyn and D. A. Dunmur, Mol. Cryst. Liq. Cryst., 1985, 127, 301–319 CrossRef CAS.
- P. Sheng, Phys. Rev. Lett., 1976, 37, 1059–1062 CrossRef CAS.
- P. Sheng, Phys. Rev. A: At., Mol., Opt. Phys., 1982, 26, 1610–1616 CrossRef CAS.
- P. Salamon, N. Éber, A. Krekhov and Á. Buka, Phys. Rev. E: Stat., Nonlinear, Soft Matter Phys., 2013, 87, 032505 CrossRef.
- M. Majumdar, P. Salamon, A. Jákli, J. T. Gleeson and S. Sprunt, Phys. Rev. E: Stat., Nonlinear, Soft Matter Phys., 2011, 83, 031701 CrossRef CAS PubMed.
- P. Kopčanský, N. Tomašovičová, M. Koneracká, M. Timko, V. Závišová, N. Éber, K. Fodor-Csorba, T. Tóth-Katona, A. Vajda, J. Jadzyn, E. Beaugnon and X. Chaud, J. Magn. Magn. Mater., 2010, 322, 3696–3700 CrossRef.
- A. N. Zakhlevnykh, M. S. Lubnin and D. A. Petrov, J. Exp. Theor. Phys., 2016, 123, 908–917 CrossRef CAS.
- A. N. Zakhlevnykh, M. S. Lubnin and D. A. Petrov, J. Magn. Magn. Mater., 2017, 431, 62–65 CrossRef CAS.
- T. P. Bennett, G. D'Allessandro and K. R. Daly, Phys. Rev. E: Stat., Nonlinear, Soft Matter Phys., 2014, 90, 062505 CrossRef CAS PubMed.
- A. Ranjkesh, M. Cvetko, J.-C. Choi and H.-R. Kim, Phase Transitions, 2017, 90, 423–438 CrossRef CAS.
| This journal is © The Royal Society of Chemistry 2018 |

