 Open Access Article
Knots modify the coil–stretch transition in linear DNA polymers†
Beatrice W.
Soh
 a,
Vivek
Narsimhan
 b,
Alexander R.
Klotz
 a and
Patrick S.
Doyle
 *a
*a
aDepartment of Chemical Engineering, Massachusetts Institute of Technology, Cambridge, Massachusetts 02139, USA. E-mail: pdoyle@mit.edu
bDepartment of Chemical Engineering, Purdue University, West Lafayette, Indiana 47907, USA
First published on 9th February 2018
Abstract
We perform single-molecule DNA experiments to investigate the relaxation dynamics of knotted polymers and examine the steady-state behavior of knotted polymers in elongational fields. The occurrence of a knot reduces the relaxation time of a molecule and leads to a shift in the molecule's coil–stretch transition to larger strain rates. We measure chain extension and extension fluctuations as a function of strain rate for unknotted and knotted molecules. The curves for knotted molecules can be collapsed onto the unknotted curves by defining an effective Weissenberg number based on the measured knotted relaxation time in the low extension regime, or a relaxation time based on Rouse/Zimm scaling theories in the high extension regime. Because a knot reduces a molecule's relaxation time, we observe that knot untying near the coil–stretch transition can result in dramatic changes in the molecule's conformation. For example, a knotted molecule at a given strain rate can experience a stretch–coil transition, followed by a coil–stretch transition, after the knot partially or fully unties.
1 Introduction
Developments in microfabrication techniques and fluorescence microscopy over the past few decades have provided a platform for the direct observation and precise manipulation of individual DNA molecules. Single-molecule experiments have been widely used to investigate the static and dynamic properties of DNA as a model polymer.1 Such studies not only serve to address fundamental questions in polymer physics that cannot be easily accessed via bulk methods, but also facilitate the development of emerging DNA mapping and sequencing techniques.2,3 Studies on the dynamics of individual molecules subjected to model flows and fields have been enabled by the fabrication of various microfluidic device geometries, such as parallel plates,4 hyperbolic contractions,5,6 T-junctions,7 and cross-slot channels.8–13 Most notably, the stretching of individual DNA molecules in elongational flows showed that molecules unraveling in flow exhibit heterogeneous stretching dynamics that are largely dependent on the initial molecular conformation8,9 – a behavior termed molecular individualism14 – and also demonstrated the existence of coil–stretch hysteresis in long DNA molecules.10 Most experiments to date have involved linear DNA molecules,15 although there is recent interest in circular DNA molecules,16,17 as well as other complex topologies, including molecules with branches18 and knots.19,20Theoretically, it has been proven that the knotting probability of a chain approaches unity as the chain length tends to infinity, hence knots are inevitably present in long polymer chains.21 The probability of knot formation in DNA has been studied both computationally22–24 and experimentally25,26 on length scales of relevance. Indeed, knots are known to occur in DNA,27,28 proteins29,30 and synthetic polymers.31 The presence of knots is known to have important ramifications for biology and biotechnology applications, from adding complexities to the folding energy landscapes of proteins32 to halting translocation of polymers through nanopores.33,34 From the perspective of polymer physics, knots have also been shown to affect overall polymer properties.19,35–39 For example, simulations have indicated that a knot reduces the mechanical strength of a polymer chain, and that a knotted chain under tension almost always breaks at the entrance to the knot.35
Most studies on knotted polymers to date have been theoretical and computational in nature.35–40 Over the past decade, researchers have demonstrated experimental methods of introducing knots in biopolymers via chemical synthesis,41,42 optical tweezers43,44 and electric fields.45,46 The development of such techniques has ignited interest in the experimental probing of knotted polymer dynamics. Knots tied onto DNA chains held under tension were found to be mobile, and the diffusion of different knot types was observed and quantified.44 Previous work from our group investigated the swelling of knots in DNA molecules during chain relaxation and showed that the knot growth time scale is governed by the global chain relaxation time scale.20 Knotted DNA molecules subjected to elongational fields were shown to exhibit nucleation-type behavior of the coil–stretch transition and to stretch at a much slower rate compared to unknotted molecules.19 Experimentally, the dynamics of knotted polymers is a rich area for exploration. In particular, the effect of knots on the relaxation dynamics of polymers has yet to be investigated experimentally in detail.
Recently, our group performed a computational study of the steady-state and transient dynamics of knotted polymers in elongational flow and examined how knots modify the relaxation time of a chain.40 In the present work, we use single-molecule experiments to study the relaxation dynamics of knotted polymers and the effects of a knot on steady-state behavior of polymer chains in elongational fields. We use strong electric fields to induce knots in DNA molecules via an electrohydrodynamic instability45 and quantify the relaxation times of knotted molecules in relation to knot size. We then subject molecules with knots to planar elongational fields and observe the steady-state dynamics of the chain. Specifically, we focus on the steady-state fractional extension and extension fluctuations of the chain, and compare the dynamics of molecules with and without a knot. We find that the occurrence of a knot markedly changes the steady-state chain dynamics in elongational fields, which can be resolved by taking into account the faster relaxation time and reduction in free chain contour of the knotted molecule.
2 Experimental methods
2.1 Channel and DNA preparation
A charged molecule with electrophoretic mobility μ in an electric field of magnitude E moves with a velocity v = μE. The kinematics of a planar elongational electric field can be described by considering the velocity of charged molecules in the field:vx = μEx = ![[small epsi, Greek, dot above]](https://www.rsc.org/images/entities/i_char_e0a1.gif) x x | (1) |
vy = μEy = −![[small epsi, Greek, dot above]](https://www.rsc.org/images/entities/i_char_e0a1.gif) y y | (2) |
![[small epsi, Greek, dot above]](https://www.rsc.org/images/entities/i_char_e0a1.gif) is the strain rate. Electric fields are useful for generating elongational fields because the field kinematics are purely elongational on length scales larger than the Debye length and shear components near surfaces are negligible.47 Previous studies have used cross-slot channels with hyperbolically curved sidewalls to generate homogeneous elongational electric fields.13,19,48,49 In this study, we utilized 2.5 μm tall cross-slot channels constructed in polydimethylsiloxane (PDMS, Sylgard 184, Dow Corning) using soft lithography on a silicon master template (SU8-2 photoresist). The channels were soaked overnight in 0.5× Tris–boric acid–EDTA (TBE, AccuGENE) to eliminate permeation-driven flow,50 rinsed quickly with water and dried with argon, then sealed to a clean glass cover slide. Prior to exposure to DNA molecules, the channels were flushed with experimental buffer by applying a moderate electric field of ∼20 V cm−1 for at least 30 minutes. Independently applied potentials to side reservoirs of the cross-slot channel enabled control over the location of the stagnation point and trapping of molecules at the stagnation point for long times. The strain rate was calibrated against applied voltage as described in previous studies13,19 and varied by changing the applied voltage at the side reservoirs.
is the strain rate. Electric fields are useful for generating elongational fields because the field kinematics are purely elongational on length scales larger than the Debye length and shear components near surfaces are negligible.47 Previous studies have used cross-slot channels with hyperbolically curved sidewalls to generate homogeneous elongational electric fields.13,19,48,49 In this study, we utilized 2.5 μm tall cross-slot channels constructed in polydimethylsiloxane (PDMS, Sylgard 184, Dow Corning) using soft lithography on a silicon master template (SU8-2 photoresist). The channels were soaked overnight in 0.5× Tris–boric acid–EDTA (TBE, AccuGENE) to eliminate permeation-driven flow,50 rinsed quickly with water and dried with argon, then sealed to a clean glass cover slide. Prior to exposure to DNA molecules, the channels were flushed with experimental buffer by applying a moderate electric field of ∼20 V cm−1 for at least 30 minutes. Independently applied potentials to side reservoirs of the cross-slot channel enabled control over the location of the stagnation point and trapping of molecules at the stagnation point for long times. The strain rate was calibrated against applied voltage as described in previous studies13,19 and varied by changing the applied voltage at the side reservoirs.
The experimental buffer contained 4 vol% β-mercaptoethanol (BME, Calbiochem) and 0.1% 10 kDa polyvinylpyrrolidone (PVP, Polysciences) in 0.5× TBE solution. T4 DNA (165.6 kbp, Nippon Gene) was stained with fluorescent dye YOYO-1 (Invitrogen) at a base pair to dye ratio of 4![[thin space (1/6-em)]](https://www.rsc.org/images/entities/char_2009.gif) :
:![[thin space (1/6-em)]](https://www.rsc.org/images/entities/char_2009.gif) 1, resulting in a 38% increase in DNA contour length51 and a stained contour length of 77 μm. The stained DNA solution was allowed to sit at least 12 hours prior to use and diluted in experimental buffer to an optimal viewing concentration of 0.03 μg mL−1 immediately before experiments. Single DNA molecules were observed using an inverted Zeiss Axiovert microscope with a 63× 1.4 NA oil-immersed objective and images were recorded using a Photometrics Prime 95B sCMOS camera. The extension of the molecule Xex was determined by the projected distance along the primary axis of extension of the field.
1, resulting in a 38% increase in DNA contour length51 and a stained contour length of 77 μm. The stained DNA solution was allowed to sit at least 12 hours prior to use and diluted in experimental buffer to an optimal viewing concentration of 0.03 μg mL−1 immediately before experiments. Single DNA molecules were observed using an inverted Zeiss Axiovert microscope with a 63× 1.4 NA oil-immersed objective and images were recorded using a Photometrics Prime 95B sCMOS camera. The extension of the molecule Xex was determined by the projected distance along the primary axis of extension of the field.
2.2 Experimental procedure
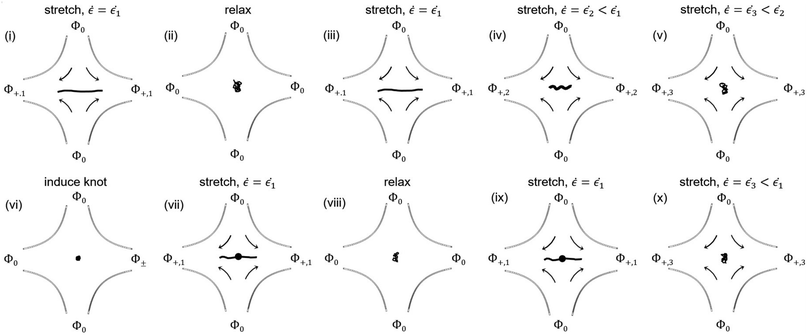
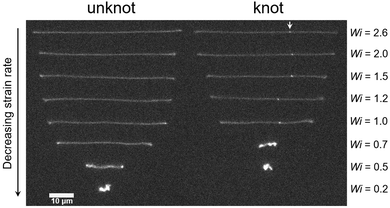
The experimental procedure for measuring relaxation times and stretching unknotted and knotted DNA molecules at different strain rates is summarized in Fig. 1. A given T4 DNA molecule was stretched to high extension at the stagnation point in a strong elongational field. The field was then switched off and the relaxation of the molecule back to equilibrium was observed. After allowing the molecule to relax at equilibrium for ∼10 s, the field was switched on and the molecule was stretched at a high strain rate. The strain rate was lowered progressively until the molecule transitioned from a stretched to coiled state. The molecule was observed at each strain rate for at least 2 minutes. A knot was then induced in the molecule by applying an AC square-wave electric field of strength Erms ∼ 1500 V cm−1 and frequency f = 10 Hz for <1 s.45 The knotted molecule was stretched to high extension in a strong elongational field. The field was then switched off and the relaxation of the molecule back to equilibrium was observed. The field was switched on and the knotted molecule was stretched at a high strain rate. As with the unknotted molecule, the strain rate was stepped downward until the molecule underwent the stretch–coil transition. The knotted molecule was observed at each strain rate for at least 2 minutes. Multiple stretch–relax cycles were performed for each unknotted and knotted molecule. Knotted molecules were limited to remain in the coiled state for no more than ∼5 relaxation times between stretch–relax cycles to minimize partial knot untying over multiple relaxations. Steady-state configurations of molecules were analyzed only after the molecule had experienced a certain strain rate for ∼5 s.2.3 Relaxation time measurements
During each relaxation process, the extension of a given molecule Xex as a function of time was recorded. To extract a longest relaxation time that is consistent with rheological stress relaxation measurements,15 we fit the last 30% of extension that corresponds to the linear force regime of the spring force law to a single-exponential decay according to the equation | (3) |
2.4 Knot size measurements
In a stretched state, a knotted molecule contains a bright spot that represents a region of excess fluorescence, consistent with the higher density of dye molecules within the knot. While the length scale of the knot is too small to be resolved by fluorescence microscopy, we can use intensity as a measure of the contour length stored within the knot.20 We use as a measure of fractional knot size the integrated intensity of the knotted region divided by the integrated intensity of the molecule, where the knotted region is defined as a 9-pixel (1.6 μm) window centered around the brightest pixel of the knot. While this is not a direct measure of the knot contour, we find it the most systematic way of characterizing knot sizes for the purposes of this work, as discussed in the ESI.† We emphasize that this method likely leads to an overestimate of the actual knot size, due to the high density of fluorophores within a diffraction-limited spot that is defined as the knotted region.3 Results and discussion
3.1 Relaxation dynamics of unknotted and knotted molecules
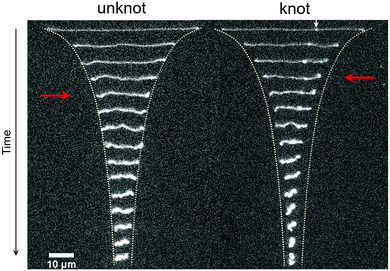
A series of time lapse images showing the relaxation process for the same molecule without a knot and with a knot is displayed in Fig. 2. At a strain rate![[small epsi, Greek, dot above]](https://www.rsc.org/images/entities/i_char_e0a1.gif) = 1.3 s−1, the molecules are in a highly extended state. After the field is switched off, the extension of the molecules decreases sharply as entropic restoring forces return the molecules to the coiled state. Two stark differences are apparent between the relaxation processes for the unknotted and knotted molecules. Firstly, the initial extension of the unknotted molecule is greater than that of the knotted molecule, which arises from contour stored within the knot. Secondly, the molecule containing a knot undergoes a faster relaxation process compared to the molecule without, and reaches the coiled state more quickly. The quicker relaxation of knotted molecules has also been noted qualitatively by Renner et al.19 See the ESI† for movies of an unknotted and knotted molecule relaxing.
= 1.3 s−1, the molecules are in a highly extended state. After the field is switched off, the extension of the molecules decreases sharply as entropic restoring forces return the molecules to the coiled state. Two stark differences are apparent between the relaxation processes for the unknotted and knotted molecules. Firstly, the initial extension of the unknotted molecule is greater than that of the knotted molecule, which arises from contour stored within the knot. Secondly, the molecule containing a knot undergoes a faster relaxation process compared to the molecule without, and reaches the coiled state more quickly. The quicker relaxation of knotted molecules has also been noted qualitatively by Renner et al.19 See the ESI† for movies of an unknotted and knotted molecule relaxing.
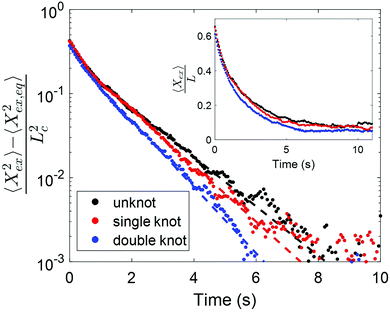
We consider the relaxations of an initially unknotted molecule that was induced to contain two knots, one of which eventually untied to leave the molecule with only one knot. Fig. 3 shows the scaled squared extension of the molecule with different number of knots as a function of time. The fractional knot sizes of the single and double knot at ∼30% chain extension are 0.07 ± 0.02 (95% confidence interval) and 0.16 ± 0.02 respectively. Each curve represents the average of three to four relaxations and the dotted lines are the fits to the last 30% extension. Based on the relaxation trajectories, it is evident that the relaxation process depends on the number of knots in the molecule. Specifically, the more knots the molecule has, the quicker the molecule relaxes back to equilibrium. The relaxation times of a molecule containing no knot, one knot and two knots are 1.46 ± 0.03 s, 1.28 ± 0.02 s and 1.07 ± 0.02 s respectively. We observe from the inset of Fig. 3 that the molecule containing two knots has a markedly smaller chain extension at equilibrium compared to the molecule with one knot, which in turn has a smaller chain extension compared to the molecule with no knot, consistent with there being more stored contour in two knots versus one knot, and one knot compared to no knot.
Qualitatively, we can rationalize the faster relaxation of knotted molecules by considering the free contour length of the molecule. Previous studies involving knots in T4 DNA molecules induced by an electrohydrodynamic collapse have estimated the knot contour in tight knots to be between 1 μm and 5 μm,19,20 which corresponds to between 1% and 6% of the contour length. Stored contour in the knot results in the molecule having less free chain contour for relaxation, and smaller molecules relax at a faster rate.54
To further investigate the relaxation dynamics of knotted molecules, we quantify the relaxation process for an ensemble of molecules containing knots with a range of sizes. Fig. 4 shows the relaxation times of 24 knotted molecules relative to the relaxation time of unknotted molecules as a function of knot size at ∼30% chain extension. Each data point is obtained by averaging over at least four relaxations for the same knotted molecule. Although partial untying of the knot between stretch–relax cycles was possible, we do not observe any discernible trend in knot size over >10 relaxations (see ESI†). The relaxation time of unknotted molecules τunknot is extracted from the relaxation trajectory averaged over 50 relaxations from 24 molecules and determined to be 1.55 ± 0.02 s. The knot size for each knotted molecule is measured when the molecule is at ∼30% extension, corresponding to the onset of the linear force regime over which the relaxation is fit. It is important to highlight that the knot size continually increases during the relaxation process, thus the reported knot size is not an invariant. As seen from Fig. 4, there is a distinct relationship between relaxation time of a knotted molecule and knot size. In general, the larger the knot size at the onset of the linear force regime, the smaller the relaxation time of the molecule, with a Pearson correlation coefficient of −0.77.
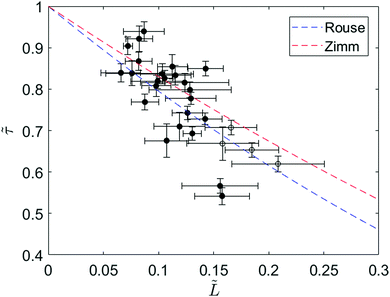 | ||
Fig. 4 Ratio of relaxation times between a knotted and unknotted chain (![[small tau, Greek, tilde]](https://www.rsc.org/images/entities/i_char_e0e5.gif) = τknot/τunknot) as a function of fractional knot size at ∼30% extension ( = τknot/τunknot) as a function of fractional knot size at ∼30% extension (![[L with combining tilde]](https://www.rsc.org/images/entities/i_char_004c_0303.gif) = Lknot/Lchain) for 24 T4 DNA molecules. Each data point corresponds to a different knotted T4 molecule, averaged over at least four relaxations. The filled circles represent molecules with one knot and the open circles represent molecules with two knots. The fractional knot size is measured as the fraction of chain occupied by the knot at the onset of the linear force regime. The curves correspond to Rouse theory = Lknot/Lchain) for 24 T4 DNA molecules. Each data point corresponds to a different knotted T4 molecule, averaged over at least four relaxations. The filled circles represent molecules with one knot and the open circles represent molecules with two knots. The fractional knot size is measured as the fraction of chain occupied by the knot at the onset of the linear force regime. The curves correspond to Rouse theory ![[small tau, Greek, tilde]](https://www.rsc.org/images/entities/i_char_e0e5.gif) = (1 − = (1 − ![[L with combining tilde]](https://www.rsc.org/images/entities/i_char_004c_0303.gif) )1+2v and Zimm theory )1+2v and Zimm theory ![[small tau, Greek, tilde]](https://www.rsc.org/images/entities/i_char_e0e5.gif) = (1 − = (1 − ![[L with combining tilde]](https://www.rsc.org/images/entities/i_char_004c_0303.gif) )3v where ν = 0.588 is the excluded volume Flory exponent.55 Error bars represent 95% confidence interval (see ESI† for calculation). )3v where ν = 0.588 is the excluded volume Flory exponent.55 Error bars represent 95% confidence interval (see ESI† for calculation). | ||
We can understand the faster relaxation times of knotted molecules by considering how the occurrence of knots reduces the free contour length of the chain. According to the Rouse model,56 the relaxation time of a freely-draining chain scales with chain length as τrouse ∝ L1+2v, where L is the contour length and ν = 0.588 is the excluded volume Flory exponent.55 For a knotted molecule, the free chain contour that is allowed to relax is Lfree = Lchain − Lknot. Hence, we have
| τrouse ∝ (Lchain − Lknot)1+2v |
| τzimm ∝ (Lchain − Lknot)3v |
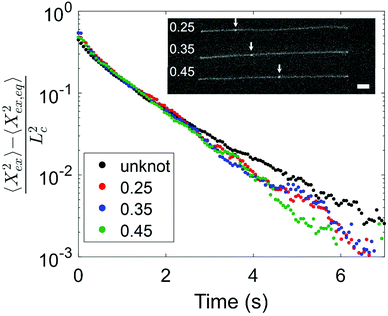
Having observed a decrease in relaxation time with increasing knot size, we proceed to consider the effect of knot position on the relaxation process. We look at two molecules with similar knot sizes at ∼30% chain extension. Each molecule experienced 10 stretch–relax cycles, and the fractional knot sizes at ∼30% extension were between 0.12 and 0.14 across all relaxations. While the knot sizes remained largely constant, the knot positions varied through the stretch–relax cycles, with the knots being located at positions spanning about 20% of the chain for each molecule. Due to the difficulty in measuring an accurate knot position on a weakly extended chain, we quantify the knot position in the highly stretched chain prior to switching off the electric field. The knot position is measured as the fractional distance between the center of the knot and closer end of the chain, such that a knot position of 0.35 indicates a knot located 35% into the chain from one end and 65% into the chain from the other end. Although the initial knot position is not necessarily the position of the knot as the chain relaxes, we notice that the knot position shifts gradually (<0.05) between consecutive relaxations, hence the initial knot position is a reasonable estimate of the knot position during chain relaxation. Fig. 5 shows the averaged trajectories for relaxations of the molecules with different initial knot positions between 0.25 and 0.45. Each curve represents the average of between three and five relaxations. It is evident that the knotted relaxation trajectories are distinct from the unknotted relaxation trajectory. Between the relaxation trajectories of knotted molecules with different knot positions, however, there is no apparent trend. The measured relaxation times are 1.07 ± 0.03 s, 1.11 ± 0.02 s and 1.05 ± 0.03 s for molecules with an initial knot position of 0.25, 0.35 and 0.45 respectively.
We believe that the absent effect of knot position on relaxation time is largely due to the small knot sizes involved. As a knot can effectively be viewed as a bead along the chain with a larger drag coefficient, one would expect that the position of a large enough knot would play a role in determining how the free ends of the chain retract during relaxation. For example, consider the two extreme cases of a knot located in the center of a chain and a knot located near a chain end. The knot near the end of the chain can be seen as an effective tether, which would lead to a different relaxation process compared to the chain with a knot in the center. The sizes of knots generated in this study are likely not large enough for any such effect to be detected.
3.2 Steady-state dynamics in elongational fields
The deformation of polymer molecules in elongational flows or fields is a balance between the hydrodynamic drag force exerted by the flow or field and the entropic force that causes the chain to recoil. The response of molecules in elongational flows and fields is typically characterized by the Weissenberg number Wi, defined as the product of the strain rate and longest relaxation time of the polymer molecule. In this paper, Wi is defined relative to the unknot relaxation time,Wi ≡ ![[small epsi, Greek, dot above]](https://www.rsc.org/images/entities/i_char_e0a1.gif) τunknot. τunknot. | (4) |
Fig. 6 displays images of a molecule without and with a knot stretched in planar elongational fields at a range of strain rates. At Wi > 2.0, there are small differences in the extensions of the unknotted and knotted molecules attributable to contour stored within the knot. At moderate Wi, apparent differences in the extensions of the unknotted and knotted molecules emerge, with the knotted molecules exhibiting noticeably smaller extensions at the same Wi. For Wi < 1.0, we observe stark differences in the configurations exhibited by the molecules. Specifically, the knotted molecule has retracted to a coiled state at Wi = 0.7, while the unknotted molecule remains in a stretched state. Evidently, the occurrence of a knot on a molecule reduces the chain relaxation time and consequently shifts the coil–stretch transition. This was also observed computationally in a recent study by Narsimhan et al.40 for a range of knot topologies.
The steady-state extension of unknotted and five different knotted molecules as a function of Wi is plotted in Fig. 7a. The steady-state extension is averaged over an ensemble of 10 molecules for the unknotted molecule and averaged over 30 s to 1 minute (∼30–60τknot) for each knotted molecule. Note that hysteresis in the extension-Wi curves was not observed (see ESI†). We observe an abrupt increase in steady state extension of unknotted molecules around Wi = 0.5, in good agreement with previous experimental studies.8,9,48 The knotted molecules are numbered in order of decreasing relaxation time (increasing knot size). The relaxation times and knot sizes of the knotted molecules are reported in Table S1 (see ESI†). As seen from Fig. 7a, at a given Wi, the knotted molecules always have smaller extensions compared to the unknotted molecules. Furthermore, the larger the knot on a molecule, the more shifted the extension-Wi curve becomes relative to the unknotted molecule. This signifies the importance of considering knotted molecules individually – a capability of single-molecule experiments – as the heterogeneity of knots can result in varying shifts of the coil–stretch transition.
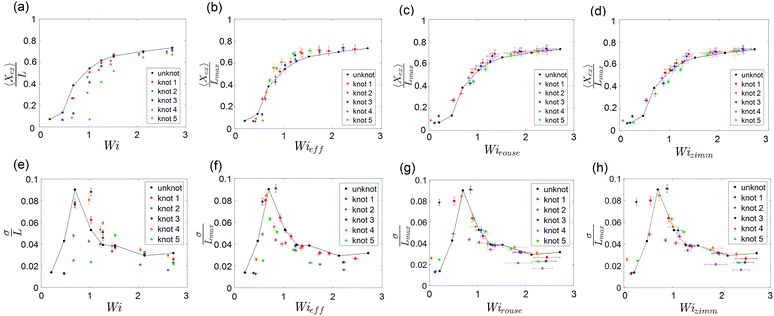 | ||
Fig. 7 (a) Steady-state fractional extension as a function of Wi = ![[small epsi, Greek, dot above]](https://www.rsc.org/images/entities/i_char_e0a1.gif) τ for unknotted and five different knotted molecules with varying knot sizes. (b–d) Scaled steady-state fractional extension as a function of Wieff = τ for unknotted and five different knotted molecules with varying knot sizes. (b–d) Scaled steady-state fractional extension as a function of Wieff = ![[small epsi, Greek, dot above]](https://www.rsc.org/images/entities/i_char_e0a1.gif) τknot, Wirouse = Wi(1 − Lknot/Lchain)1+2ν and Wizimm = Wi(1 − Lknot/Lchain)3ν for unknotted and the five knotted molecules presented in (a). (e) Standard deviation of steady-state fractional extension as a function of Wi for unknotted and the five knotted molecules presented in (a). (f–h) Standard deviation of steady-state fractional extension as a function of Wieff, Wirouse and Wizimm for unknotted and the five knotted molecules presented in (a). The black lines are drawn to guide the eye. Error bars represent 95% confidence interval (see ESI† for calculation). τknot, Wirouse = Wi(1 − Lknot/Lchain)1+2ν and Wizimm = Wi(1 − Lknot/Lchain)3ν for unknotted and the five knotted molecules presented in (a). (e) Standard deviation of steady-state fractional extension as a function of Wi for unknotted and the five knotted molecules presented in (a). (f–h) Standard deviation of steady-state fractional extension as a function of Wieff, Wirouse and Wizimm for unknotted and the five knotted molecules presented in (a). The black lines are drawn to guide the eye. Error bars represent 95% confidence interval (see ESI† for calculation). | ||
To understand the shift in extension-Wi curves for knotted molecules, the change in relaxation time as a result of the occurrence of a knot needs to be considered. We can define an effective Weissenberg number
Wieff ≡ ![[small epsi, Greek, dot above]](https://www.rsc.org/images/entities/i_char_e0a1.gif) τknot. τknot. | (5) |
Close inspection of Fig. 7b reveals poor overlap of the data at high extensions, with the data points for the knotted molecules vertically shifted to noticeably larger extensions compared to the unknotted molecules. This is perhaps to be expected, as the longest relaxation mode is dominant only at small chain extensions. Rescaling Wi by the longest relaxation time of each knotted molecule can approximately collapse the extension-Wi curves, but there is generally better overlap in the low extension compared to the high extension regime. At higher chain extensions, the contribution of higher order relaxation modes cannot be neglected and, as shown previously, the relaxation of a knotted chain is dependent on the knot size. Inspired by Narsimhan et al.,40 we take into account the change in free chain contour at each strain rate when rescaling Wi. As discussed in Section 3.1, the knotted relaxation time based on Rouse scaling can be described as τrouse ∝ (Lchain − Lknot)1+2v. Hence, we have
 | (6) |
 | (7) |
A unique feature of the coil–stretch transition is the critical slowdown in polymer dynamics toward steady state that is accompanied by enhanced molecule extension fluctuations.11,62 The cause of this phenomenon is the large heterogeneity of polymer configurations corresponding to largely different chain extensions that are available close to the coil–stretch transition. As was done in previous studies,11,48 we can examine the steady-state extension fluctuations by measuring the standard deviation of the steady-state fractional extensions. Fig. 7e shows the standard deviation of steady-state fractional extensions as a function of Wi for the same unknotted and knotted molecules as in Fig. 7a–d. A peak in the standard deviation plot for unknotted molecules occurs at Wi ≈ 0.6, in alignment with the location of significant increase in chain extension observed in Fig. 7a and in good agreement with results reported in similar studies for T4 DNA.11,48 The magnitude of the peak is also consistent with that measured by Gerashchenko and Steinberg11 for T4 DNA in bulk elongational flow. Similar to the shift in extension-Wi curves seen in Fig. 7a, the peaks in standard deviation plots for the knotted molecules are shifted to higher Wi, with the larger knots leading to larger shifts relative to the unknot.
We can rescale Wi and standard deviation of steady-state extension in the standard deviation plots, as was performed for the extension-Wi curves in Fig. 7b–d. The standard deviation of scaled steady-state extension as a function of Wieff, Wirouse and Wizimm are plotted in Fig. 7f–h. As seen from Fig. 7f, rescaling Wi by the knotted relaxation time shifts the peaks in standard deviation for all knotted molecules to overlap with the peak corresponding to the unknotted molecules. The rescaling of Wi taking into account a changing free chain contour (Fig. 7g and h) leads to a collapse of the standard deviation curves onto the unknotted curve at high strain rates. However, the data points surrounding the peaks at low strain rates are shifted such that peaks in the rescaled standard deviation plots no longer overlap. The difficulty in measuring a representative knot size at low chain extensions manifests itself in the incorrect scaling of Wi near the coil–stretch transition. In the low extension regime, it is more suitable to rescale Wi by the knotted relaxation time that characterizes the dominant relaxation mode at small chain extensions.
3.3 Changes in topology dynamically change the effective Wi and chain extension
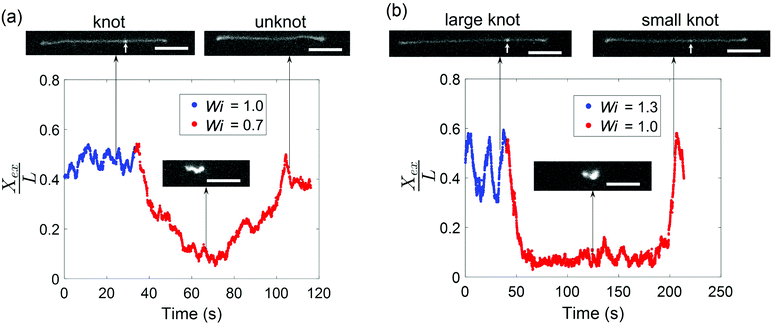
Given that the occurrence of a knot changes the relaxation time of a molecule and shifts the coil–stretch transition, we expect the untying of a knot in elongational field near the coil–stretch transition to change the effective Wi and, consequently, significantly impact the molecular conformation. Fig. 8 plots the fractional extension over time of two knotted molecules subjected to elongational fields as the applied strain rate is stepped down. As shown in Fig. 8a, the initially knotted molecule is stretched to around 50% extension at Wi = 1.0 (![[L with combining tilde]](https://www.rsc.org/images/entities/i_char_004c_0303.gif) = 0.08 at Wi = 1.0) and undergoes the transition from a stretched to coiled state after Wi is decreased to 0.7. The molecule fluctuates around 10% extension for about 20 s, after which the molecule slowly stretches again and reveals the disappearance of the knot that was visibly apparent before. The presumed knot untying that occurred in the coiled configuration reversed the shift in coil–stretch transition caused by the knot's presence, such that the unknotted molecule is no longer below the coil–stretch transition and is hence elongated by the field.
= 0.08 at Wi = 1.0) and undergoes the transition from a stretched to coiled state after Wi is decreased to 0.7. The molecule fluctuates around 10% extension for about 20 s, after which the molecule slowly stretches again and reveals the disappearance of the knot that was visibly apparent before. The presumed knot untying that occurred in the coiled configuration reversed the shift in coil–stretch transition caused by the knot's presence, such that the unknotted molecule is no longer below the coil–stretch transition and is hence elongated by the field.
A similar phenomenon is observed when a larger knot unties into a smaller knot. In Fig. 8b, a molecule containing a knot is initially stretched in an elongational field at Wi = 1.3 (![[L with combining tilde]](https://www.rsc.org/images/entities/i_char_004c_0303.gif) = 0.12 at Wi = 1.3) and the large extension fluctuations suggest proximity to the molecule's coil–stretch transition. The molecule retracts into a coiled conformation after Wi is lowered to 1.0. It remains arrested in a compact state for about 150 s, or ∼100τunknot, before it is stretched by the field and a significantly less bright spot along the chain corresponding to a smaller knot (
= 0.12 at Wi = 1.3) and the large extension fluctuations suggest proximity to the molecule's coil–stretch transition. The molecule retracts into a coiled conformation after Wi is lowered to 1.0. It remains arrested in a compact state for about 150 s, or ∼100τunknot, before it is stretched by the field and a significantly less bright spot along the chain corresponding to a smaller knot (![[L with combining tilde]](https://www.rsc.org/images/entities/i_char_004c_0303.gif) = 0.04 at Wi = 1.0) is observed. We note that the molecule undergoes extension fluctuations during the untying process. The long time required for the larger knot to partially untie in Fig. 8b relative to the time for a smaller knot to completely untie in Fig. 8a aligns with expectations that larger knots tend to be more complex topologically and hence cannot be untied as easily. This is in agreement with previous work demonstrating that molecules subjected to electric fields for longer durations undergo expansion processes characterized by longer time scales.45 The vast changes in chain extension as knots untie in the vicinity of the coil–stretch transition was also observed computationally by Narsimhan et al.40 for various knot topologies. The presence and subsequent untying of a knot can lead to a molecule experiencing both a stretch–coil and coil–stretch transition at a fixed strain rate in elongational fields, highlighting the important effect that knots can have on the dynamics of polymers in steady-state fields.
= 0.04 at Wi = 1.0) is observed. We note that the molecule undergoes extension fluctuations during the untying process. The long time required for the larger knot to partially untie in Fig. 8b relative to the time for a smaller knot to completely untie in Fig. 8a aligns with expectations that larger knots tend to be more complex topologically and hence cannot be untied as easily. This is in agreement with previous work demonstrating that molecules subjected to electric fields for longer durations undergo expansion processes characterized by longer time scales.45 The vast changes in chain extension as knots untie in the vicinity of the coil–stretch transition was also observed computationally by Narsimhan et al.40 for various knot topologies. The presence and subsequent untying of a knot can lead to a molecule experiencing both a stretch–coil and coil–stretch transition at a fixed strain rate in elongational fields, highlighting the important effect that knots can have on the dynamics of polymers in steady-state fields.
4 Conclusion
In this work, we have systematically investigated the relaxation dynamics of knotted polymers and examined the steady-state behavior of knotted polymers in elongational fields. Experimental results show that the occurrence of a knot reduces the relaxation time of the molecule to an extent dependent on the knot size. Stored contour within the knot leads to a smaller amount of contour that is free to relax on the chain, which reduces the molecule's relaxation time. The decrease in relaxation time of knotted molecules can be qualitatively described by Rouse and Zimm scaling laws. The faster chain relaxation time due to a knot has consequences on the steady state dynamics of the knotted molecule in elongational fields. Specifically, a knot shifts the coil–stretch transition of the molecule such that the knotted polymer has a smaller extension than its unknotted counterpart at any given Wi. The extension-Wi curves and extension fluctuation plots for knotted molecules can be collapsed onto unknot curves by rescaling Wi with the measured knotted relaxation time in the low extension regime and a calculated relaxation time based on Rouse/Zimm scaling theories in the high extension regime. The change in chain relaxation time due to the presence of a knot and its effect on molecule dynamics in elongational fields is illustrated by the untying of a knot near the coil–stretch transition, which results in the molecule experiencing at a fixed strain rate a stretch–coil transition with the knot and coil–stretch transition without the knot. From a broader perspective, given the ubiquity of knots in long polymers of both natural and synthetic origin, it is important to understand how the reduction of free chain contour due to the presence of a knot can influence the rheological properties of polymers. Looking forward, we hope that our work will motivate further experimental studies into the dynamics of knotted polymers, such as knotted molecule dynamics in confined environments and behavior in other flows or fields.Conflicts of interest
There are no conflicts to declare.Acknowledgements
This work was supported by the Singapore-MIT Alliance for Research and Technology (SMART) and National Science Foundation (NSF) grant CBET-1602406. BWS is funded by the Agency for Science, Technology and Research (A*STAR), Singapore.References
- R. Pecora, Science, 1991, 251, 893–898 CrossRef CAS PubMed.
- E. Y. Chan, N. M. Goncalves, R. A. Haeusler, A. J. Hatch, J. W. Larson, A. M. Maletta, G. R. Yantz, E. D. Carstea, M. Fuchs, G. G. Wong, S. R. Gullans and R. Gilmanshin, Genome Res., 2004, 14, 1137–1146 CrossRef CAS PubMed.
- K. Jo, D. M. Dhingra, T. Odijk, J. J. de Pablo, M. D. Graham, R. Runnheim, D. Forrest and D. C. Schwartz, Proc. Natl. Acad. Sci. U. S. A., 2007, 104, 2673–2678 CrossRef CAS PubMed.
- D. E. Smith, H. P. Babcock and S. Chu, Science, 1999, 283, 1724–1727 CrossRef CAS PubMed.
- G. C. Randall, K. M. Schultz and P. S. Doyle, Lab Chip, 2006, 6, 516–525 RSC.
- W.-C. Liao, N. Watari, S. Wang, X. Hu, R. G. Larson and L. J. Lee, Electrophoresis, 2010, 31, 2813–2821 CrossRef CAS PubMed.
- J. Tang and P. S. Doyle, Appl. Phys. Lett., 2007, 90, 224103 CrossRef.
- T. T. Perkins, D. E. Smith and S. Chu, Science, 1997, 276, 2016–2021 CrossRef CAS PubMed.
- D. E. Smith and S. Chu, Science, 1998, 281, 1335–1340 CrossRef CAS PubMed.
- C. M. Schroeder, H. P. Babcock, E. S. G. Shaqfeh and S. Chu, Science, 2003, 301, 1515–1519 CrossRef CAS PubMed.
- S. Gerashchenko and V. Steinberg, Phys. Rev. E: Stat., Nonlinear, Soft Matter Phys., 2008, 78, 040801 CrossRef PubMed.
- A. Balducci, C.-C. Hsieh and P. S. Doyle, Phys. Rev. Lett., 2007, 99, 238102 CrossRef CAS PubMed.
- A. G. Balducci, J. Tang and P. S. Doyle, Macromolecules, 2008, 41, 9914–9918 CrossRef CAS.
- P. G. de Gennes, Science, 1997, 276, 1999–2000 CrossRef CAS PubMed.
- E. S. G. Shaqfeh, J. Non-Newtonian Fluid Mech., 2005, 130, 1–28 CrossRef CAS.
- Y. Li, K.-W. Hsiao, C. A. Brockman, D. Y. Yates, R. M. Robertson-Anderson, J. A. Kornfield, M. J. San Francisco, C. M. Schroeder and G. B. McKenna, Macromolecules, 2015, 48, 5997–6001 CrossRef CAS.
- R. M. Robertson, S. Laib and D. E. Smith, Proc. Natl. Acad. Sci. U. S. A., 2006, 103, 7310–7314 CrossRef CAS PubMed.
- D. J. Mai, A. B. Marciel, C. E. Sing and C. M. Schroeder, ACS Macro Lett., 2015, 4, 446–452 CrossRef CAS.
- C. B. Renner and P. S. Doyle, Soft Matter, 2015, 11, 3105–3114 RSC.
- A. R. Klotz, V. Narsimhan, B. W. Soh and P. S. Doyle, Macromolecules, 2017, 50, 4074–4082 CrossRef CAS.
- D. W. Sumners and S. G. Whittington, J. Phys. A: Math. Gen., 1988, 21, 1689–1694 CrossRef.
- M. D. Frank-Kamenetskii, A. V. Lukashin and A. V. Vologodskii, Nature, 1975, 258, 398–402 CrossRef CAS PubMed.
- C. Micheletti, D. Marenduzzo, E. Orlandini and D. W. Sumners, Biophys. J., 2008, 95, 3591–3599 CrossRef CAS PubMed.
- L. Dai, J. R. C. van der Maarel and P. S. Doyle, ACS Macro Lett., 2012, 1, 732–736 CrossRef CAS.
- V. V. Rybenkov, N. R. Cozzarelli and A. V. Vologodskii, Proc. Natl. Acad. Sci. U. S. A., 1993, 90, 5307–5311 CrossRef CAS.
- S. Y. Shaw and J. C. Wang, Science, 1993, 260, 533–536 CAS.
- L. F. Liu, L. Perkocha, R. Calendar and J. C. Wang, Proc. Natl. Acad. Sci. U. S. A., 1981, 78, 5498–5502 CrossRef CAS.
- J. Arsuaga, M. Vázquez, S. Trigueros, D. W. Sumners and J. Roca, Proc. Natl. Acad. Sci. U. S. A., 2002, 99, 5373–5377 CrossRef CAS PubMed.
- O. Nureki, M. Shirouzu, K. Hashimoto, R. Ishitani, T. Terada, M. Tamakoshi, T. Oshima, M. Chijimatsu, K. Takio, D. G. Vassylyev, T. Shibata, Y. Inoue, S. Kuramitsu and S. Yokoyama, Acta Crystallogr., Sect. D: Biol. Crystallogr., 2002, 58, 1129–1137 CrossRef.
- P. Virnau, L. A. Mirny and M. Kardar, PLoS Comput. Biol., 2006, 2, e122 Search PubMed.
- M. Schappacher and A. Deffieux, Angew. Chem., Int. Ed., 2009, 48, 5930–5933 CrossRef CAS PubMed.
- N. P. King, A. W. Jacobitz, M. R. Sawaya, L. Goldschmidt and T. O. Yeates, Proc. Natl. Acad. Sci. U. S. A., 2010, 107, 20732–20737 CrossRef CAS PubMed.
- A. Rosa, M. Di Ventra and C. Micheletti, Phys. Rev. Lett., 2012, 109, 118301 CrossRef CAS PubMed.
- V. Narsimhan, C. B. Renner and P. S. Doyle, Soft Matter, 2016, 12, 5041–5049 RSC.
- A. M. Saitta, P. D. Soper, E. Wasserman and M. L. Klein, Nature, 1999, 399, 46–48 CrossRef CAS PubMed.
- S. R. Quake, Phys. Rev. Lett., 1994, 73, 3317–3320 CrossRef CAS PubMed.
- O. Farago, Y. Kantor and M. Kardar, Europhys. Lett., 2002, 60, 53–59 CrossRef CAS.
- C. Micheletti, D. Marenduzzo and E. Orlandini, Phys. Rep., 2011, 504, 1–73 CrossRef CAS.
- M. Caraglio, C. Micheletti and E. Orlandini, Phys. Rev. Lett., 2015, 115, 188301 CrossRef PubMed.
- V. Narsimhan, A. R. Klotz and P. S. Doyle, ACS Macro Lett., 2017, 1285–1289 CrossRef CAS.
- J.-F. Ayme, J. E. Beves, D. A. Leigh, R. T. McBurney, K. Rissanen and D. Schultz, Nat. Chem., 2011, 4, 15–20 CrossRef PubMed.
- J.-F. Ayme, J. E. Beves, C. J. Campbell and D. A. Leigh, Chem. Soc. Rev., 2013, 42, 1700–1712 RSC.
- Y. Harada, Y. Arai, R. Yasuda, K.-I. Akashi, H. Miyata, K. Kinosita and H. Itoh, Nature, 1999, 399, 446–448 CrossRef PubMed.
- X. R. Bao, H. J. Lee and S. R. Quake, Phys. Rev. Lett., 2003, 91, 265506 CrossRef PubMed.
- J. Tang, N. Du and P. S. Doyle, Proc. Natl. Acad. Sci. U. S. A., 2011, 108, 16153–16158 CrossRef CAS PubMed.
- C. Zhou, W. W. Reisner, R. J. Staunton, A. Ashan, R. H. Austin and R. Riehn, Phys. Rev. Lett., 2011, 106, 248103 CrossRef PubMed.
- G. C. Randall and P. S. Doyle, Macromolecules, 2005, 38, 2410–2418 CrossRef CAS.
- J. Tang, D. W. Trahan and P. S. Doyle, Macromolecules, 2010, 43, 3081–3089 CrossRef CAS PubMed.
- A. C. Klepinger, M. K. Greenier and S. L. Levy, Macromolecules, 2015, 48, 9007–9014 CrossRef CAS.
- G. C. Randall and P. S. Doyle, Proc. Natl. Acad. Sci. U. S. A., 2005, 102, 10813–10818 CrossRef CAS PubMed.
- B. Kundukad, J. Yan and P. S. Doyle, Soft Matter, 2014, 10, 9721–9728 RSC.
- A. Y. Grosberg and Y. Rabin, Phys. Rev. Lett., 2007, 99, 217801 CrossRef PubMed.
- L. Dai, C. B. Renner and P. S. Doyle, Macromolecules, 2014, 47, 6135–6140 CrossRef CAS.
- T. T. Perkins, S. R. Quake, D. E. Smith and S. Chu, Science, 1994, 264, 822–826 CAS.
- N. Clisby, Phys. Rev. Lett., 2010, 104, 055702 CrossRef PubMed.
- P. E. Rouse, Jr., J. Chem. Phys., 1953, 21, 1272–1280 CrossRef.
- B. H. Zimm, J. Chem. Phys., 1956, 24, 269–278 CrossRef CAS.
- A. Balducci, P. Mao, J. Han and P. S. Doyle, Macromolecules, 2006, 39, 6273–6281 CrossRef CAS.
- J. J. Jones, J. R. C. van der Maarel and P. S. Doyle, Phys. Rev. Lett., 2013, 110, 068101 CrossRef PubMed.
- P. G. de Gennes, J. Chem. Phys., 1974, 60, 5030–5042 CrossRef CAS.
- R. G. Larson and J. J. Magda, Macromolecules, 1989, 22, 3004–3010 CrossRef CAS.
- A. Celani, A. Puliafito and D. Vincenzi, Phys. Rev. Lett., 2006, 97, 118301 CrossRef CAS PubMed.
Footnote |
| † Electronic supplementary information (ESI) available: Additional details regarding knot size measurements and analysis, estimate of maximum knotted molecule extension, additional extension-Wi and standard deviation plots, calculation of confidence intervals, and movies. See DOI: 10.1039/c7sm02195j |
| This journal is © The Royal Society of Chemistry 2018 |

