Electrochemical reduction of carbon dioxide with a molecular polypyridyl nickel complex†
Lauren E.
Lieske
a,
Arnold L.
Rheingold
b and
Charles W.
Machan
 *a
*a
aDepartment of Chemistry, University of Virginia, McCormick Road PO Box 400319, Charlottesville, VA 22904-4319, USA. E-mail: machan@virginia.edu
bDepartment of Chemistry & Biochemistry, University of California, La Jolla, San Diego, CA 92093-0358, USA
First published on 11th April 2018
Abstract
The synthesis and reactivity of a molecular nickel(II) complex 1 with the polypyridyl ligand framework N,N,N′,N′-tetrakis(2-pyridylmethyl)ethylenediamine (TPEN) under electrochemically reducing conditions in the presence of CO2 is reported. Cyclic voltammetry (CV), infrared spectroelectrochemistry (IR-SEC) and electrolysis experiments suggest this Ni complex is competent at mediating the two-electron reduction of CO2 to CO and H2O with phenol as an added proton donor, but is subsequently prone to rapid degradation as Ni(CO)4. This deleterious pathway was shown to be mitigated by the inclusion of the CO scavenger [Ni(TMC)]2+, although this requires stoichiometric inclusion for each catalyst turnover and does not significantly improve the observed catalytic current densities.
Introduction
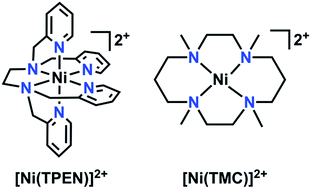
The continuing increase of the world's population poses significant challenges for both sourcing new fuels and controlling global emissions due to the corresponding increase in energy demand. The current primary source of energy, fossil fuel, is nonrenewable and its large-scale use to meet current global energy demands has led to an increase in anthropogenic CO2 emissions (current atmospheric levels >400 ppm) with related negative environmental impacts such as loss of polar ice and increasingly energetic weather patterns.1,2 Based on this steadily increasing demand and a global desire to diminish its negative effects, an interest towards utilizing carbon dioxide (CO2) as a precursor towards liquid fuels (e.g. methanol or formate/formic acid) or fuel precursors continues to generate interest.3–5 However, the thermodynamic stability of CO2 poses a challenge towards its reduction.5 Although many catalysts which efficiently reduce CO2 exist, some are based on non-abundant precious metals.6–14 As a result, there continues to be profound interest in the development of molecular electrocatalysts with earth-abundant transition metals for the electrocatalytic reduction of CO2.3,15–27 The use of earth-abundant transition metal electrocatalysts offers a more cost-effective alternative for energy research.15–27Herein, the electrochemical behavior of a Ni-based complex with a polypyridyl framework, N,N,N′,N′-tetrakis(2-pyridylmethyl)ethylenediamine (TPEN), with respect to added CO2 and phenol (PhOH) is reported. Polypyridyl catalysts have previously been employed as a part of electrocatalytic platforms for hydrogen evolution, CO2 reduction, and thermal activation of oxygen.15,22,23,28–40 Polydentate ligand platforms with flexible linkers can accommodate redox-induced structural changes readily, resulting in complexes which are stable across a wide range of potentials.10,18,41–47 Although a hexadentate ligand, TPEN has been reported to have variable coordination numbers with first-row transition metals, suggesting that substrate interactions can still occur.48 Indeed, cyclic voltammetry and infrared spectroelectrochemistry establish that [Ni(TPEN)](PF6)2 reacts quite readily with CO2 upon a one-electron reduction to a Ni(I) state, generating CO. Prolonged electrolysis results in substantial formation of the degradation product Ni(CO)4; this deleterious pathway can be circumvented through the use of a CO scavenger, [Ni(1,4,8,11-tetramethyl-1,4,8,11-tetraazacyclotetradecane)](PF6)2 (1,4,8,11-tetramethyl-1,4,8,11-tetraazacyclotetradecane = TMC), prolonging the lifetime of [Ni(TPEN)](PF6)2.49
Materials and methods
General
All chemicals and solvents (ACS or HPLC grade) were commercially available and used as received unless otherwise indicated. For all air-sensitive reactions and electrochemical experiments, solvents were obtained as anhydrous and air-free from a PPT Glass Contour Solvent Purification System. Gas cylinders were obtained from Praxair (Ar as 5.0; CO2 as 4.0) and passed through molecular sieves prior to use. Gas mixing for variable concentration experiments was accomplished using a gas proportioning rotameter from Omega Engineering; concentration values were determined according to Henry's law using a saturation concentration of 0.28 M for CO2 in MeCN.50 NMR spectra were obtained on either a Varian 600 MHz or 500 MHz instrument and referenced to the residual solvent signal. IR absorbance spectra were obtained on a Vertex V80 IR instrument from Bruker and UV-vis absorbance spectra on a Cary 60 from Agilent. GC experiments were performed using an Agilent 7890B Gas Chromatograph with an Agilent J&W Select Permanent Gases/CO2 column; eluent retention times and product characterization were determined by standard injections. HRMS data were obtained by the Mass Spectrometry Lab at the University of Illinois at Urbana-Champaign and elemental analyses were performed by Midwest Microlab.Synthetic procedures
Electrochemistry
All electroanalytical experiments were performed using a Metrohm Autolab PGSTAT302N potentiostat or a BioLogic SP-50 potentiostat. Glassy carbon working (3 mm diameter) electrode and non-aqueous silver wire pseudoreference electrode separated by PTFE tip were obtained from CH Instruments. The Ag/AgCl pseudoreference electrode were generated by depositing chloride on the bare silver wire in 10% HCl at oxidizing potentials and were stored in a 0.1 M tetrabutylammonium hexafluorophosphate/acetonitrile solution prior to use. The counter electrode was Pt wire (Alfa Aesar, 99.95%, 0.5 mm diameter) or glassy carbon rod (2 mm diameter), as noted. All cyclic voltammetry (CV) experiments were performed in a modified scintillation vial (20 mL volume) as a single-chamber cell with a cap modified with ports for all electrodes and a sparging needle.Controlled potential electrolysis experiments were performed in an H-Cell from Pine Research Instrumentation (two ∼25 mL chambers separated by glass frit), with the working electrode in one chamber separate from the pseudoreference and counter electrodes in the other chamber. Spectrographic grade carbon rods (Electron Microscopy Sciences, 6.35 mm diameter) were used as the working and counter electrodes with a silver/silver chloride pseudoreference electrode (CH Instruments) behind a PTFE frit. The cell was sealed with septa and electrical tape to allow head-space sampling and gas sparging via needles through the two septa using a y-splitter. Pressure balance was maintained by inserting a single section of AWG #14 standard wall PTFE tubing through each septum. Tetrabutylammonium hexafluorophosphate was purified by recrystallization from ethanol and dried in a vacuum oven overnight at 100 °C before being stored in a desiccator. All data were referenced to an internal ferrocene standard (ferrocene/ferricenium; Fc/Fc+) redox potential under stated conditions unless otherwise specified.
IR spectroelectrochemistry
All IR-SEC experiments were conducted using a custom cell based on a previously published design.55–57 The three-electrode set-up consists of an inner glassy carbon working electrode disc (10 mm diameter), a central circular silver bare metal pseudoreference electrode, and an outer circular glassy carbon counter electrode embedded within a PEEK block. All data were referenced to an internal ferrocene standard (Fc/Fc+ reduction potential under stated conditions); obtained by taking a CV with the cell prior to injecting analyte for IR-SEC experiments unless otherwise specified. All spectra were processed by subtraction of a non-reactive/non-catalytic potential from those at which reactivity occurred. For experiments with CO2, gas was sparged into the solution containing [Ni(TPEN)](PF6)2 for ∼30 s prior to injection into the assembled cell.Computational methods
DFT calculations were performed on the Rivanna High-Performance Computing Cluster at the University of Virginia using ORCA 4.0.58,59 Geometry optimizations were performed unrestricted with the B3LYP/G60–62 functional and def2-TZVP63–66 basis set with the RIJCOSX approximation,67 D3BJ dispersion correction,68,69 and CPCM70 to model the acetonitrile solvent. Numerical frequency calculations at the same level of theory were performed to validate the optimized geometries as minima on the potential energy surface and to generate thermochemical data. Molecular graphics and analyses were performed with the UCSF Chimera package. Chimera is developed by the Resource for Biocomputing, Visualization, and Informatics at the University of California, San Francisco (supported by NIGMS P41-GM103311).71Results
Characterization of [Ni(TPEN)](PF6)21
The 1H NMR obtained for 1 in CD3CN was consistent with a paramagnetic species (Fig. S4†); Evans method measurements gave an effective magnetic moment of 3.1 Bohr magnetons, consistent with a Ni(II) d8 octahedral compound (see ESI†).72,73 Single crystals suitable for diffraction were obtained through vapor diffusion of CH2Cl2 into a solution of 1 in methanol (MeOH). Crystallographic studies revealed the molecular structure shown in Fig. 2, with an overall octahedral geometry defined by axial 2-methyl-pyridyl moieties and the tetrakis-2-methylpyridine-substituted ethylenediamine fragment in the equatorial plane. At the axial positions, Ni–N bond distances of 2.092(3) and 2.085(3) Å are observed. By comparison, the equatorial pyridyl fragments exhibit Ni–N distances of 2.077(3) and 2.085(3) Å. Slightly longer bond distances for the alkyl amine fragments of 2.102(3) and 2.098(3) Å are observed crystallographically. Based on these data, use of TPEN in an abbreviated coordination complex formulation refers to a κ6-coordination mode unless otherwise explicitly stated.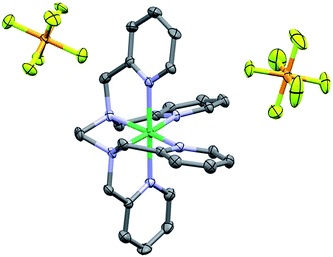 | ||
| Fig. 2 Crystal structure of 1. Hydrogen atoms omitted for clarity; thermal ellipsoids at 50%. C = dark grey, blue = nitrogen, orange = phosphorus, light green = fluorine and dark green = Ni. CCDC 1816890. | ||
Electrochemical characterization
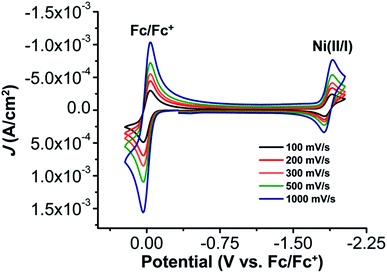
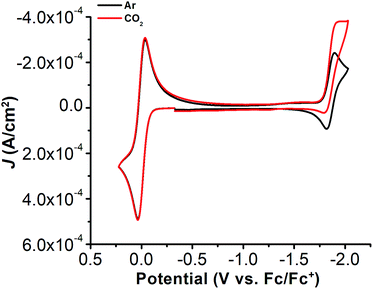
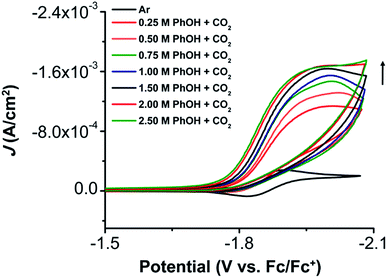
The electrochemical properties of 1 were investigated using cyclic voltammetry (CV) under Ar saturation conditions in an MeCN solution with 0.1 M TBAPF6 as supporting electrolyte. A reversible feature, assigned to the Ni(II)/Ni(I) reduction, is observed with an E1/2 of −1.86 V vs. Fc/Fc+ and a peak current ratio (ic/ia) of 0.93 (Fig. 3 and Table S1†). CVs obtained with variable scan rate are consistent with a diffusion-controlled redox response (Fig. 3 and S10†).Under CO2 saturation, the Ni(II/I) feature becomes irreversible and a slight increase in current density is observed (Fig. 4). This result is suggestive of a CO2 binding and activation event, possibly catalytic in nature, with [Ni(TPEN)]+ at an applied potential. The addition of phenol (PhOH) as a Brønsted acid source caused an enhancement in the observed current at the Ni(II)/Ni(I) reduction, as well as a shift towards positive potentials (Fig. 5). The slope obtained from a plot of E1/2 of the catalytic wave (taken at half-peak current density)74 against the log of added PhOH concentration (Fig. S12†) shows a slope of 40 mV/log[PhOH], which suggests that this wave has a Nernstian dependence under these conditions. Furthermore, when plotting the log of the peak current density against the log of the concentration (M) of PhOH, a half-order rate dependence is observed (Fig. S11†). Similar kinetic studies suggest that with respect to both CO2 and catalyst concentration, the reaction represented by the current increase has a first-order dependence (Fig. S13–S16†). Control CVs in the absence of 1 establish the homogeneous nature of the responses discussed above (Fig. S17†).
Foot-of-the-wave analysis (FOWA)
To determine the rate constant of the reaction, foot-of-the-wave analysis (FOWA) was employed to obtain the maximal turnover frequency (TOFmax) and catalytic rate constant (kcat) for the electrocatalytic reduction of CO2 by complex 1. FOWA uses the Tafel relationship of the initial part of the catalytic wave, which provides a better approximation than the use of peak current plateaus, where the consumption of substrate or long-lived intermediates can result in deviations from an ideal catalytic response.75 Steady-state conditions could not be located by CV through variable scan-rate dependence studies with CO2 saturation and 0.5 M PhOH up to 1 V s−1 (Fig. S18–S21†).23 Despite the appearance of current saturation in Fig. 5, FOWA suggests that the highest kcat occurs at 2.50 M PhOH as 1.15 × 10¹⁰ M−2 s−1 with a TOFmax of 7.72 × 10⁸ s−1 (Table S2†). The TOFmax values obtained by this method (Table S2†) show the effects of the Nernstian equilibrium observed by CV (E1/2(cat) shifts 40 mV/log[PhOH]); a non-linear increase in TOFmax occurs at higher concentrations of [PhOH] as the Tafel relationship between catalytic and non-catalytic current shifts to increasingly positive potentials.Characterization by controlled potential experiments
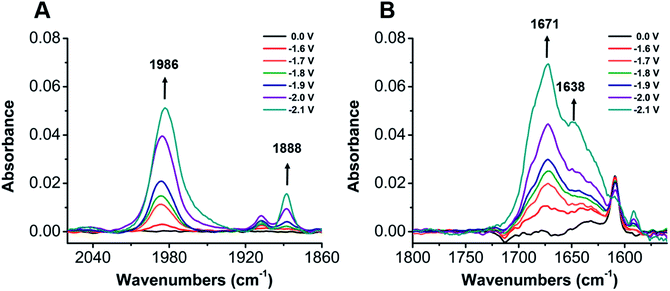
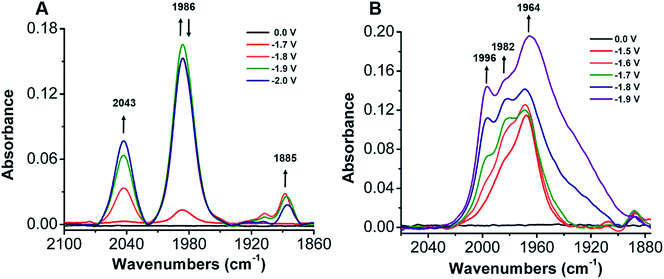
To establish a better mechanistic understanding of the behavior of 1, infrared spectroelectrochemistry (IR-SEC) was conducted. IR-SEC is a method whereby potential is varied as a function of time to extract speciation data from an electrochemical system.56,76,77 Specifically, we were interested in observing changes in the IR absorbance bands of CO2 and any presumptive reduction products with and without a proton source.49In the absence of a proton source, as the potential is increased from −1.6 to −2.1 V vs. Fc/Fc+, IR bands consistent with the formation of carbonate, CO32−, are observed to grow in intensity around 1671 and 1638 cm−1 indicative of a reductive disproportionation reaction of two equivalents CO2 to CO and CO32− (Fig. 6B and S22†). As the potential is brought to −2.1 V vs. Fc/Fc+, a new IR band also grows in intensity at 1986 cm−1, consistent with [Ni(κ5-TPEN)(CO)]+ formation, vide infra (Fig. 6A). Under the addition of a proton source, however, Ni(CO)4 was observed (2043 cm−1) beginning at −1.7 V vs. Fc/Fc+, suggesting that the formation of this degradation product was competitive with any catalytic reaction (Fig. 7A). Minor species are also observed near 1910 and 1888 cm−1, which we attribute either to an intermediate in the pathway between 1 and Ni(CO)4, different charge state of a [Ni(TPEN)(CO)]x+ adduct, or a different conformer of Ni(TPEN)(CO); at prolonged exposure to potentials of −2.1 V vs. Fc/Fc+ and more negative, substantial accumulation of Ni(CO)4 occurs (Fig. 7A).
In order to confirm the identity of the proposed Ni–CO species, 13CO2 was substituted for CO2. The harmonic oscillator solution to Schrodinger's equation was used with the assumption that only the C–O bond is involved in the IR modes to determine the carbonyl shifts for the CO stretches of Ni–CO at 1986 cm−1 and for Ni(CO)4 at 2043 cm−1. The experimentally observed shifts were consistent with those predicted by the harmonic oscillator (Fig. S23†), consistent with CO2 being the source of all CO observed in these experiments. These experiments were also repeated using CO as the sparge gas. At −1.8 V vs. Fc/Fc+, a CO-saturated solution with 1 present showed the growth of a band consistent with the assigned [Ni(κ5-TPEN)(CO)]+ species at 1982 cm−1, as well as the minor carbonyl-containing species at 1888 cm−1 (Fig. S24†).
Indeed, attempts were made to analyze the catalytic efficiency of this system through controlled potential electrolysis (CPE) under CO2 saturation with PhOH (0.5 M) present. Detectable amounts of CO and H2 were not observed with prolonged electrolysis at −2.05 V vs. Fc/Fc+ under nominally anhydrous and added PhOH conditions (Fig. S25†), respectively; CO was only observed in trace amounts with 1 after 8.66 electron equivalents per molecule of catalyst were passed during 10 hours of electrolysis. We believe this is a result of the decomposition of the catalyst to Ni(CO)4, which can be observed in the post bulk electrolysis solution via IR (Fig. S26†). This is consistent with the IR-SEC data showing degradation products accumulating (Fig. 7A). The control electrolysis conducted at the same potential under CO2 saturation and 0.5 M PhOH without catalyst present was observed to generate H2. A Student's t-test assuming equal variances (determined using an F-test) between this control electrolysis and 1 under catalytic conditions resulted in a P value of 1.15 × 10⁻⁶ between the two data sets, indicating that the control generated significantly more H2 than 1 under comparable conditions.78 These results suggest that the degradation of 1 occurs rapidly and prevents any substantial catalytic activity.
Addition of CO scavenger [Ni(TMC)](PF6)2
The absence of catalytic turnover during CPE, in addition to the observation of Ni(CO)4, a well-known degradation product for Ni-based molecular electrocatalysts,49,79 led us to infer that at an applied potential [Ni(TPEN)]2+ had a short experimental lifetime. In an attempt to verify a true catalytic response, we turned to the method developed by Kubiak and co-workers, who demonstrated that the use of [Ni(TMC)](PF6)2 as a CO sponge can enhance activity and prolong catalyst lifetime for the [Ni(cyclam)]2+ electrocatalyst.49Conducting CV experiments with 1 in the presence of varying concentrations of [Ni(TMC)](PF6)2 with PhOH as a proton source (Fig. S27†) and subsequent FOWA shows that kcat is no longer proportional to PhOH concentration (Table S3†). The increase in kcat with increasing concentrations of [Ni(TMC)](PF6)2 suggests that the degradation pathway is the dominant contributor to limiting the overall rate of 1 (Fig. S28 and Table S3†).
When IR-SEC experiments were repeated, the addition of the CO scavenger [Ni(TMC)]2+ to a CO2 saturated solution of 1 suppressed formation of Ni(CO)4 and the IR absorbance band of the CO capture product [Ni(TMC)(CO)]+ was clearly observed at 1967 cm−1 at −1.6 V in Fig. 7B. If the potential is increased from −1.7 to −1.9 V vs. Fc/Fc+, a band associated with the Ni–CO adduct from 1 grew in as a shoulder at 1982 cm−1 along with a new CO adduct at 1996 cm−1 (Fig. S29†).
The CO scavenger [Ni(TMC)]2+ was added into the electrolysis solution to mitigate the effects of the degradation pathway and to determine if 1 was catalytically active using product analysis. However, the electrolysis experiment showed minimal CO (Fig. S30†). H2 was detected and again determined to not be significant based on the P value, 5.86 × 10⁻⁵, obtained from Student's t-test assuming unequal variances with the control electrolysis.78 Analysis of the post-electrolysis reaction solution showed minimal Ni(CO)4 formation (Fig. S26†). Control CV experiments and IR-SEC experiments demonstrated that no additional reactivity is expected from [Ni(TMC)](PF6)2 under these conditions (Fig. S31 and S32†).
Since CO loss from [Ni(TMC)(CO)]+ does not readily occur in solution, we attempted to assess the concentration observed during catalytic conditions. A simple calibration curve was constructed by varying the concentration of added [Ni(TMC)]2+ present under CO saturation, focusing on data points from the regime where a linear intensity response is obtained (Fig. S33 and S34†). Using the linear fit equation, if it is assumed that intensity is still in a region with a linear concentration dependence during catalytic IR-SEC experiments, the amount of CO generated can be approximated. For data obtained at −1.9 V vs. Fc/Fc+ after 60 s with 3 mM 1 (30 s CO2 sparge, 0.1 M PhOH, 20 mM [Ni(TMC)]2+) an estimated concentration of 5.9 mM CO-capture product is present (Fig. S35†). This corresponds to slightly less than two turnovers per equivalent of 1.
DFT calculations and the proposed mechanism
To supplement the experimental studies, the electronic structures of probable intermediates from the proposed reaction mechanism were examined computationally. In the ground state, the calculated structure of the [Ni(TPEN)]2+ parent species is consistent with that determined by X-ray crystallography (Fig. S36†). Kohn–Sham orbital plots of the orbital energy levels with two unpaired electrons, as well as a visualization of unpaired spin density, are consistent with the high-spin Ni2+ metal center observed by the Evans method (Fig. S37†). Geometry optimizations of the one-electron reduction product only produced a species at a minimum on the potential energy surface when one of the axial 2-pyridylmethyl arms had dissociated from the Ni center [Ni(κ5-TPEN)]+2. Although there are two options for the dissociation of a 2-pyridylmethyl arm, the only pathway through which all presumptive intermediate species were verifiable minima through numerical frequency calculations (or lowest in energy according to this level of theory) was one where this dissociation occurred in the equatorial plane of the starting material, shown as Scheme 1.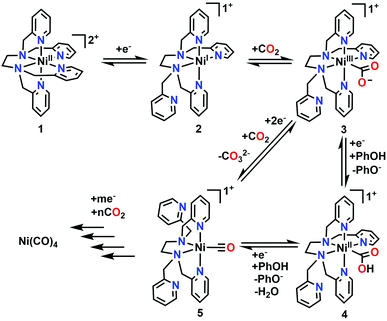 | ||
| Scheme 1 Proposed mechanism for the electrochemical reduction of CO2 to CO as well as the formation of Ni(CO)4. | ||
The presumptive initial CO2 adduct was calculated as a low-spin monocationic octahedral Ni(III) complex [Ni(κ5-TPEN)(η1-CO2)]+3 (Fig. 8). Further reduction and protonation is presumed to result in a species similar to [Ni(κ5-TPEN)(η1-CO2H)]+4. With further protonation and C–O bond cleavage, a monocationic monocarbonyl [Ni(κ4-TPEN)(CO)]+5 species would result (Fig. S38†). The predicted IR frequency of this species, 2005 cm−1, qualitatively compares with that observed experimentally by IR-SEC (1986 cm−1); error correction was achieved using calculated frequencies for Ni(CO)4 at this level of theory compared to the experimentally observed value.
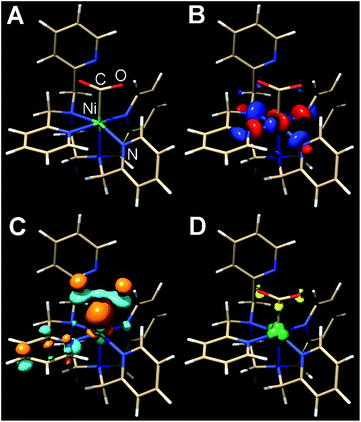 | ||
| Fig. 8 Kohn–Sham orbital representations of [Ni(TPEN)(η1-CO2)]+3 (A); SOMO (B); LUMO (C); spin density (D). ORCA 4.0; B3LYP/G; ZORA; def2-TZVP; CPCM(Acetonitrile), 2S + 1 = 3. | ||
The complete proposed mechanism for the reactivity of 1 with CO2 at reducing potentials is shown in Scheme 1. Consistent with our experimental observations, there are two routes to the cationic Ni monocarbonyl species [Ni(κ4-TPEN)(CO)]+5 that are observed by IR-SEC under protic and aprotic conditions. Under aprotic conditions, further reduction and a second equivalent of CO2 enable a reductive disproportionation reaction to occur; the growth in intensity of IR absorption bands consistent with carbonate are observed between 1600–1700 cm−1, as well as the accumulation of [Ni(κ4-TPEN)(CO)]+5 and Ni(CO)4. With PhOH present as a sacrificial proton donor, bicarbonate formation is greatly suppressed, suggesting that H2O is forming as a co-product of CO under these conditions; the Ni monocarbonyl intermediate and tetracarbonyl degradation product are again observed. With the CO scavenger [Ni(TMC)]2+ present, Ni(CO)4 formation is almost completely suppressed, with the stoichiometric CO capture product [Ni(TMC)(CO)]+ observed by IR-SEC.
Conclusions
The electrochemical reduction of CO2 by a molecular nickel(II) complex has been characterized by IR-SEC, controlled potential electrolysis, and CV experiments. Under aprotic and protic conditions (where PhOH is a proton donor), CO is formed as a two-electron reduction product. Once CO is formed, degradation to Ni(CO)4 occurs rapidly. This deleterious reaction can be suppressed by stoichiometric CO capture by the CO sponge [Ni(TMC)]2+. These results suggest that although CO2 activation is rapid and efficient with this ligand framework, modification to improve stability is a requirement for practical application. Work on new ligand designs to improve the ligand association equilibrium constant Ka by several orders of magnitude at reducing potentials is currently underway.Conflicts of interest
There are no conflicts to declare.Acknowledgements
The University of Virginia for generous funding and ARCS for maintaining the Rivanna HPC Cluster.Notes and references
- N. S. Lewis and D. G. Nocera, Proc. Natl. Acad. Sci., 2006, 103, 15729–15735 CrossRef CAS PubMed.
- J.-R. Petit, J. Jouzel, D. Raynaud, N. I. Barkov, J.-M. Barnola, I. Basile, M. Bender, J. Chappellaz, M. Davis and G. Delaygue, Nature, 1999, 399, 429–436 CrossRef CAS.
- E. E. Benson, C. P. Kubiak, A. J. Sathrum and J. M. Smieja, Chem. Soc. Rev., 2009, 38, 89–99 RSC.
- J. Qiao, Y. Liu, F. Hong and J. Zhang, Chem. Soc. Rev., 2014, 43, 631–675 RSC.
- N. S. Spinner, J. A. Vega and W. E. Mustain, Catal. Sci. Technol., 2012, 2, 19–28 CAS.
- M. Aresta, A. Dibenedetto and A. Angelini, Chem. Rev., 2014, 114, 1709–1742 CrossRef CAS PubMed.
- J. Hawecker, J.-M. Lehn and R. Ziessel, J. Chem. Soc., Chem. Commun., 1984, 328–330, 10.1039/c39840000328.
- Y. Kou, Y. Nabetani, D. Masui, T. Shimada, S. Takagi, H. Tachibana and H. Inoue, J. Am. Chem. Soc., 2014, 136, 6021–6030 CrossRef CAS PubMed.
- R. Kuriki, K. Sekizawa, O. Ishitani and K. Maeda, Angew. Chem., Int. Ed., 2015, 54, 2406–2409 CrossRef CAS PubMed.
- C. W. Machan, S. A. Chabolla, J. Yin, M. K. Gilson, F. A. Tezcan and C. P. Kubiak, J. Am. Chem. Soc., 2014, 136, 14598–14607 CrossRef CAS PubMed.
- S. Sato, T. Morikawa, T. Kajino and O. Ishitani, Angew. Chem., 2013, 125, 1022–1026 CrossRef.
- S. Sato, T. Morikawa, T. Kajino and O. Ishitani, Angew. Chem., Int. Ed., 2013, 52, 988–992 CrossRef CAS PubMed.
- Y. Tamaki, T. Morimoto, K. Koike and O. Ishitani, Proc. Natl. Acad. Sci., 2012, 109, 15673–15678 CrossRef CAS PubMed.
- Y. Kitagawa, H. Takeda, K. Ohashi, T. Asatani, D. Kosumi, H. Hashimoto, O. Ishitani and H. Tamiaki, Chem. Lett., 2014, 43, 1383–1385 CrossRef CAS.
- B. J. Fisher and R. Eisenberg, J. Am. Chem. Soc., 1980, 102, 7361–7363 CrossRef CAS.
- M. Beley, J.-P. Collin, R. Ruppert and J.-P. Sauvage, J. Chem. Soc., Chem. Commun., 1984, 1315–1316, 10.1039/c39840001315.
- G. Neri, I. M. Aldous, J. J. Walsh, L. J. Hardwick and A. J. Cowan, Chem. Sci., 2016, 7, 1521–1526 RSC.
- M. Bourrez, F. Molton, S. Chardon-Noblat and A. Deronzier, Angew. Chem., Int. Ed., 2011, 50, 9903–9906 CrossRef CAS PubMed.
- M. D. Sampson, A. D. Nguyen, K. A. Grice, C. E. Moore, A. L. Rheingold and C. P. Kubiak, J. Am. Chem. Soc., 2014, 136, 5460–5471 CrossRef CAS PubMed.
- I. Azcarate, C. Costentin, M. Robert and J.-M. Savéant, J. Am. Chem. Soc., 2016, 138, 16639–16644 CrossRef CAS PubMed.
- C. Costentin, S. Drouet, M. Robert and J.-M. Savéant, Science, 2012, 338, 90–94 CrossRef CAS PubMed.
- S. Roy, B. Sharma, J. Pécaut, P. Simon, M. Fontecave, P. D. Tran, E. Derat and V. Artero, J. Am. Chem. Soc., 2017, 139, 3685–3696 CrossRef CAS PubMed.
- K. T. Ngo, M. McKinnon, B. Mahanti, R. Narayanan, D. C. Grills, M. Z. Ertem and J. Rochford, J. Am. Chem. Soc., 2017, 139, 2604–2618 CrossRef CAS PubMed.
- N. D. Loewen, E. J. Thompson, M. Kagan, C. L. Banales, T. W. Myers, J. C. Fettinger and L. A. Berben, Chem. Sci., 2016, 7, 2728–2735 RSC.
- N. D. Loewen, T. V. Neelakantan and L. A. Berben, Acc. Chem. Res., 2017, 50, 2362–2370 CrossRef CAS PubMed.
- M. D. Sampson and C. P. Kubiak, J. Am. Chem. Soc., 2016, 138, 1386–1393 CrossRef CAS PubMed.
- N. Elgrishi, M. B. Chambers, X. Wang and M. Fontecave, Chem. Soc. Rev., 2017, 46, 761–796 RSC.
- M. Beley, J. P. Collin, R. Ruppert and J. P. Sauvage, J. Am. Chem. Soc., 1986, 108, 7461–7467 CrossRef CAS PubMed.
- S. L.-F. Chan, T. L. Lam, C. Yang, S.-C. Yan and N. M. Cheng, Chem. Commun., 2015, 51, 7799–7801 RSC.
- A. Chapovetsky, T. H. Do, R. Haiges, M. K. Takase and S. C. Marinescu, J. Am. Chem. Soc., 2016, 138, 5765–5768 CrossRef CAS PubMed.
- L. Chen, Z. Guo, X.-G. Wei, C. Gallenkamp, J. Bonin, E. Anxolabéhère-Mallart, K.-C. Lau, T.-C. Lau and M. Robert, J. Am. Chem. Soc., 2015, 137, 10918–10921 CrossRef CAS PubMed.
- C. Costentin, M. Robert and J.-M. Savéant, Acc. Chem. Res., 2015, 48, 2996–3006 CrossRef CAS PubMed.
- D. L. DeLaet, R. Del Rosario, P. E. Fanwick and C. P. Kubiak, J. Am. Chem. Soc., 1987, 109, 754–758 CrossRef CAS.
- N. Elgrishi, M. B. Chambers and M. Fontecave, Chem. Sci., 2015, 6, 2522–2531 RSC.
- R. J. Haines, R. E. Wittrig and C. P. Kubiak, Inorg. Chem., 1994, 33, 4723–4728 CrossRef CAS.
- D. C. Lacy, C. C. L. McCrory and J. C. Peters, Inorg. Chem., 2014, 53, 4980–4988 CrossRef CAS PubMed.
- S. Lin, C. S. Diercks, Y.-B. Zhang, N. Kornienko, E. M. Nichols, Y. Zhao, A. R. Paris, D. Kim, P. Yang, O. M. Yaghi and C. J. Chang, Science, 2015, 349, 1208–1213 CrossRef CAS PubMed.
- C. W. Machan and C. P. Kubiak, Dalton Trans., 2016, 45, 17179–17186 RSC.
- M. Rakowski Dubois and D. L. Dubois, Acc. Chem. Res., 2009, 42, 1974–1982 CrossRef CAS PubMed.
- J. Schneider, H. Jia, J. T. Muckerman and E. Fujita, Chem. Soc. Rev., 2012, 41, 2036–2051 RSC.
- C. M. Bolinger, B. P. Sullivan, D. Conrad, J. A. Gilbert, N. Story and T. J. Meyer, J. Chem. Soc., Chem. Commun., 1985, 796–797, 10.1039/c39850000796.
- M. R. M. Bruce, E. Megehee, B. P. Sullivan, H. H. Thorp, T. R. O'Toole, A. Downard, J. R. Pugh and T. J. Meyer, Inorg. Chem., 1992, 31, 4864–4873 CrossRef CAS.
- N. Elgrishi, M. B. Chambers, V. Artero and M. Fontecave, Phys. Chem. Chem. Phys., 2014, 16, 13635–13644 RSC.
- H. Ishida, H. Tanaka, K. Tanaka and T. Tanaka, J. Chem. Soc., Chem. Commun., 1987, 131–132, 10.1039/c39870000131.
- J. M. Smieja and C. P. Kubiak, Inorg. Chem., 2010, 49, 9283–9289 CrossRef CAS PubMed.
- K.-Y. Wong, W.-H. Chung and C.-P. Lau, J. Electroanal. Chem., 1998, 453, 161–170 CrossRef CAS.
- T. C. Simpson and R. R. Durand, Electrochim. Acta, 1988, 33, 581–583 CrossRef CAS.
- C. A. Blindauer, M. T. Razi, S. Parsons and P. J. Sadler, Polyhedron, 2006, 25, 513–520 CrossRef CAS.
- J. D. Froehlich and C. P. Kubiak, J. Am. Chem. Soc., 2015, 137, 3565–3573 CrossRef CAS PubMed.
- A. Gennaro, A. A. Isse and E. Vianello, J. Electroanal. Chem. Interfacial Electrochem., 1990, 289, 203–215 CrossRef CAS.
- J. B. Mandel, C. Maricondi and B. E. Douglas, Inorg. Chem., 1988, 27, 2990–2996 CrossRef CAS.
- E. K. Barefield and F. Wagner, Inorg. Chem., 1973, 12, 2435–2439 CrossRef CAS.
- E. Evangelio, N. P. Rath and L. M. Mirica, Dalton Trans., 2012, 41, 8010–8021 RSC.
- B. Bosnich, M. L. Tobe and G. A. Webb, Inorg. Chem., 1965, 4, 1109–1112 CrossRef CAS.
- I. S. Zavarine and C. P. Kubiak, J. Electroanal. Chem., 2001, 495, 106–109 CrossRef CAS.
- C. W. Machan, M. D. Sampson, S. A. Chabolla, T. Dang and C. P. Kubiak, Organometallics, 2014, 33, 4550–4559 CrossRef CAS.
- A. W. Nichols, S. Chatterjee, M. Sabat and C. W. Machan, Inorg. Chem., 2018, 57, 2111–2121 CrossRef CAS PubMed.
- F. Neese, Wiley Interdiscip. Rev.: Comput. Mol. Sci., 2012, 2, 73–78 CrossRef CAS.
- F. Neese, Wiley Interdiscip. Rev.: Comput. Mol. Sci., 2018, 8, e1327 CrossRef.
- S. H. Vosko, L. Wilk and M. Nusair, Can. J. Phys., 1980, 58, 1200–1211 CrossRef CAS.
- C. Lee, W. Yang and R. G. Parr, Phys. Rev. B, 1988, 37, 785–789 CrossRef CAS.
- P. J. Stephens, F. J. Devlin, C. F. Chabalowski and M. J. Frisch, J. Phys. Chem., 1994, 98, 11623–11627 CrossRef CAS.
- A. Schäfer, H. Horn and R. Ahlrichs, J. Chem. Phys., 1992, 97, 2571–2577 CrossRef.
- F. Weigend and R. Ahlrichs, Phys. Chem. Chem. Phys., 2005, 7, 3297–3305 RSC.
- A. D. Becke, J. Chem. Phys., 1993, 98, 1372–1377 CrossRef CAS.
- A. D. Becke, J. Chem. Phys., 1993, 98, 5648–5652 CrossRef CAS.
- R. Izsák and F. Neese, J. Chem. Phys., 2011, 135, 144105 CrossRef PubMed.
- S. Grimme, J. Antony, S. Ehrlich and H. Krieg, J. Chem. Phys., 2010, 132, 154104 CrossRef PubMed.
- S. Grimme, S. Ehrlich and L. Goerigk, J. Comput. Chem., 2011, 32, 1456–1465 CrossRef CAS PubMed.
- M. Cossi, N. Rega, G. Scalmani and V. Barone, J. Comput. Chem., 2003, 24, 669–681 CrossRef CAS PubMed.
- E. F. Pettersen, T. D. Goddard, C. C. Huang, G. S. Couch, D. M. Greenblatt, E. C. Meng and T. E. Ferrin, J. Comput. Chem., 2004, 25, 1605–1612 CrossRef CAS PubMed.
- G. A. Bain and J. F. Berry, J. Chem. Educ., 2008, 85, 532 CrossRef CAS.
- C. Piguet, J. Chem. Educ., 1997, 74, 815 CrossRef CAS.
- A. M. Appel and M. L. Helm, ACS Catal., 2014, 4, 630–633 CrossRef CAS.
- C. Costentin, S. Drouet, M. Robert and J.-M. Savéant, J. Am. Chem. Soc., 2012, 134, 11235–11242 CrossRef CAS PubMed.
- K. Ashley and S. Pons, Chem. Rev., 1988, 88, 673–695 CrossRef CAS.
- W. Kaim and J. Fiedler, Chem. Soc. Rev., 2009, 38, 3373–3382 RSC.
- D. C. Harris, Quantitative Chemical Analysis, W. H. Freeman and Company, New York, 7th edn, 2007 Search PubMed.
- G. B. Balazs and F. C. Anson, J. Electroanal. Chem., 1993, 361, 149–157 CrossRef CAS.
Footnote |
| † Electronic supplementary information (ESI) available: Experimental details of the Evans method, cyclic voltammograms, foot-of-the-wave graphs and table summaries, kinetic data plots, and DFT coordinates. CCDC 1816890. For ESI and crystallographic data in CIF or other electronic format see DOI: 10.1039/c8se00027a |
| This journal is © The Royal Society of Chemistry 2018 |

