Dual functions of zirconium modification on improving the electrochemical performance of Ni-rich LiNi0.8Co0.1Mn0.1O2†
Xing
Li
 *a,
Kangjia
Zhang
a,
MingShan
Wang
*a,
Yang
Liu
a,
MeiZhen
Qu
b,
Wengao
Zhao
c and
Jianming
Zheng
*a,
Kangjia
Zhang
a,
MingShan
Wang
*a,
Yang
Liu
a,
MeiZhen
Qu
b,
Wengao
Zhao
c and
Jianming
Zheng
 *c
*c
aThe Center of New Energy Materials and Technology, Southwest Petroleum University, Xindu Road 8, Chengdu 610500, China. E-mail: lixing@swpu.edu.cn; wangmingshan@swpu.edu.cn; Fax: +86 28 83037409; Tel: +86 28 83037409
bChengdu Institute of Organic Chemistry, Chinese Academy of Science, Chengdu 610041, China
cEnergy and Environment Directorate, Pacific Northwest National Laboratory, 902 Battelle Boulevard, Richland, WA 99354, USA. E-mail: jianming.zheng@pnnl.gov
First published on 17th November 2017
Abstract
Trace amounts of zirconium (Zr) have been adopted to modify the crystal structure and surface of the Ni-rich LiNi0.8Co0.1Mn0.1O2 (NCM811) cathode material. During cycling at 1.0C, the Zr-modified NCM811 shows an improved capacity retention of 92% after 100 cycles, higher than 75% for pristine NMC811. In addition, the Zr-modified NCM811 is capable of delivering a discharge capacity of 107 mA h g−1 at a 10.0C rate, much higher than 28 mA h g−1 delivered by pristine materials. These improved electrochemical performances are ascribed to the dual functions of Zr modification. On one hand, part of the Zr enters the crystal lattice, which is beneficial for reducing the Li/Ni cation mixing and enhancing the crystal stability of the cathode. On the other hand, the rest of the Zr forms a 1–2 nm thick coating layer on the surface of the NCM811 cathode, which effectively prevents direct contact between NCM and the electrolyte, thus suppressing the detrimental interfacial reactions. Therefore, the Zr-modified LiNi0.8Co0.1Mn0.1O2 exhibited significantly enhanced cycling stability and charge/discharge rate capability in comparison with its untreated counterpart.
Introduction
Lithium ion batteries (LIBs) have been regarded as the most competitive candidates as the power source for electric vehicles (EVs) and hybrid electric vehicles (HEVs), because of their lightweight and high energy density as compared to other energy storage devices.1–3 With that being said, the development of long-range EVs poses higher requirements of the energy density and power density of LIBs. The Ni-rich layered structure materials are being perceived as the most promising cathode candidates for constructing high energy density LIBs due to their high capacity, high operating voltage, and low cost.4–7 Especially, the LiNi0.8Co0.1Mn0.1O2 (NCM811) with a layered structure of α-NaFeO2, belonging to the hexagonal crystal system with the R![[3 with combining macron]](https://www.rsc.org/images/entities/char_0033_0304.gif) m space group, has attracted increasing attention in current research. The NCM811 cathode material not only has a reversible discharge specific capacity as high as 200 mA h g−1,8 but is also more environmentally friendly and cost effective due to the significant decrease of Co content in comparison with the commercial LiCoO2.9 However, there are still two main challenges existing with the NCM811 cathode material, including the cation mixing owing to the similar ionic radius of Li+ (0.76 Å) and Ni2+ (0.69 Å) and the detrimental interfacial reaction with the electrolyte due to the presence of oxidative Ni4+ at charged states, which seriously affect its electrochemical performances and impede its large-scale practical application.10,11
m space group, has attracted increasing attention in current research. The NCM811 cathode material not only has a reversible discharge specific capacity as high as 200 mA h g−1,8 but is also more environmentally friendly and cost effective due to the significant decrease of Co content in comparison with the commercial LiCoO2.9 However, there are still two main challenges existing with the NCM811 cathode material, including the cation mixing owing to the similar ionic radius of Li+ (0.76 Å) and Ni2+ (0.69 Å) and the detrimental interfacial reaction with the electrolyte due to the presence of oxidative Ni4+ at charged states, which seriously affect its electrochemical performances and impede its large-scale practical application.10,11
To address the shortcomings of NCM811, lattice doping, surface coating, and electrolyte optimization are usually employed to suppress the cation mixing and the adverse interfacial reaction.12–15 In particular, the heteroatom doping, anion doping such as F and Cl,16 or cation doping such as Al,17–19 Ga,20,21 Ti,22,23 Mg,24–27 Mo28,29 and Zn,30 has been proved to reduce the cation mixing and improve the crystal microstructure stability. However, it is hardly found that one single approach could solve the issues of Ni-rich NCM, i.e., both the cation mixing and the interfacial decay issues.
In our previous work, we found that Zr surface modification could enhance the electrochemical performance of LiNi1/3Co1/3Mn1/3O2 (NCM333) via suppressing the Li+/Ni2+ mixing and stabilizing the electrode/electrolyte interface,31 which inspired us that the Zr modification might also improve the electrochemical performance of a more problematic Ni-rich NMC811. In this work, a trace amount of Zr element was employed to modify the surface of the NCM811 cathode material. It was found that part of the Zr could enter the crystal lattice to reduce the cation mixing and the rest of Zr remained on the NCM811 surface forming a coating layer to enhance the interfacial stability. This demonstrates that the main shortcomings of the Ni-rich NCM811 could be solved concurrently via a facile Zr element surface modification approach. In the present study, the effects of the Zr modification on the structure, morphology, and electrochemical performances of the NCM811 cathode material were systematically investigated. A more detailed understanding about the functioning mechanism of the Zr modification was illustrated based on the results of X-ray diffraction (XRD), X-ray photoelectron spectroscopy (XPS), electrochemical impedance spectroscopy (EIS), etc.
Experimental
Materials synthesis
The Zr surface modified LiNi0.8Co0.1Mn0.1−xZrxO2 (x = 0.01) cathode material was synthesized by a facile wet chemical approach. All the chemicals used in this work are of A.R. purity. Firstly, stoichiometric amounts of Ni(CH3COO)2·4H2O, Co(CH3COO)2·4H2O, Mn(CH3COO)2·4H2O and Zr(NO3)4·5H2O (Ni![[thin space (1/6-em)]](https://www.rsc.org/images/entities/char_2009.gif) :
:![[thin space (1/6-em)]](https://www.rsc.org/images/entities/char_2009.gif) Co
Co![[thin space (1/6-em)]](https://www.rsc.org/images/entities/char_2009.gif) :
:![[thin space (1/6-em)]](https://www.rsc.org/images/entities/char_2009.gif) Mn
Mn![[thin space (1/6-em)]](https://www.rsc.org/images/entities/char_2009.gif) :
:![[thin space (1/6-em)]](https://www.rsc.org/images/entities/char_2009.gif) Zr = 8
Zr = 8![[thin space (1/6-em)]](https://www.rsc.org/images/entities/char_2009.gif) :
:![[thin space (1/6-em)]](https://www.rsc.org/images/entities/char_2009.gif) 1
1![[thin space (1/6-em)]](https://www.rsc.org/images/entities/char_2009.gif) :
:![[thin space (1/6-em)]](https://www.rsc.org/images/entities/char_2009.gif) 0.9
0.9![[thin space (1/6-em)]](https://www.rsc.org/images/entities/char_2009.gif) :
:![[thin space (1/6-em)]](https://www.rsc.org/images/entities/char_2009.gif) 0.1, molar ratio) were dissolved in deionized water to form a stable solution. Then, stoichiometric amounts of Li2CO3 with 5 mol% excess Li+ was added to the above solution to form a suspension mixture, followed by being dried at 120 °C with magnetic stirring. The precursor was pre-sintered at 500 °C for 5 h, and then further calcined at 800 °C for 12 h under a pure oxygen atmosphere with a heating rate of 5 °C min−1 to obtain the final product. For comparison, the pristine LiNi0.8Co0.1Mn0.1O2 cathode material was also prepared in the same manner.
0.1, molar ratio) were dissolved in deionized water to form a stable solution. Then, stoichiometric amounts of Li2CO3 with 5 mol% excess Li+ was added to the above solution to form a suspension mixture, followed by being dried at 120 °C with magnetic stirring. The precursor was pre-sintered at 500 °C for 5 h, and then further calcined at 800 °C for 12 h under a pure oxygen atmosphere with a heating rate of 5 °C min−1 to obtain the final product. For comparison, the pristine LiNi0.8Co0.1Mn0.1O2 cathode material was also prepared in the same manner.
Materials characterization
The crystal structure and phase information of the samples were identified by powder X-ray diffraction (X-Pert PRO MPD PANalytical B.V. Netherlands) using Cu-Kα radiation in the 2θ range from 10° to 80° with a step size of 0.04° and a sampling time of 5 s. The morphology and elemental distribution of the as-prepared samples were observed using a scanning electron microscope (SEM, ZEISS-EVO-MA15 Germany) coupled with an energy dispersive spectrometer (EDS) and a transmission electron microscope (TEM Libra200 Carle Zeiss). Analysis of the surface and bonding mode of the samples was performed using X-ray photoelectron spectroscopy (XPS, Thermo escalab 250Xi America).Electrochemical measurements
The cathode electrodes were prepared by coating the slurry mixture containing 85 wt% active materials, 10 wt% conductive additive (acetylene black, AB) and 5 wt% binder (polyvinylidene fluoride, PVDF) on the aluminum substrate. Then, they were punched into circular pieces with a diameter of 1.4 cm and an active material loading of 3.0 mg followed by drying at 120 °C under vacuum was done prior to assembling the coin cell. The CR2032 coin-type cells consisting of the cathode, the Celgard 2400 separator, the lithium metal anode, and the electrolyte (1 M LiPF6 in EC![[thin space (1/6-em)]](https://www.rsc.org/images/entities/char_2009.gif) :
:![[thin space (1/6-em)]](https://www.rsc.org/images/entities/char_2009.gif) EMC
EMC![[thin space (1/6-em)]](https://www.rsc.org/images/entities/char_2009.gif) :
:![[thin space (1/6-em)]](https://www.rsc.org/images/entities/char_2009.gif) DMC = 1
DMC = 1![[thin space (1/6-em)]](https://www.rsc.org/images/entities/char_2009.gif) :
:![[thin space (1/6-em)]](https://www.rsc.org/images/entities/char_2009.gif) 1
1![[thin space (1/6-em)]](https://www.rsc.org/images/entities/char_2009.gif) :
:![[thin space (1/6-em)]](https://www.rsc.org/images/entities/char_2009.gif) 1 in volume) were assembled in an Ar-filled glovebox with the water and oxygen content less than 0.1 ppm. The electrochemical performance evaluation of the assembled CR2032 coin cells were carried out on a BTS-5V20mA cell testing instrument (NEWARE Electronic Co., Ltd) within the cut-off voltages of 2.8–4.3 V (vs. Li/Li+) based on different charge/discharge rates at room temperature. A constant-current (CC) charge followed by a constant-voltage (CV) charge was used for the charge step, and a galvanostatic process was used for the discharge step. Cyclic voltammetry (CV) and electrochemical impedance spectroscopy (EIS) were performed on a CHI660D electrochemical workstation. CV was recorded between 2.8 and 4.3 V (vs. Li/Li+) at a scan rate of 0.2 mV s−1. EIS was performed from 100 kHz to 0.01 Hz with a potential amplitude of 5 mV. All the EIS measurements were conducted at the charged state of 4.1 V for the pristine and the Zr-modified samples.
1 in volume) were assembled in an Ar-filled glovebox with the water and oxygen content less than 0.1 ppm. The electrochemical performance evaluation of the assembled CR2032 coin cells were carried out on a BTS-5V20mA cell testing instrument (NEWARE Electronic Co., Ltd) within the cut-off voltages of 2.8–4.3 V (vs. Li/Li+) based on different charge/discharge rates at room temperature. A constant-current (CC) charge followed by a constant-voltage (CV) charge was used for the charge step, and a galvanostatic process was used for the discharge step. Cyclic voltammetry (CV) and electrochemical impedance spectroscopy (EIS) were performed on a CHI660D electrochemical workstation. CV was recorded between 2.8 and 4.3 V (vs. Li/Li+) at a scan rate of 0.2 mV s−1. EIS was performed from 100 kHz to 0.01 Hz with a potential amplitude of 5 mV. All the EIS measurements were conducted at the charged state of 4.1 V for the pristine and the Zr-modified samples.
Results and discussion
The XRD patterns of the pristine NCM811 and the Zr-modified NCM811 cathode materials are shown in Fig. 1. The diffraction patterns of the two samples are similar, and all the peaks could be assigned to the hexagonal α-NaFeO2 structure of the R![[3 with combining macron]](https://www.rsc.org/images/entities/char_0033_0304.gif) m space group. The distinct splitting of (006)/(102) and (108)/(110) peaks (Fig. 1b and c) indicates that the two samples both possess an ordered layered structure. However, a slight peak shift (the inset in Fig. 1a) can be observed, which implies that the crystal structure of the NCM811 has been slightly changed via the trace amount of Zr modification. The crystal lattice parameters as calculated from the XRD patterns are listed in Table 1. It can be observed that the lattice parameters of a and c of the Zr-modified NCM811 are both larger than those of the pristine NCM811. This demonstrates that some Zr4+ has entered the NCM crystal lattice, which increases the interlayer distance because of the relatively large ionic radius of Zr4+ (0.72 Å) as compared to other transition metal ions (Ni3+ (0.56 Å), Ni2+ (0.69 Å), Co3+ (0.53 Å), and Mn4+ (0.54 Å)).32 Moreover, as shown in Table 1, it can be observed that the ratio of c/a and the intensity ratio of the (003) to the (104) peak (I(003)/I(104)) of the Zr-modified NCM811 are also larger than those of the pristine NCM811. In particular, the intensity ratio of the (003) to the (104) peak (I(003)/I(104)) in the diffraction pattern can be used as an indication of the layered characteristics of the cathode materials.33 The larger c/a and I(003)/I(104) values disclose that the Zr-modified NCM811 has a better ordered hexagonal layered structure with lower cation mixing than the pristine one.31 All the above results suggest that the Zr-modification can lead to the incorporation of Zr into the crystal lattice of the NCM811, which is favorable for reducing the cation mixing and enhancing the crystal structural stability.
m space group. The distinct splitting of (006)/(102) and (108)/(110) peaks (Fig. 1b and c) indicates that the two samples both possess an ordered layered structure. However, a slight peak shift (the inset in Fig. 1a) can be observed, which implies that the crystal structure of the NCM811 has been slightly changed via the trace amount of Zr modification. The crystal lattice parameters as calculated from the XRD patterns are listed in Table 1. It can be observed that the lattice parameters of a and c of the Zr-modified NCM811 are both larger than those of the pristine NCM811. This demonstrates that some Zr4+ has entered the NCM crystal lattice, which increases the interlayer distance because of the relatively large ionic radius of Zr4+ (0.72 Å) as compared to other transition metal ions (Ni3+ (0.56 Å), Ni2+ (0.69 Å), Co3+ (0.53 Å), and Mn4+ (0.54 Å)).32 Moreover, as shown in Table 1, it can be observed that the ratio of c/a and the intensity ratio of the (003) to the (104) peak (I(003)/I(104)) of the Zr-modified NCM811 are also larger than those of the pristine NCM811. In particular, the intensity ratio of the (003) to the (104) peak (I(003)/I(104)) in the diffraction pattern can be used as an indication of the layered characteristics of the cathode materials.33 The larger c/a and I(003)/I(104) values disclose that the Zr-modified NCM811 has a better ordered hexagonal layered structure with lower cation mixing than the pristine one.31 All the above results suggest that the Zr-modification can lead to the incorporation of Zr into the crystal lattice of the NCM811, which is favorable for reducing the cation mixing and enhancing the crystal structural stability.
| Sample | a (Å) | c (Å) | c/a | I (003)/I(104) |
|---|---|---|---|---|
| Pristine | 2.863 | 14.230 | 4.970 | 1.357 |
| Zr-Modification | 2.866 | 14.268 | 4.978 | 1.511 |
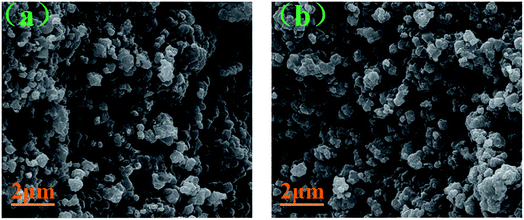
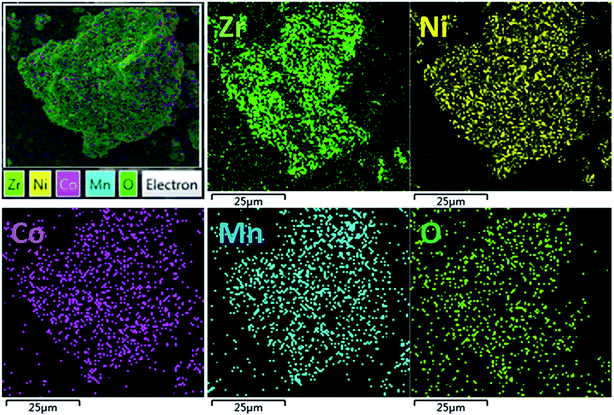
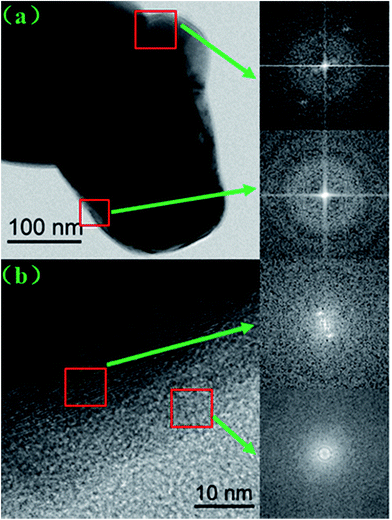
The SEM images of the pristine NCM811 and Zr-modified NCM811 are shown in Fig. 2. No obvious difference in morphology is observed between the pristine NCM811 (Fig. 2a) and Zr-modified NCM811 (Fig. 2b), both of which present irregularly shaped secondary particles with a size of about 400 nm. For the Zr-modified NCM811, it can be observed from the EDS mapping (Fig. 3) that the Zr element homogeneously distributes among the particles. TEM was then used to further explore the microstructure of Zr-modified NCM811. The TEM images in Fig. 4 demonstrate there is an additional coating layer existing on the surface of the Zr-modified NCM811. Fast Fourier Transformation (FFT) shown in Fig. 4b further proves that the coating layer on the NCM811 is amorphous. These results reveal that part of the Zr could not enter the crystal lattice, remaining on the surface of the NCM811 to form a coating layer.
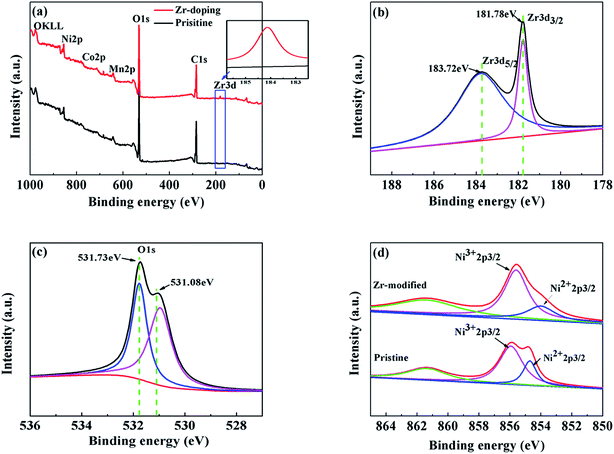
The XPS results of the pristine NCM811 and the trace amount Zr-modified NCM811 are presented in Fig. 5. The XPS data clearly show the presence of Zr4+ (Zr 3d peak) in the Zr-modified NCM811 (Fig. 5a), which is absent in the pristine NCM811. The binding energy of Zr 3d and O 1s shown in Fig. 5b and c demonstrates that the oxidation states of Zr and O are +4 and −2 in the surface of Zr-modified NCM811, respectively. According to the previous report,34 the coating layer on the surface (as shown in the TEM image) of the NCM811 might be ZrO2 or Li2ZrO3. Considering the 5% mole excess of Li source during the synthesis of the NCM, the coating layer on the surface of the NCM811 is supposed to be the amorphous Li2ZrO3.35 Moreover, the peak positions of Co and Mn are relatively stable (Fig. S1†), while the peak shape and position of Ni slightly change in the Zr-modified NCM811 as compared with the pristine NCM811, which demonstrates the surface chemical environment of Ni has been modified via the Zr-modification process. After peak fitting, as presented in Fig. 5d, it is found that the ratio of the Ni3+ 2p3/2 intensity to the Ni2+ 2p3/2 intensity in the Zr-modified NCM811 is obviously larger than that in the pristine NCM811. This means that a higher percentage of the Ni element is maintained at an oxidation state of +3 in the surface of the NCM811 via trace amount of Zr modification, which is favorable for reducing the cation mixing and enhancing the ordering of the layered crystal structure of the NCM811.36 This phenomenon could be ascribed to the strong Zr–O bond, which could alleviate the formation of oxygen non-stoichiometry in the Ni-rich NCM cathode during higher temperature calcination, thus reducing the formation of Ni2+ in the material.37,38
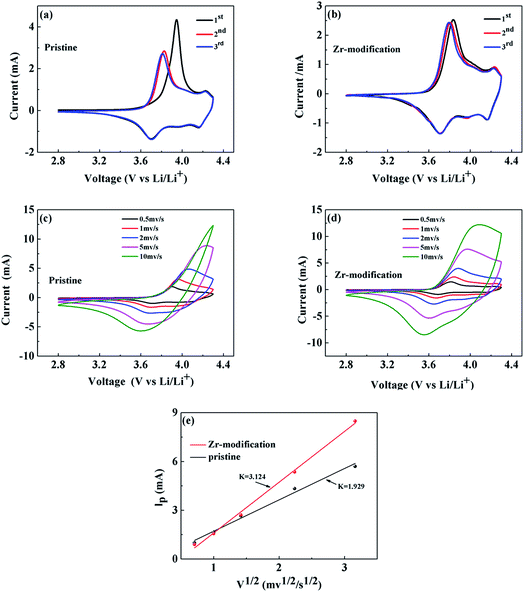
Cyclic voltammetry (CV) was adopted to study the electrochemical reaction kinetics in the pristine and the Zr-modified NCM811 electrodes. Fig. 6a and b present the CV curves for the first three cycles of the pristine and the Zr-modified NCM811 at a scan rate of 0.2 mV s−1. The oxidation and reduction peaks within the voltage range of 2.8 to 4.3 V correspond to the delithiation and lithiation process, respectively, occurring in the cathode electrode.39,40 The potential differences for the first three CV scans are compared in Table 2, showing that the potential difference of the Zr-modified NCM811 is obviously smaller than that of the pristine NCM811. Higher scan rates of 0.5, 1.0, 2.0, 5.0 and 10.0 mV s−1 have also been employed to further characterize the electrode reaction kinetics of the two samples. As compared with Fig. 6c and d, the Zr-modified NCM811 exhibits better capability to maintain the distinct redox reaction peaks than the pristine NCM811 at various scan rates, which demonstrates that the Zr modification is beneficial for reducing the kinetic barrier of electrochemical redox reactions and thus improving the electrochemical reversibility.41 Moreover, the chemical diffusion coefficient of lithium ions in the NCM811 electrodes can be calculated using the Randles–Sevcik equation (eqn (1)), which correlates the relationship between the square root of the scan rate (v1/2) and the peak current (ip).
| ip = 0.4463mAF(F/RT)1/2CLiDLi1/2ϖv1/2 | (1) |
| Anodic peak (V) | Cathodic peak (V) | Potential difference (V) | |
|---|---|---|---|
| Pristine | |||
| 1st cycle | 3.946 | 3.699 | 0.247 |
| 2nd cycle | 3.826 | 3.702 | 0.124 |
| 3rd cycle | 3.809 | 3.702 | 0.107 |
![[thin space (1/6-em)]](https://www.rsc.org/images/entities/char_2009.gif) |
|||
| Zr-Modification | |||
| 1st cycle | 3.823 | 3.713 | 0.122 |
| 2nd cycle | 3.808 | 3.703 | 0.105 |
| 3rd cycle | 3.792 | 3.713 | 0.079 |
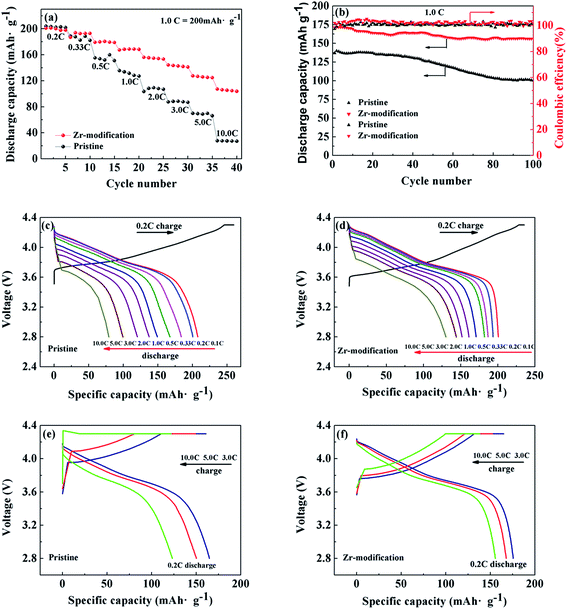
Fig. 7a and b present the rate capability and cycling performance of pristine NCM811 and Zr-modified NCM811. The rate capability of the two samples was firstly investigated by testing with the charge C rate equal to the discharge C rate. As shown in Fig. 7a, the discharge capacities of the pristine NCM811 are 204, 188, 155, 135, 103, 87, 70 and 28 mA h g−1, at 0.1, 0.33, 0.5, 1.0, 2.0, 3.0, 5.0 and 10.0C, respectively. In comparison, the Zr-modified NCM811 shows greatly improved rate capability, delivering higher discharge capacity and less electrode polarization at increasing C rates. The discharge capacities of the Zr-modified NCM811 are 201, 187, 179, 167, 156, 144, 128 and 107 mA h g−1, at the charge/discharge rate of 0.1, 0.33, 0.5, 1.0, 2.0, 3.0, 5.0 and 10.0C, respectively. The charge and discharge curves at different C rates of the pristine and the Zr-modified NCM811 are compared in detail in Fig. S2.† With respect to long-term cycling stability, as shown in Fig. 7b, the first discharge specific capacity of the pristine NCM811 is only 137 mA h g−1 at the charge/discharge rate of 1.0C, and the capacity retention is only 75% after 100 cycles. In contrast, the first discharge capacity for the Zr-modified NCM811 is 171 mA h g−1 at a charge/discharge rate of 1.0C, and a high capacity retention of 92% can be achieved after 100 cycles.
Moreover, different charge and discharge protocols have been employed to better understand the difference of the discharging or charging capability of the pristine and the Zr-modified NCM811. Fig. 7c and d show the rate performance of the pristine NCM811 and the Zr-modified NCM811 tested at the same charge rate of 0.2C but at increasing discharge rates from 0.1C to 10.0C. Despite the similar discharge capacity at a low C rate of 0.2C, the Zr-modified NCM811 delivers higher discharge capacity than the pristine NCM811 at the elevated discharge C rates ranging from 0.33 to 10.0C. Fig. 7e and f compare the rate performance of the pristine NCM811 and the Zr-modified NCM811 evaluated at increasing charging rates but with the same 0.2C discharge rate. It is found that both the charge and discharge capacities of the Zr-modified NCM811 are larger than those of the pristine NCM811. The detailed capacities contributed from constant-current charging and constant-voltage charging are summarized in Table 3. With the increase of the charge current density, the specific capacity obtained by the constant-current charging of the pristine NCM811 is dramatically reduced, indicating the poor charging capability of pristine NCM811 due to the higher kinetic barrier for lithium ion extraction.43 In contrast, even when the charge current density is up to 10.0C, the capacity obtained by the constant-current charging is still as high as 72% for the Zr-modified NCM811, which means that the Zr-modification has largely enhanced the charging capability. It is worth noting that the discharge capacity of the Zr-modified NCM811 is slightly lower than that of the pristine NCM811 at the low rate of 0.2C, which is because the electrochemically inactive Li2ZrO3 coating layer formed on the surface does not contribute to the capacity.34 The above electrochemical data substantiate that the Zr modification could significantly improve the cycling stability and charging/discharging capability of the NCM811 cathode material, owing to the reduced cation mixing, the enhanced lithium ion transportation, and the stabilized electrode interface.
| Constant current charge specific capacity (mA h g−1) | Constant voltage charge specific capacity (mA h g−1) | Constant current charge percentage (%) | |
|---|---|---|---|
| Pristine | |||
| 3C/0.2C | 115.47 | 45.5 | 71.73 |
| 5C/0.2C | 80.46 | 68.92 | 53.86 |
| 10C/0.2C | 19.50 | 102.25 | 16.02 |
![[thin space (1/6-em)]](https://www.rsc.org/images/entities/char_2009.gif) |
|||
| Zr-Modified | |||
| 3C/0.2C | 138.01 | 26.85 | 83.71 |
| 5C/0.2C | 121.11 | 21.33 | 79.45 |
| 10C/0.2C | 99.53 | 38.52 | 72.10 |
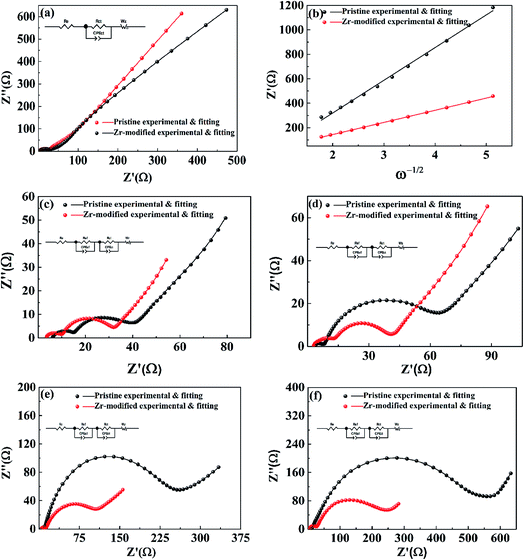
To get further insight into the improved electrochemical performances after Zr-modification, EIS was performed to track the impedance evolution during cycling. Fig. 8 shows the impedance spectra of the pristine and the Zr-modified NCM811. Fig. 8a shows the EIS of the Zr-doped NCM811 and the pristine NCM811 at the charged state of 4.1 V. Both of the EIS of the samples present a semicircle in the high-to-medium frequency region, followed by a slope in the low frequency region. The former is associated with the interfacial resistance,44 while the latter is associated with the diffusion of Li+ ions in the solid-state electrode (Warburg impedance).45 The lithium ion diffusion coefficient of the Zr-modified NCM811 and the pristine NCM811 could be obtained from the Warburg impedance coefficient (σw) using eqn (2) and (3).38
| Zre = (Rsf + Rct + σwω−1/2) | (2) |
| DLi = R2T2/(2A2n4F4Cσw2) | (3) |
Fig. 8c–f show the EIS of the pristine NCM811 and the Zr-modified NCM811 after 1, 10, 50 and 100 cycles at the charge/discharge rate of 1.0C. The impedance spectra show a semicircle in the high frequency region representing the surface film (so-called CEI layer) impedance (Rsf), a semicircle located in the high-to-medium frequency region representing the charge transfer impedance (Rct), and an oblique line located in the low frequency region representing the Warburg impedance (W).46 The interfacial resistance (Rsf + Rct) for both electrodes increases with the increase of the cycle number because of the degradation of the electrode interface.47 Although the two samples exhibit similar interfacial resistance at early stages of cycling, the pristine NCM811 electrode experiences a considerable increase of interfacial resistance during the subsequent cycling, indicating the poor interfacial stability of Ni-rich NCM without treatment. A detailed comparison shows that the Zr-modified NCM811 exhibits much stable interfacial resistance during cycling as compared to the pristine NCM811. The total interfacial resistance of Zr-modified NCM811 is only about 250 ohm after 100 cycles, which is less than half of that observed for the pristine NCM811 electrode (∼550 ohm). The improved interfacial stability of the Zr-modified NCM811 electrode could be ascribed to the Li2ZrO3 coating layer formed on the surface of the NCM811 that could effectively prevent the direct contact of NCM with the electrolyte and hence suppress the detrimental interfacial reactions, accounting for the superior long-term cycling stability.
Conclusion
The effects of Zr surface modification on the structure, morphology, and electrochemical performances of the Ni-rich NCM811 cathode material have been systematically investigated in the present study. The results demonstrated that Zr has dual roles in both enhancing the ordering of the layered structure and stabilizing the material interface. Part of the Zr4+ could enter the crystal lattice of the NCM811, which could reduce the cation mixing, enhance the crystal stability and result in an improved hexagonal layered structure, facilitating the lithium ion transportation in the layered structure. Moreover, the rest of the Zr remained on the surface of the NCM811, forming a kind of Li2ZrO3 coating layer. The Li2ZrO3 coating layer could mitigate the direct contact between the surface of the NCM811 and the electrolyte, which is favorable for suppressing the unwanted interfacial reactions. As a result, the Zr-modified NCM811 exhibited significantly enhanced cycling stability and rate capability as compared to the pristine NCM811. The fundamental findings of this work shed light on the importance of identifying an effective dopant for developing high energy density Ni-rich NCM cathodes for lithium ion batteries.Conflicts of interest
There are no conflicts to declare.Acknowledgements
This work was carried out with financial support from the National Natural Science Foundation of China (grant no. 51474196, 51502250) and the Science and Technology Department of Sichuan Province (grant no. 2016RZ0071, 2017JQ0044).References
- D. Andre, S. J. Kim, P. Lamp, S. F. Lux, F. Maglia, O. Paschos and B. Stiaszny, J. Mater. Chem. A, 2015, 3, 6709–6732 CAS
.
- W. Liu, P. Oh, X. Liu, M. J. Lee, W. Cho, S. Chae, Y. Kim and J. Cho, Angew. Chem., Int. Ed., 2015, 54, 4440 CrossRef CAS PubMed
.
- Z. He, Z. Wang, Z. Huang, H. Chen, X. Li and H. Guo, J. Mater. Chem. A, 2015, 3, 16817–16823 CAS
.
- M. V. Reddy, G. V. S. Rao and B. V. R. Chowdari, J. Phys. Chem. C, 2007, 111, 11712–11720 CAS
.
- Y. K. Sun, S. T. Myung, B. C. Park, J. Prakash, I. Belharouak and K. Amine, Nat. Mater., 2009, 8, 320 CrossRef CAS PubMed
.
- L. J. Li, X. H. Li, Z. X. Wang, H. J. Guo, P. Yue, W. Chen and L. Wu, Powder Technol., 2011, 206, 353–357 CrossRef CAS
.
- J. Zheng, W. H. Kan and A. Manthiram, ACS Appl. Mater. Interfaces, 2015, 7, 6926 CAS
.
- Y. Bi, W. Yang, R. Du, J. Zhou, M. Liu, Y. Liu and D. Wang, J. Power Sources, 2015, 283, 211–218 CrossRef CAS
.
- J. Eom, G. K. Min and J. Cho, J. Electrochem. Soc., 2008, 155, A239–A245 CrossRef CAS
.
- C. Fu, G. Li, L. Dong, L. Qi, J. Fan and L. Li, ACS Appl. Mater. Interfaces, 2014, 6, 15822 CAS
.
- X. Xiong, Z. Wang, P. Yue, H. Guo, F. Wu, J. Wang and X. Li, J. Power Sources, 2013, 222, 318–325 CrossRef CAS
.
- K. M. Kim, N. V. Ly, J. H. Won, Y. G. Lee, W. I. Cho, J. M. Ko and R. B. Kaner, Electrochim. Acta, 2014, 136, 182–188 CrossRef CAS
.
- B. Li, M. Xu, T. Li, W. Li and S. Hu, Electrochem. Commun., 2012, 17, 92–95 CrossRef CAS
.
- Y. An, P. Zuo, X. Cheng, L. Liao and G. Yin, Electrochim. Acta, 2011, 56, 4841–4848 CrossRef CAS
.
- B. Yao, Z. Ding, J. Zhang, X. Feng and L. Yin, J. Solid State Chem., 2014, 216, 9–12 CrossRef CAS
.
- L. Zhu, Y. Liu, W. Wu, X. Wu, W. Tang and Y. Wu, J. Mater. Chem. A, 2015, 3, 15156–15162 CAS
.
- M. Guilmard, C. Pouillerie, L. Croguennec and C. Delmas, Solid State Ionics, 2003, 160, 39–50 CrossRef CAS
.
- K. K. Lee, W. S. Yoon, K. B. Kim, K. Y. Lee and S. T. Hong, J. Power Sources, 2001, 97–98, 308–312 CrossRef CAS
.
- S. B. Majumder, S. Nieto and R. S. Katiyar, J. Power Sources, 2006, 154, 262–267 CrossRef CAS
.
- J. H. Chang, W. S. Eom, M. L. Sang, W. I. Cho and H. Jang, J. Power Sources, 2005, 144, 214–219 CrossRef
.
- C. Wang, X. Ma, J. Cheng, L. Zhou, J. Sun and Y. Zhou, Solid State Ionics, 2006, 177, 1027–1031 CrossRef CAS
.
- B. V. R. Chowdari, G. V. S. Raob and S. Y. Chowa, Solid State Ionics, 2001, 140, 55–62 CrossRef CAS
.
- H. Liu, J. Li, Z. Zhang, Z. Gong and Y. Yang, Electrochim. Acta, 2004, 49, 1151–1159 CrossRef CAS
.
- J. Xiang, C. Chang, F. Zhang and J. Sun, J. Electrochem. Soc., 2008, 155, A520–A525 CrossRef CAS
.
- A. R. Naghash and J. Y. Lee, Electrochim. Acta, 2001, 46, 941–951 CrossRef CAS
.
- S. Madhavi, G. V. S. Rao, B. V. R. Chowdari and S. F. Y. Li, Solid State Ionics, 2002, 152–153, 199–205 CrossRef CAS
.
- B. Zhang, L. Li and J. Zheng, J. Alloys Compd., 2012, 520, 190–194 CrossRef CAS
.
- L. Q. Wang, L. F. Jiao, H. T. Yuan, J. Guo, M. Zhao, H. X. Li and Y. M. Wang, J. Power Sources, 2006, 162, 1367–1372 CrossRef CAS
.
- S. Sivaprakash, S. B. Majumder, S. Nieto and R. S. Katiyar, J. Power Sources, 2007, 170, 433–440 CrossRef CAS
.
- G. T. K. Fey, J. G. Chen, V. Subramanian and T. Osaka, J. Power Sources, 2002, 112, 384–394 CrossRef CAS
.
- X. Li, H. Peng, M. S. Wang, X. Zhao, P. X. Huang, W. Yang, J. Xu, Z. Q. Wang, M. Z. Qu and Z. L. Yu, ChemElectroChem, 2016, 3, 130–137 CrossRef CAS
.
- C. Wang, L. Chen, H. Zhang, Y. Yang and F. Wang, Electrochim. Acta, 2014, 119, 236–242 CrossRef CAS
.
- X. Bie, F. Du, Y. Wang, K. Zhu, H. Ehrenberg, K. Nikolowski, C. Wang, G. Chen and Y. Wei, Electrochim. Acta, 2013, 97, 357–363 CrossRef CAS
.
- K. Park, J. H. Park, S. G. Hong, B. Choi, S. W. Seo, J. H. Park and K. Min, Phys. Chem. Chem. Phys., 2016, 18, 29076 RSC
.
- H. Chen, Q. Hu, Z. Huang, Z. He, Z. Wang, H. Guo and X. Li, Ceram. Int., 2016, 42, 263–269 CrossRef CAS
.
- T. Li, X. Li, Z. Wang and H. Guo, J. Power Sources, 2017, 342, 495–503 CrossRef CAS
.
- B. Lin, Z. Wen, Z. Gu and X. Xu, J. Power Sources, 2007, 174, 544–547 CrossRef CAS
.
- J. Zheng, J. Xiao and J. G. Zhang, Nano Today, 2016, 11, 678–694 CrossRef CAS
.
- J. Yang and Y. Xia, ACS Appl. Mater. Interfaces, 2016, 8(2), 1297–1308 CAS
.
- K. Chang, B. Hallstedt and D. Music, CALPHAD: Comput. Coupling Phase Diagrams Thermochem., 2012, 37, 100–107 CrossRef CAS
.
- K. Meng, Z. Wang, H. Guo, X. Li and D. Wang, Electrochim. Acta, 2016, 211, 822–831 CrossRef CAS
.
- K. Wu, G. Hu, K. Du, Z. Peng and Y. Cao, J. Alloys Compd., 2015, 650, 718–723 CrossRef CAS
.
- X. Cao, Int. J. Electrochem. Sci., 2016, 11, 5267–5278 CrossRef CAS
.
- G. Li, Z. Zhang, R. Wang, Z. Huang, Z. Zuo and H. Zhou, Electrochim. Acta, 2016, 212, 399–407 CrossRef CAS
.
- T. Yang, N. Zhang, L. Ye and K. Sun, Electrochim. Acta, 2011, 56, 4058–4064 CrossRef CAS
.
- J. Zheng, W. Shi, M. Gu, J. Xiao, P. Zuo, C. Wang and J. G. Zhang, J. Electrochem. Soc., 2013, 160, A2212–A2219 CrossRef CAS
.
- X. Lu, X. Li, Z. Wang, H. Guo, G. Yan and X. Yin, Appl. Surf. Sci., 2014, 297, 182–187 CrossRef CAS
.
Footnote |
| † Electronic supplementary information (ESI) available. See DOI: 10.1039/c7se00513j |
| This journal is © The Royal Society of Chemistry 2018 |


