High-performance flexible redox supercapacitors induced by methylene blue with a wide voltage window†
Chunmei
Xu
,
Haiyan
Wang
,
Jiang
Deng
and
Yong
Wang
 *
*
Advanced Materials and Catalysis Group, ZJU-NHU United R&D Center, Center for Chemistry of High-Performance and Novel Materials, Department of Chemistry, Zhejiang University, Hangzhou 310028, P. R. China. E-mail: chemwy@zju.edu.cn; Fax: +86-571-8795-1895; Tel: +86-571-8827-3551
First published on 9th November 2017
Abstract
Flexible redox supercapacitors based on treated carbon cloths were prepared by introducing methylene blue into a gel electrolyte. With the improvement in pseudocapacitance and broadening of the voltage window, the device exhibited a high capacitance of 1738 mF cm−2 and an energy density of 0.78 mW h cm−2. In addition, 84.6% capacitance retention was achieved over 8000 cycles.
To meet the increasing demand for portable electronics such as roll-up displays and wearable devices, high-performance, lightweight, and flexible power sources with long cycle life are attracting considerable attention.1,2 Based on the above requirements, flexible solid-state supercapacitors (SSCs) have become a focus of research.3,4 Typically, supercapacitors are classified into electric double-layer capacitors (EDLCs) and pseudocapacitors based on their charge-storage mechanisms.2,5 EDLCs function based on electrical charge transfer at the surfaces of conducting carbon electrodes including carbon nanotubes (CNTs),1,3,6 graphene,7–9 and carbon cloths.4,10 Compared to EDLCs, pseudocapacitors with fast interfacial faradaic reaction possess higher specific capacitance and energy density.5 Nevertheless, typical pseudocapacitive materials such as transition metal oxides (e.g., MnO2,11–16 Bi2O3,17 NiCo2O4,18 and RuO2 (ref. 19)), polyaniline,20,21 and polypyrrole (PPy)22 are hampered by sluggish reaction kinetics and low conductivity.23
Recently, a new direction focused on redox additives electrolytes has emerged. Redox additives in the gel electrolyte can promote energy storage by faradaic reactions and they can also enhance the ion conductivity of the electrolyte.24 For example, when Ma et al.25 utilized indigo carmine as a redox additive, the capacitance of the SSC increased to 382 F g−1 from 180 F g−1 for the original device with a voltage window of 1 V. However, the SSC showed a poor cyclic stability of 80.3% after 3000 cycles, severely hindering its application. In addition, the limited voltage window of 1 V also led to a low energy density. According to the equation E = 0.5CV2, the energy density (E) can be enhanced by both increasing the specific capacitance (C) and extending the operating cell voltage (V). Hence, it is particularly crucial to obtain SSCs with redox additives that possess high capacitance and can achieve a wide electrochemical stability window.
Methylene blue (MB), a heterocyclic aromatic thiazine dye, can be effectively adsorbed on the surfaces of carbon materials through π–π electron coupling,26,27 and undergoes an outer-sphere redox reaction so that the redox reaction of MB is irrelevant to the changes in surface chemistry of carbon electrodes.28 Herein, we tuned the porous structure through a simple annealing process to maximize the electric double-layer capacitance and the surface area in contact with redox additives. The surface functional groups can also be optimized to achieve a broader voltage window (1.8 V). The subsequent introduction of MB into the PVA (polyvinyl alcohol)–H2SO4 gel led to excellent performance (1738 mF cm−2) and cycle life (84.6% capacitance retention over 8000 cycles). The flexibility was maintained, and a high energy density of 0.78 mW h cm−2 was achieved at a power density of 1.80 mW cm−2. To highlight the potential as a power source for practical applications, the device flexibility and ability to power red light-emitting diodes (LEDs) were also demonstrated.
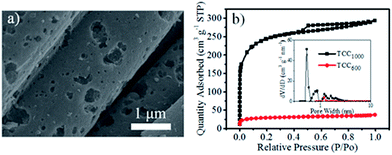
Commercial carbon cloths (CC) with graphitic outer layers and amorphous inner layers feature nonporous structures and hydrophobic surfaces (Fig. S1a†).10 CCs have been annealed at different temperatures according to the method reported for preparing treated CC (TCCx, where x represents the treatment temperature). As observed from the SEM image in Fig. 1a, TCC1000 maintained the fiber-like structure of the original CC and became more porous. N2 adsorption–desorption isotherms and pore size distributions were used to quantitatively analyze the prepared electrode materials. Fig. 1b shows the isotherms of TCC1000 and TCC600; both curves were classified as type IV isotherms, suggesting the existence of different pore sizes ranging from micro- to mesoscale. TCC1000 presented a higher specific surface area (SBET) of 772 m2 g−1 and a larger pore volume of 0.45 cm3 g−1 compared to TCC600 (SBET of 93 m2 g−1 and pore volume of 0.06 cm3 g−1). As shown by the pore size distributions, compared to TCC600, TCC1000 had a higher proportion of micropores, which play an important role in enhancing the capacitance of SSCs.2,10
 | ||
| Fig. 1 (a) SEM image of TCC1000. (b) N2 adsorption–desorption isotherms and pore size distributions of TCC1000 and TCC600. | ||
X-ray photoelectron spectroscopy (XPS) was employed to investigate the surface chemistries of the samples. Table S1† presents the atomic percentages of C and O as well as the C/O atomic ratio. After thermal treatment, the oxygen content increased slightly from 2.74 at% in CC to 4.86 at% in TCC1000. Various C and O components were further identified by fitting the C 1s and O 1s fine-scan spectra. As shown in Table S2 and Fig. S7,† the amounts of C–C and C![[double bond, length as m-dash]](https://www.rsc.org/images/entities/char_e001.gif) C along with the intensity of graphitic shake-up satellites were significantly increased. Meanwhile, as C–O related species were easily broken with increasing temperature and generated C
C along with the intensity of graphitic shake-up satellites were significantly increased. Meanwhile, as C–O related species were easily broken with increasing temperature and generated C![[double bond, length as m-dash]](https://www.rsc.org/images/entities/char_e001.gif) O bonds, the abundance of C–O was reduced, while the percentage of C(O)O increased. In addition, the C–F3 disappeared, implying that the hydrophobic coating on the surface of CC was thoroughly damaged after annealing, thereby enhancing the wettability. The C 1s peak-fitting results indicated that the annealing process can improve the electronic conductivity of the final products, favoring the restoration of the sp2 conjugated carbon lattice. Moreover, after carbonization at 1000 °C, the majority of unstable oxygen-containing groups were eliminated. According to the sequence of thermal stability for oxygen-containing groups on the carbon surface [carbonyl/quinone (CO) > lactone (CO2) > phenol (CO) > anhydride (CO and CO2) > carboxylic acid (CO2)], the functional groups related to C–O and O–H existed in the form of more thermally stable isolated ethers and phenols, respectively, and some unstable C
O bonds, the abundance of C–O was reduced, while the percentage of C(O)O increased. In addition, the C–F3 disappeared, implying that the hydrophobic coating on the surface of CC was thoroughly damaged after annealing, thereby enhancing the wettability. The C 1s peak-fitting results indicated that the annealing process can improve the electronic conductivity of the final products, favoring the restoration of the sp2 conjugated carbon lattice. Moreover, after carbonization at 1000 °C, the majority of unstable oxygen-containing groups were eliminated. According to the sequence of thermal stability for oxygen-containing groups on the carbon surface [carbonyl/quinone (CO) > lactone (CO2) > phenol (CO) > anhydride (CO and CO2) > carboxylic acid (CO2)], the functional groups related to C–O and O–H existed in the form of more thermally stable isolated ethers and phenols, respectively, and some unstable C![[double bond, length as m-dash]](https://www.rsc.org/images/entities/char_e001.gif) O was either reduced by thermal treatment or transformed into more thermally stable carbonyls. As a result, the hydroxyl and carboxyl groups at edge carbon sites were electroactive and thus supplied pseudocapacitance. Additionally, oxygen-containing groups benefit the overpotential of hydrogen evolution, and the negative potential can extend from −0.2 to −0.8 V. Thus the operating voltage window can extend from −0.2–1 V to −0.8–1 V. Introducing oxygen-containing groups to carbon can broaden the operated voltage by suppressing hydrogen evolution (Fig. S2†).29–32
O was either reduced by thermal treatment or transformed into more thermally stable carbonyls. As a result, the hydroxyl and carboxyl groups at edge carbon sites were electroactive and thus supplied pseudocapacitance. Additionally, oxygen-containing groups benefit the overpotential of hydrogen evolution, and the negative potential can extend from −0.2 to −0.8 V. Thus the operating voltage window can extend from −0.2–1 V to −0.8–1 V. Introducing oxygen-containing groups to carbon can broaden the operated voltage by suppressing hydrogen evolution (Fig. S2†).29–32
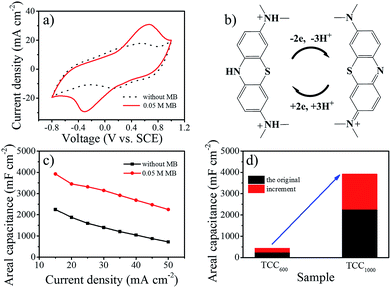
TCC1000 was then used as the working electrode to explore the electrochemical stability window in 1 M H2SO4 with the addition of 0.01 M MB. As is shown in Fig. S8,† an operating window between −0.8 and 1 V vs. SCE enabled the reversible redox reaction of MB. The capacitance of liquid-state supercapacitors clearly increase in the presence of MB (Fig. 2a). As illustrated by Fig. 2b, each MB molecule can be reversibly reduced and oxidized, and store three protons and two electrons in acidic media, thus leading to enhanced pseudocapacitance. The cyclic voltammetry (CV) curves at different rates and galvanostatic charge–discharge (GCD) tests were measured in 1 M H2SO4 with 0.05 M MB (Fig. S9†). In addition, the calculated areal capacitance is plotted as a function of current density in Fig. 2c. The porous, binder-free and three-dimensional electrode provided a conductive pathway for efficient charge transport and facilitated fast ion diffusion along with facile electrolyte permeation, consequently resulting in good rate capability after the addition of MB similar to the original rate capability which derived from EDLC. The areal capacitance of TCC1000 was enhanced from 2250 to 3925 mF cm−2 at 15 mA cm−2. Thus, the capacity enhancement of TCC1000 after the addition of MB was 1675 mF cm−2, much larger than the enhancement observed for TCC600 (216 mF cm−2; Fig. 2d). This demonstrates that the high surface area enhanced the electric double-layer capacitance and facilitated the adsorption of additives from the electrolyte (Fig. S4†), thereby greatly improving the pseudocapacitance.
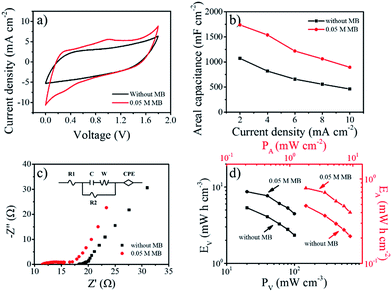
With the aim of exploring bendable and lightweight energy sources, SSCs are a promising replacement for liquid-state supercapacitors on account of their safety and applicability.25,33 Herein, to assemble SSCs, filter paper was placed as a separator between two pieces of TCC1000 coated with gel electrolyte in parallel. To investigate the effect of MB concentration, gel electrolytes were prepared with various MB concentrations (0, 0.01, 0.05, and 0.10 M). The working voltages of all the above SSCs were greater than 1.8 V, higher than the SSCS with other additives listed in Table S4.† Fig. S10a† shows the areal capacitances of electrolytes with different concentrations of MB calculated from the discharge times obtained in GCD tests at 2 to 10 mA cm−2 (Fig. S11†). Significantly, the areal capacitance varied greatly with the concentration (lower than 0.05 M) as a result of the fast faradaic reaction of MB, while it had negligible change at 0.1 M MB concentration, possibly because of electrostatic interaction between ions.34,35 The CV curves of the SSCs with MB clearly showed much larger areas compared to the curve of the original SSC without MB (Fig. 3a), further demonstrating the role of MB in delivering pseudocapacitance. The MB concentration of 0.05 M was determined to be optimal as the addition of more MB to the electrolyte did not further enhance the performance. SSCs with 0.05 M MB were then tested at various scan rates from 2 to 10 mV s−1 (Fig. S10b†). Clearly, a combination of both electric double-layer capacitance and pseudocapacitance was observed. The charge and discharge times of the SSCs with 0.05 MB were almost equal (Fig. S11c†), implying good electrochemical reversibility. The nonlinear profile further demonstrated the contribution of pseudocapacitance from MB, in agreement with the CV results. Meanwhile, 1738 mF cm−2 at 2 mA cm−2 (262 F g−1 and 19.3 F cm−3) can be achieved in PVA–H2SO4 with 0.05 M MB; these values are comparable to or even better than previously reported values.3,8,33,36,37 Similar to the phenomenon in liquid electrolyte above, the rate capability was maintained after adding 0.05 M MB to the system, indicating that effective redox reactions can happen in solid electrolytes.
Nyquist plots of PVA–H2SO4 with and without 0.05 M MB for frequency varying from 0.01 to 100 kHz are shown in Fig. 3c. Each curve consists of a semicircle and a straight line. The equivalent series resistance (ESR) was 11.40 Ω for PVA–H2SO4 with 0.05 M MB, smaller than that of PVA–H2SO4 without MB (18.0 Ω). This can be attributed to the improvement in ion conductivity by the addition of MB to the electrolyte.25,37 The straight line corresponding to Warburg resistance revealed the fast transport of ions and electrons between the electrolyte and electrodes of both kinds of SSCs. Energy density and power density are known to be two crucial factors for practical applications. The Ragone plots of the gel electrolyte with 0.05 M MB and without MB derived from the discharge curves are shown in Fig. 3d. PVA–H2SO4 with 0.05 M MB delivered a maximum areal energy density (EA) of 0.78 mW h cm−2 at an areal power density (PA) of 1.80 mW cm−2, corresponding to a volumetric energy density (EV) of 8.69 mW h cm−3 and a volumetric power density (PV) of 20 mW cm−3. This EA is five times higher than that of a TCC SSC (EA = 0.128 mW h cm−2 at 2 mA cm−2)10 and comparable to those of recently reported SSCs, including a CNT–PPy–HQ fiber–SSC (EV = 3.6 mW h cm−3)37 and ZnO–C–MnO2 SSC (EV = 0.04 mW h cm−3 at PV = 20 mW cm−3).38
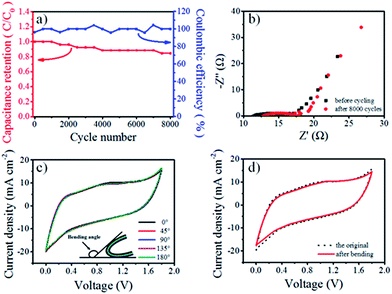
Furthermore, cyclic life is an important indicator for the practical application of SSCs. As shown in Fig. 4a, a capacitance decay of only 15.4% was observed after 8000 cycles at 20 mA cm−2 for the SSC with MB. This performance was better than that observed for the SSC without MB (Fig. S13†), and the coulombic efficiency simultaneously remained above 95%, demonstrating remarkable stability and reversibility comparable to those of recently reported SSCs with redox additives (Table S4†). The electrochemical impedance spectra (Fig. 4b) suggested that the ESR of the device with 0.05 M MB increased with cycling because of the evaporation of water from the solid-state electrolyte. Moreover, to evaluate the flexibility, the electrochemical performance of the SSC with MB was tested in a flat state and different bending states using CV tests at 10 mV s−1. Fig. 4c and d indicate that the electrochemical performance of the SSC with MB was not affected by bending. The curves in Fig. 4d remained the same after bending the device 1000 times, indicating that the gel electrolyte endowed the fabricated SSC with excellent flexibility and mechanical stability. Significantly, the 1 × 1 cm2 SSCs were able to power 40 red LEDs after charging for more than 90 s (Movie S1†).
Conclusions
In summary, high-performance flexible SSCs based on activated carbon cloths were successfully achieved by introducing MB into PVA–H2SO4 gel electrolyte. The introduction of MB both provided pseudocapacitance via fast faradic reactions and enhanced the ion conductivity of the electrolyte. Doping the treated carbon cloths with O can extend the operating voltage window to 1.8 V by suppressing the hydrogen evolution reaction, resulting in a high energy density of 0.78 mW h cm−2 at a power density of 1.80 mW cm−2. In addition, the as-assembled SSCs manifested various favorable features including enhanced capacitance (1738 mF cm−2), outstanding cyclic stability (15.4% decay after 8000 cycles) and excellent mechanical flexibility. This novel strategy provided a facile and economic approach to obtain devices with high energy storage capacity.Conflicts of interest
There are no conflicts to declare.Acknowledgements
Financial support from the National Key R&D Program of China (2016YFA0202900), the National Natural Science Foundation of China (21622308, 91534114, 21376208), the Key Program Supported by the Natural Science Foundation of Zhejiang Province, China (LZ18B060002), and the Fundamental Research Funds for the Central Universities are greatly appreciated.Notes and references
- Y. Yang, Q. Huang, L. Niu, D. Wang, C. Yan, Y. She and Z. Zheng, Adv. Mater., 2017, 29, 1606679 CrossRef PubMed.
- P. Simon and Y. Gogotsi, Nat. Mater., 2008, 7, 845–854 CrossRef CAS PubMed.
- Q. Huang, L. Liu, D. Wang, J. Liu, Z. Huang and Z. Zheng, J. Mater. Chem. A, 2016, 4, 6802–6808 CAS.
- G. Wang, H. Wang, X. Lu, Y. Ling, M. Yu, T. Zhai, Y. Tong and Y. Li, Adv. Mater., 2014, 26, 2676–2682 CrossRef CAS PubMed.
- P. Simon, Y. Gogotsi and B. Dunn, Science, 2014, 343, 1210–1211 CrossRef CAS PubMed.
- T. Chen, H. S. Peng, M. Durstock and L. M. Dai, Sci. Rep., 2014, 4, 7 Search PubMed.
- Y. Xu, Z. Lin, X. Huang, Y. Liu, Y. Huang and X. Duan, ACS Nano, 2013, 7, 4042–4049 CrossRef CAS PubMed.
- A. Ramadoss, B. Saravanakumar and S. J. Kim, Nano Energy, 2015, 15, 587–597 CrossRef CAS.
- S. Wang, N. Liu, J. Su, L. Li, F. Long, Z. Zou, X. Jiang and Y. H. Gao, ACS Nano, 2017, 11, 2066 CrossRef CAS PubMed.
- H. Wang, J. Deng, C. Xu, Y. Chen, F. Xu, J. Wang and Y. Wang, Energy Storage Materials, 2017, 7, 216–221 CrossRef.
- C. Choi, J. A. Lee, A. Y. Choi, Y. T. Kim, X. Lepro, M. D. Lima, R. H. Baughman and S. J. Kim, Adv. Mater., 2014, 26, 2059–2065 CrossRef CAS PubMed.
- H. Y. Wang, J. Deng, Y. Q. Chen, F. Xu, Z. Z. Wei and Y. Wang, Nano Res., 2016, 9, 2672–2680 CrossRef CAS.
- N. Wang, P. Zhao, K. Liang, M. Yao, Y. Yang and W. Hu, Chem. Eng. J., 2017, 307, 105–112 CrossRef CAS.
- K. Liang, L. Li and Y. Yang, ACS Energy Lett., 2017, 2, 373–390 CrossRef CAS.
- W. Liu, N. Liu, Y. Shi, Y. Chen, C. Yang, J. Tao, S. Wang, Y. Wang, J. Su and L. Li, J. Mater. Chem. A, 2015, 3, 13461–13467 CAS.
- J. Tao, N. Liu, L. Li, J. Su and Y. Gao, Nanoscale, 2014, 6, 2922–2928 RSC.
- L. Li, X. Zhang, Z. Zhang, M. Zhang, L. Cong, Y. Pan and S. Lin, J. Mater. Chem. A, 2016, 4, 16635–16644 CAS.
- S. Yue, H. Tong, L. Lu, W. Tang, W. Bai, F. Jin, Q. Han, J. He, J. Liu and X. Zhang, J. Mater. Chem. A, 2017, 5, 689–698 CAS.
- P. Chen, H. Chen, J. Qiu and C. Zhou, Nano Res., 2010, 3, 594–603 CrossRef CAS.
- L. Yuan, X. Xiao, T. Ding, J. Zhong, X. Zhang, Y. Shen, B. Hu, Y. Huang, J. Zhou and Z. L. Wang, Angew. Chem., Int. Ed., 2012, 51, 4934–4938 CrossRef CAS PubMed.
- A. Eftekhari, L. Li and Y. Yang, J. Power Sources, 2017, 347, 86–107 CrossRef CAS.
- L. Yuan, B. Yao, B. Hu, K. Huo, W. Chen and J. Zhou, Energy Environ. Sci., 2013, 6, 470–476 CAS.
- A. Vlad, N. Singh, S. Melinte, J. F. Gohy and P. M. Ajayan, Sci. Rep., 2016, 4, 4315 CrossRef PubMed.
- S. T. Senthilkumar, R. K. Selvan and J. S. Melo, J. Mater. Chem. A, 2013, 1, 12386–12394 CAS.
- G. Ma, M. Dong, K. Sun, E. Feng, H. Peng and Z. Lei, J. Mater. Chem. A, 2015, 3, 4035–4041 CAS.
- Y. Li, Q. Du, T. Liu, X. Peng, J. Wang, J. Sun, Y. Wang, S. Wu, Z. Wang, Y. Xia and L. Xia, Chem. Eng. Res. Des., 2013, 91, 361–368 CrossRef CAS.
- T. Wu, X. Cai, S. Tan, H. Li, J. Liu and W. Yang, Chem. Eng. J., 2011, 173, 144–149 CrossRef CAS.
- R. L. McCreery, Chem. Rev., 2008, 108, 2646–2687 CrossRef CAS PubMed.
- E. Frackowiak and F. Béguin, Carbon, 2001, 39, 937–950 CrossRef CAS.
- X. Fan, Y. Lu, H. Xu, X. Kong and J. Wang, J. Mater. Chem., 2011, 21, 18753–18760 RSC.
- V. Khomenko, E. Raymundo-Piñero and F. Béguin, J. Power Sources, 2010, 195, 4234–4241 CrossRef CAS.
- A. ŚwiąTkowski, M. Pakuła and S. Biniak, Electrochim. Acta, 1997, 42, 1441–1447 CrossRef.
- D. Kim, G. Lee, D. Kim, J. Yun, S.-S. Lee and J. S. Ha, Nanoscale, 2016, 8, 15611–15620 RSC.
- J. Wu, H. Yu, L. Fan, G. Luo, J. Lin and M. Huang, J. Mater. Chem., 2012, 22, 19025–19030 RSC.
- J. Wu, Z. Lan, D. Wang, S. Hao, J. Lin, Y. Huang, S. Yin and T. Sato, Electrochim. Acta, 2006, 51, 4243–4249 CrossRef CAS.
- X. Xiao, T. Ding, L. Yuan, Y. Shen, Q. Zhong, X. Zhang, Y. Cao, B. Hu, T. Zhai, L. Gong, J. Chen, Y. Tong, J. Zhou and Z. L. Wang, Adv. Energy Mater., 2012, 2, 1328–1332 CrossRef CAS.
- R. Xu, F. Guo, X. Cui, L. Zhang, K. Wang and J. Wei, J. Mater. Chem. A, 2015, 3, 22353–22360 CAS.
- P. Yang, X. Xiao, Y. Li, Y. Ding, P. Qiang, X. Tan, W. Mai, Z. Lin, W. Wu, T. Li, H. Jin, P. Liu, J. Zhou, C. P. Wong and Z. L. Wang, ACS Nano, 2013, 7, 2617–2626 CrossRef CAS PubMed.
Footnote |
| † Electronic supplementary information (ESI) available. See DOI: 10.1039/c7se00492c |
| This journal is © The Royal Society of Chemistry 2018 |


