A microwave-assisted thermolysis route to single-step preparation of MoS2/CdS composite photocatalysts for active hydrogen generation†
Lili
Jiang†
a,
Liangyu
Wang†
a,
Gengsheng
Xu
a,
Lina
Gu
a and
Yupeng
Yuan
 *ab
*ab
aSchool of Chemistry and Chemical Engineering, Anhui University, Hefei 230601, P. R. China. E-mail: yupengyuan@ahu.edu.cn
bInnovation Lab for Clean Energy & Green Catalysis, Anhui University, Hefei 230601, P. R. China
First published on 20th November 2017
Abstract
Noble-metal free co-catalysts show great potential for boosting the photocatalytic hydrogen generation activity of a photocatalyst. However, the growth of these co-catalysts is always time and energy intensive due to the multiple operations. Herein we report on facile and rapid growth of a MoS2 co-catalyst on CdS for active hydrogen generation via single-step microwave-assisted thermolysis of a Mo/Cd-thiourea complex. The MoS2/CdS hybrids by optimizing the microwave reaction time show active H2 generation upon visible light exposure. The highest H2 generation rate achieved was 11.4 mmol h−1 g−1 from the hybrid with 3 wt% MoS2 content, which is 2 times higher than that of 0.5 wt% Pt loaded CdS. The present microwave-assisted thermolysis is simple, easy to operate, and time and energy efficient, thereby providing a robust route for the preparation of metal sulfide-based photocatalysts.
Introduction
Solar production of H2 through water splitting using photocatalysts is generally regarded as an ideal technique for providing future H2 fuels as both solar energy and water are extremely abundant on earth. Of the various photocatalysts that have been identified for efficient H2 production,1–5 CdS has received much attention due to its narrow band gaps and suitable band position for photocatalytic water splitting.6–9 As a result, CdS offers efficient activity for photocatalytic H2 production under exposure to visible light. Generally, suitable noble metals, for example, Pt, as H2 evolution co-catalysts are required to be grown on the surface of CdS for harvesting photo-excited electrons and reducing the overpotential for H2 generation.10–12 Owing to the high costs of up-scaling use, earth-abundant alternatives, primarily based on nickel and molybdenum sulphides, are examined as noble-metal-free co-catalysts. For example, NiSx,13–18 WS2,19 and MoS2![[thin space (1/6-em)]](https://www.rsc.org/images/entities/char_2009.gif) 20–24 nanoparticles have been validated as co-catalysts for boosting H2 generation from CdS, despite their much lower efficiency.
20–24 nanoparticles have been validated as co-catalysts for boosting H2 generation from CdS, despite their much lower efficiency.
Among these metal sulfide co-catalysts, MoS2 is especially interesting as the bonding energy of hydrogen on MoS2 is as close to zero as that on Pt.25 In the past 5 years, various strategies, such as impregnation,26 ultrasound irradiation,27,28 ball milling,29 and hydrothermal/solvothermal methods,30–32 have been employed to prepare MoS2/CdS composite photocatalysts. In these studies, the CdS photocatalyst was normally prepared first and transition metal sulfide co-catalysts are then in situ grown onto the surface.13,20,27–32 The overall preparation process involves tedious and multiple-step operations for product washing and separation. Clearly, an efficient synthetic strategy for preparing metal sulphide co-catalyst/CdS hybrids is highly desirable yet challenging.
Herein, we report on a facile single-step route for the preparation of MoS2/CdS hybrid photocatalysts for increased H2 generation via rapid microwave-assisted thermolysis of a Mo/Cd-thiourea complex. It was found that the MoS2/CdS hybrids by optimizing the microwave reaction time show active H2 generation upon visible light exposure. The highest H2 generation rate achieved was 11.4 mmol h−1 g−1 from the hybrid with 3 wt% MoS2 content, which is 2 times higher than that of 0.5 wt% Pt-loaded CdS. The facile operation and high energy efficiency make the present strategy robust for the synthesis of metal sulfide-based photocatalysts.
Experimental
Preparation of MoS2/CdS hybrids
The Mo/Cd-thiourea complex was first prepared through mixing a certain amount of (NH4)6Mo7O24·4H2O with C4H10CdO4·2H2O (0.53 g) and H2NCSNH2 (0.91 g) in water under magnetic stirring (40 mL). An amount of (NH4)6Mo7O24·4H2O was added according to the theoretical ratios of 1%, 3%, 5% and 8% for MoS2 in the Mo/Cd-thiourea complex. After 30 min reaction, the mixed solution was dried at 80 °C in an oven. A yellow powder was collected from the beaker, and then put into an alumina crucible (20 mL), and finally covered with another crucible (40 mL) and the gap between the two crucibles stuffed with aluminum silicate. The crucible set was then buried with CuO powder (≥98.0%; Aladdin) in a big alumina crucible (200 mL). Finally, the crucibles were microwaved for a desired time in a microwave oven (M721NH1-PW, 700 W power; Meiling) to produce the final MoS2/CdS hybrids. For comparison, pure CdS was also prepared under the same experimental conditions.Characterization
X-ray powder diffraction (XRD) was carried out on a DX-2700 X-ray diffractometer by using an acceleration voltage and applied current of 45 kV and 40 mA, respectively. Cu Kα1 radiation was used and the scan rate is 1° min−1. The UV/vis absorption spectra were measured on a U-3900 UV-vis spectrophotometer. The morphology was observed by field-emission scanning electron microscopy (FESEM: Hitachi S-4800) and transmission electron microscopy (TEM: JEM-2100). Photoluminescence spectra (PL) were collected on a HITACHI F-4600 fluorometer. Raman spectra were measured on a Confocal Laser Micro-Raman Spectrometer (inVia-Reflex) with an excitation wavelength of 532 nm. The X-ray photoelectron spectra (XPS, ESCALAB 250Xi) were recorded using Al Kα radiation. The Brunauer–Emmett–Teller (BET) specific surface area was analyzed by nitrogen adsorption–desorption on a Micromeritics ASAP 2020.Photoelectrochemical measurements
The electrode was made by coating the CdS/MoS2 onto ITO glass (1.0 cm × 1.0 cm). The ITO glass was ultrasonically washed with ethanol for 1 h. A Nafion solution (1 mL) containing CdS/MoS2 powder (10 mg) was dispersed onto the ITO glass and then dried in air for 24 h to yield the ITO/CdS/MoS2 electrode.A three-electrode configuration was used to measure the photoelectrochemical properties on a CHI-660D electrochemical analyzer, wherein the ITO/CdS/MoS2, Ag/AgCl, and Pt wire were the working electrode, reference electrode, and counter electrode, respectively. Na2SO4 solution (0.1 M, 150 mL) was used as the electrolyte. A 300 W Xe lamp with a 420 nm cutoff filter was used to provide visible light for transient photocurrent measurements of the ITO/CdS/MoS2 electrode.
Photocatalytic measurements
The photocatalytic H2 production was carried out in an 80 mL pyrex reactor with a quartz window. In a typical photocatalytic reaction, 10 mg of photocatalyst was dispersed in 10 mL Na2SO3 (0.25 M) and Na2S (0.35 M) mixed aqueous solution. Ar was used to purge out the residual air in the reactor for 30 min. The reaction system was stirred during the photoreaction. The photocatalytic H2 generation was triggered by irradiating the reactor with a 300 W xenon lamp. A 420 nm cutoff filter was used to provide visible light. The gas products were sampled and analyzed periodically through gas chromatography (GC-1690, Kexiao, China) with a TCD detector. The quantum efficiency (QE) was measured at 420 nm by using a band-pass filter (half width: 10 nm) under the same conditions as H2 generation. The number of incident photons was measured with a power meter (1918-R, Newport). The QE was calculated according to the equation below:Results and discussion
Sample characterization
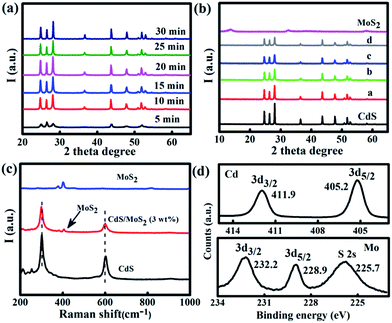
The Mo/Cd-thiourea complex was first analyzed by XRD and FT-IR. The intense XRD peaks (Fig. S1†) signify the formation of a crystalline Mo/Cd-thiourea complex. The FTIR spectrum (Fig. S2†) exhibits intense absorption peaks at 486 cm−1, supporting the Mo/Cd-S coordination effect. The Mo/Cd-thiourea complex has an aggregated morphology with a size of several tens of nanometers as shown by SEM and TEM observation (Fig. S3 and S4†).Subsequently, Mo/Cd-thiourea complexes were thermalized for various time periods (5, 10, 15, 20, 25, and 30 min) using a microwave-assisted heating strategy. CuO was used as the microwave absorber because it can efficiently absorb microwave energy to raise the temperature up to 1285 K within 7 min.33–37 The obtained products were labelled CdS/MoS2 (1 wt%), CdS/MoS2 (3 wt%), CdS/MoS2 (5 wt%), and CdS/MoS2 (8 wt%), respectively. Reference samples CdS and MoS2 were also prepared by thermolysis of Mo-thiourea and Cd-thiourea complexes under identical experimental conditions, respectively. We first investigate the effect of heating time on the crystallinity of the produced CdS by using the Cd-thiourea precursor as representative. Impressively, CdS can be yielded after only 5 min microwave heating. However, the peak intensity is low (Fig. 1a). The XRD peak intensity is dependent on the microwave heating time. For example, after 10 min microwave irradiation, the obtained product exhibits typical XRD peaks of hexagonal CdS (PDF#41-1049) (Fig. 1a), and the peaks' intensity is progressively increased with prolonged microwave heating times of 10, 15, and 20 min (Fig. 1a), supporting the gradually improved crystallinity of the produced CdS. Note that the XRD peak intensity does not improve any further even extending the microwave irradiation time to 30 min (Fig. 1a). However, an evident XRD peak shift occurs when the microwave heating time is 30 min (Fig. S5†). Considering the crystallinity and crystal structure, a heating time of 25 min was chosen for the thermolysis of the Mo/Cd-thiourea complex in the following experiments. Fig. 1b shows the XRD patterns for MoS2/CdS hybrids with various amounts of MoS2 content. The reference samples of pristine CdS and MoS2 are also included for comparison. All diffraction peaks in Fig. 1b can be assigned to hexagonal CdS (PDF#41-1049), supporting the formation of pure phase CdS despite the addition of Mo ions. In addition, the diffraction peaks for CdS remain unchanged with Mo6+ addition, revealing that the incorporation of Mo6+ ions does not alter the crystallization process of CdS (Fig. 1b). No shift for the XRD peak of the produced MoS2/CdS hybrids was observed (Fig. S6†), supporting that the Mo6+ is not doped into the CdS lattice. This result is very essential for single-step preparation of MoS2/CdS hybrid photocatalysts. Notably, no XRD peaks belonging to MoS2 could be detected in MoS2/CdS hybrids owing to the relatively weak peak intensity of pristine MoS2 as shown in Fig. 1b.
Raman spectroscopy was used to further verify the MoS2 existence in the CdS/MoS2 (3 wt%) hybrid as shown in Fig. 1c. Pristine CdS exhibits two typical peaks at 299 and 597 cm−1, which can be assigned to first-order (1LO) and second-order (2LO) longitudinal optical phonon modes of CdS, respectively.32 In contrast, two additional weak peaks at 376 and 403 cm−1 emerged for CdS/MoS2 (3 wt%) in addition to the peaks of CdS. The peak position of these two new peaks is essentially the same as those of pristine MoS2 (Fig. 1c), supporting MoS2 formation in the CdS/MoS2 (3 wt%) sample.38 Note that the chemical structure of MoS2 and CdS remains unchanged in the CdS/MoS2 (3 wt%) hybrid as revealed by the unshifted Raman peaks.
XPS analysis confirms the S, Cd, and Mo peaks for CdS/MoS2 (3 wt%) (see Fig. 1d). The Cd 3d peaks with a peak separation δ = 3d3/2 − 3d1/2 = 6.7 eV signify the Cd2+ chemical state in CdS (Fig. 1d, upper panel).26 The S 2p peaks at 161.4 and 162.5 eV for the S 2p3/2 and 2p1/2 states show the S2− chemical state in CdS and CdS/MoS2 (3 wt%), respectively (Fig. S7†).39 Although the Cd 3d and S 2p peaks of the hybrid shift to high binding energy compared to pristine CdS, the sample peak separation value in the two CdS samples still validates the Cd2+ and the S2− chemical state (Fig. S7†). The doublet peaks at 232.2 and 228.9 for Mo 3d orbitals confirms the Mo4+ chemical state in CdS/MoS2 (3 wt%),21,40 further showing the MoS2 formation (Fig. 1d, lower panel). The XPS analysis, together with XRD and Raman results, clearly verifies the rapid formation of MoS2/CdS hybrids by the microwave-assisted heating process.
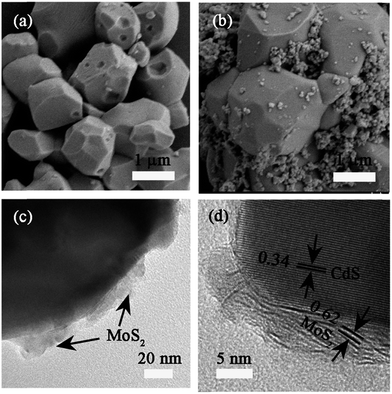
Fig. 2 shows the representative SEM and TEM images of pristine CdS and CdS/MoS2 (3 wt%). Pristine CdS particles have an irregular morphology with an average size of 1–2 μm. The surface of CdS particles is quite smooth and clean (Fig. 2a and b). Compared to the relatively uniform size distribution of pristine CdS particles, the CdS/MoS2 (3 wt%) hybrid contains CdS particles with a relatively large size of 1–2 μm and ultrafine CdS particles with a size of several tens of nanometers. The reason for this inequality in the CdS size is still not clear. Further examination by TEM clearly exhibits the MoS2 adhering on the surface of CdS in CdS/MoS2 (3 wt%) (Fig. 2c). The adhered nanocrystals have a lattice spacing of 0.62 nm, indexed to the (002) facets of MoS2. CdS has very clear lattice fringes of 0.34 nm, corresponding to the (002) planes (Fig. 2d). In addition, MoS2 is intimately attached to the CdS surface, which is very essential for the formation of a junction between the two components. As a result, charges can transfer across the junction formed, thereby leading to improved charge separation and photocatalytic activity.
Fig.3 compares the UV/vis spectra of MoS2/CdS hybrids with pristine CdS and MoS2. The pristine CdS exhibits a semiconductor-like absorption edge of 550 nm, corresponding to a 2.25 eV band-gap energy. The absorption edge of MoS2/CdS hybrids closely resembles that of pristine CdS (Fig. 3). However, the increased MoS2 amount in MoS2/CdS hybrids elevates the absorption level to above 550 nm, as indicated by a gradual color change from orange to dark gray. The BET surface area of pure CdS, CdS/MoS2 (1 wt%), CdS/MoS2 (3 wt%), CdS/MoS2 (5 wt%), and CdS/MoS2 (8 wt%) is 0.4, 7.1, 9.0, 15.8 and 21.2 m2 g−1, respectively (Fig. S8†). The enlarged surface area should be caused by the formed ultrafine CdS particles as shown in Fig. 2b.
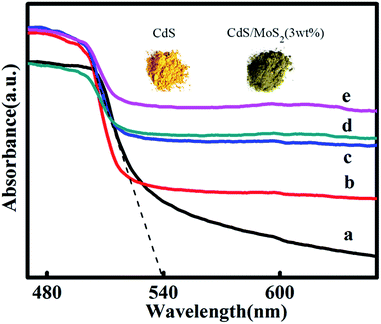 | ||
| Fig. 3 UV/vis absorption spectra of (a) pristine CdS, (b) CdS/MoS2 (1 wt%), (c) CdS/MoS2 (3 wt%), (d) CdS/MoS2 (5 wt%), and (e) CdS/MoS2 (8 wt%). | ||
Photocatalytic H2 production
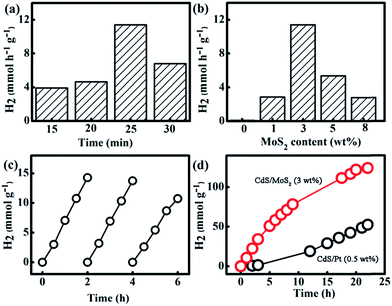
In order to reveal the effect of MoS2 loading on promoting the H2 generation activity of CdS, MoS2/CdS samples were tested for photocatalytic water reduction upon exposure to visible light. A mixed solution of Na2S (0.25 M) and Na2SO3 (0.35 M) was used as the electron donor to harvest the photogenerated holes in the CdS/MoS2 samples.41 No H2 was evolved in the control experiments, such as in the absence of either CdS/MoS2 photocatalysts or light irradiation. Photocatalytic H2 generation activity is heavily dependent on the microwave irradiation time. The MoS2/CdS hybrid that was prepared after 25 min microwave irradiation displays the highest H2 generation rate of 11.4 mmol h−1 g−1 (Fig. 4a). Therefore, the MoS2/CdS hybrids that were yielded by thermolysis of Cd/Mo-thiourea precursors for 25 min were examined for H2 generation in the following experiments.Fig. 4b exhibits the average H2 generation rate on MoS2/CdS samples over the first four hours. Pristine CdS displays a very poor H2 generation activity (trace H2 was detected). Similarly, MoS2 alone does not offer H2 evolution under the same experimental conditions. In sharp contrast, the combination of CdS and MoS2 results in greatly increased H2 generation activity. For example, CdS/MoS2 (1 wt%) shows a H2 generation rate of 2.85 mmol h−1 g−1 (Fig. 4b) under visible light irradiation. The highest H2 generation rate of 11.4 mmol h−1 g−1 was achieved on the CdS/MoS2 (3 wt%) sample. The corresponding quantum efficiency (QE) is determined to be 1.22%. Despite the low QE value when compared to previous reports,23,26,27 the H2 generation rate is evidently higher than the H2 generation rate of 1 wt% Pt loaded CdS under the same experimental conditions (Fig. 4d), supporting the superiority of MoS2 as a noble-metal-free co-catalyst to boost H2 generation. It is also worth highlighting the importance of the in situ growth of MoS2 particles in obtaining enhanced H2 generation. In contrast, the simple physical mixture of MoS2 (3 wt%) and CdS photocatalyst only exhibits a trace H2 generation under identical experimental conditions (Fig. S9†). This result supports the formation of MoS2 and CdS junctions for promoting effective charge transfer from photoexcited CdS to the MoS2 co-catalyst, which in turn suppresses the recombination of electron–hole pairs and leads to increased H2 generation rates. A further increase of the MoS2 loading amount to 5 wt% leads to a decreased H2 generation rate of 5.34 mmol h−1 g−1 due to the “shielding effect”. The over-coverage of MoS2 hinders light absorption by the CdS photocatalyst. In addition, the coverage of the actives sites for H2 evolution by overloading MoS2 also leads to reduced H2 generation.
We further examined the long-term photo-stability for photocatalytic H2 generation by using CdS/MoS2 (3 wt%) as a representative sample. The cyclic H2 generation experiments also display repeatable H2 generation rates over three consecutive cycles (Fig. 4c). The long term H2 generation shows an impressive higher activity from CdS/MoS2 (3 wt%) than that from 0.5 wt% Pt deposited CdS despite the slightly decreased activity in the 22 h test (Fig. 4d). XRD analysis verifies the retained phase of CdS/MoS2 (3 wt%) after 22 h H2 generation reactions (Fig. S10†). Importantly, SEM observations confirm the unchanged morphology of MoS2 on the surface of CdS after 4 h H2 generation experiments (Fig. S11†). We also measured the XPS spectra of CdS/MoS2 (3 wt%) after 4 h H2 generation (Fig. S12†). No obvious change can be observed for CdS/MoS2 (3 wt%) before and after 4 h H2 generation, further exemplifying the excellent stability of the present CdS/MoS2 composite photocatalyst. These results clearly suggest the excellent stability of MoS2/CdS photocatalysts for H2 generation. The excellent stability of the present CdS/MoS2 composite should result from the Na2SO3 and Na2S solution as the photogenerated holes preferably oxidize the sacrificial electron donor Na2S.42
Mechanism of enhanced photocatalytic H2 production
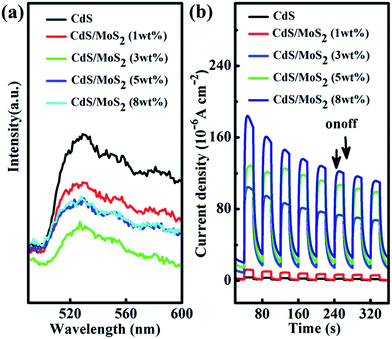
The conduction band (CB) edge of CdS (−0.90 V vs. the NHE at pH = 7.0) is more negative than that of MoS2 (−0.28 V vs. the NHE at pH = 7.0).43,44 The photogenerated electrons on CdS could thus transfer to the MoS2 co-catalyst across the CdS/MoS2 interfaces.21–23 The accumulated electrons on the MoS2 co-catalyst can then reduce H+ to H while the retained holes on CdS can thus oxidize the sacrificial electron donors. Interfacial charge transfer is confirmed by the decreased photoluminescence (PL) intensity in CdS/MoS2 (3 wt%) as compared to CdS alone (Fig. 5a). Pristine CdS has a strong PL peak at 530 nm. MoS2 adherence significantly reduces this peak (Fig. 5a). We further measured the transient photocurrent in pure CdS and CdS/MoS2 (3 wt%) to evaluate the efficient separation of photoexcited electron–hole pairs in CdS/MoS2 (3 wt%). The photocurrent response (Fig. 5b) is prompt during the on/off cycles upon visible light excitation. The photocurrent generated on the CdS/MoS2 (3 wt%) sample is substantially larger than that on the pure CdS sample, clearly supporting the more effective separation of charges in CdS/MoS2 (3 wt%) compared with CdS alone. Notably, the photocurrent shows a gradual drop with prolonged testing. This result should be caused by the poor binding between CdS/MoS2 and the ITO substrate as we observed the separation of the CdS/MoS2 catalyst from the ITO substrate in our test.Conclusions
In summary, we demonstrated a facile single-step-synthesis of MoS2/CdS composite photocatalysts through microwave-assisted thermolysis of a Mo/Cd-thiourea complex. During the microwave-assisted heating, MoS2 and CdS particles and intimate interfaces between MoS2 and CdS are formed concurrently. As a result, charge transfer from photo-excited CdS to MoS2 was improved as exemplified by the increased photocatalytic H2 generation (11.4 mmol h−1 g−1) compared to the physical mixture of MoS2 and CdS counterparts (trace amount of H2). This work shows, for the first time, the great potential of a microwave-assisted heating strategy in preparing metal sulphide-based composite photocatalysts for increased H2 generation.Conflicts of interest
There are no conflicts to declare.Acknowledgements
This work was financially supported by the National Natural Science Foundation of China (51572003) and Anhui Provincial Natural Science Foundation (1508085ME105). Dr Yuan acknowledges the financial support from the SRF for ROCS, SEM, and Technology Foundation for Selected Overseas Chinese Scholars.Notes and references
- A. Fujishima and K. Honda, Nature, 1972, 238, 37–38 CrossRef CAS PubMed.
- X. Li, J. Yu and M. Jaroniec, Chem. Soc. Rev., 2016, 45, 2603–2636 RSC.
- Y. P. Yuan, L. W. Ruan, J. Barber, S. C. J. Loo and C. Xue, Energy Environ. Sci., 2014, 7, 3934–3951 CAS.
- X. Chen, S. Shen, L. Guo and S. Mao, Chem. Rev., 2010, 110, 6503–6570 CrossRef CAS PubMed.
- A. Kudo and Y. Miseki, Chem. Soc. Rev., 2009, 38, 253–278 RSC.
- Q. Li, X. Li, S. Wageh, A. A. Al-Ghamdi and J. Yu, Adv. Energy Mater., 2015, 5, 1500010 CrossRef.
- J. Hu, A. Liu, H. Jin, D. Ma, D. Yin, P. Ling, S. Wang, Z. Lin and J. Wang, J. Am. Chem. Soc., 2015, 137, 11004–11010 CrossRef CAS PubMed.
- P. Y. Kuang, P. X. Zheng, Z. Q. Liu, J. L. Lei, H. Wu, N. Li and T. Y. Ma, Small, 2016, 12, 6735–6744 CrossRef CAS PubMed.
- R. B. Wei, P. Y. Kuang, H. Cheng, Y. B. Chen, J. Y. Long, M. Y. Zhang and Z. Q. Liu, ACS Sustainable Chem. Eng., 2017, 5, 4249–4257 CrossRef CAS.
- K. Wu, H. Zhu, Z. Liu, W. Rodríguez-Córdoba and T. Lian, J. Am. Chem. Soc., 2012, 134, 10337–10340 CrossRef CAS PubMed.
- M. Berr, A. Vaneski, A. S. Susha, J. Rodriguez-Fernandez, M. Doeblinger, F. Jaeckel, A. L. Rogach and J. Feldmann, Appl. Phys. Lett., 2010, 97, 093108 CrossRef.
- M. J. Berr, A. Vaneski, C. Mauser, S. Fischbach, A. S. Susha, A. L. Rogach, F. Jackel and J. Feldmann, Small, 2012, 8, 291–297 CrossRef CAS PubMed.
- W. Zhang, Y. B. Wang, Z. Wang, Z. Y. Zhong and R. Xu, Chem. Commun., 2010, 46, 7631–7633 RSC.
- J. Zhang, S. Z. Qiao, L. F. Qi and J. G. Yu, Phys. Chem. Chem. Phys., 2013, 15, 12088–12094 RSC.
- J. Zhang, L. F. Qi, J. R. Ran, J. G. Yu and S. Z. Qiao, Adv. Energy Mater., 2014, 4, 1301925 CrossRef.
- Y. P. Yuan, S. W. Cao, L. S. Yin, L. Xu and C. Xue, Int. J. Hydrogen Energy, 2013, 38, 7218–7223 CrossRef CAS.
- X. X. Li, G. F. Chen, K. Xiao, N. Li, T. Y. Ma and Z. Q. Liu, Electrochim. Acta, 2017, 255, 153–159 CAS.
- G. F. Chen, T. Y. Ma, Z. Q. Liu, N. Li, Y. Z. Su, K. Davey and S. Z. Qiao, Adv. Funct. Mater., 2016, 26, 3314–3323 CrossRef CAS.
- X. Zong, J. F. Han, G. J. Ma, H. J. Yan, G. P. Wu and C. Li, J. Phys. Chem. C, 2011, 115, 12202–12208 CAS.
- X. Zong, H. J. Yan, G. P. Wu, G. J. Ma, F. Y. Wen, L. Wang and C. Li, J. Am. Chem. Soc., 2008, 130, 7176–7177 CrossRef CAS PubMed.
- B. Han, S. Q. Liu, N. Zhang, Y. J. Xu and Z. R. Tang, Appl. Catal., B, 2017, 202, 298–304 CrossRef CAS.
- S. Ma, J. Xie, J. Q. Wen, K. L. He, X. Li, W. Liu and X. C. Zhang, Appl. Surf. Sci., 2017, 391, 580–591 CrossRef CAS.
- X. L. Yin, L. L. Li, W. J. Jiang, Y. Zhang, X. Zhang, L. J. Wan and J. S. Hu, ACS Appl. Mater. Interfaces, 2016, 8, 15258–15266 CAS.
- S. Ma, J. Xie, J. Wen, K. He, X. Li, W. Liu and X. C. Zhang, Appl. Surf. Sci., 2017, 391, 580–591 CrossRef CAS.
- B. Hinnemann, P. G. Moses, J. Bonde, K. P. Jørgensen, J. H. Nielsen, S. Horch, I. Chorkendorff and J. K. Norskov, J. Am. Chem. Soc., 2005, 127, 5308–5309 CrossRef CAS PubMed.
- X. Zong, G. P. Wu, H. J. Yan, G. J. Ma, J. Y. Shi, F. Y. Wen, L. Wang and C. Li, J. Phys. Chem. C, 2010, 114, 1963–1968 CAS.
- J. He, L. Chen, F. Wang, Y. Liu, P. Chen, C. Au and S. F. Yin, ChemSusChem, 2016, 9, 624–630 CrossRef CAS PubMed.
- K. Chang, M. Li, T. Wang, S. Ouyang, P. Li, L. Liu and J. Ye, Adv. Energy Mater., 2015, 5, 1402279 CrossRef.
- G. P. Chen, D. M. Li, F. Li, Y. Z. Fan, H. F. Zhao, Y. H. Luo, R. C. Yu and Q. B. Meng, Appl. Catal., A, 2012, 443–444, 138–144 CrossRef CAS.
- Y. Liu, H. T. Yu, X. Quan and S. Chen, Int. J. Photoenergy, 2013, 2013, 1–5 Search PubMed.
- J. Zhang, Z. P. Zhu and X. L Feng, Chem.–Eur. J., 2014, 20, 10632–10635 CrossRef CAS PubMed.
- J. Xu and X. J. Cao, Chem. Eng. J., 2015, 260, 642–648 CrossRef CAS.
- Y. Li, D. Xu, Q. Zhang, D. Chen, F. Huang, Y. Xu, G. Guo and Z. Gu, Chem. Mater., 1999, 11, 3433–3435 CrossRef CAS.
- W. T. Xu, P. Ye, J. Iocozzia, H. F. Zhang, Y. P. Yuan and Z. Q. Lin, J. Mater. Chem. A, 2017, 5, 21669–21673 CAS.
- Y. P Yuan, L. S. Yin, S. W. Cao, L. N. Gu, G. S. Xu, P. W. Du, H. Chai, Y. S. Liao and C. Xue, Green Chem., 2014, 16, 4663–4668 RSC.
- L. Lin, P. Ye, C. Cao, Q. Jin, G. S. Xu, Y. H. Shen and Y. P. Yuan, J. Mater. Chem. A, 2015, 3, 10205–10208 CAS.
- Y. F. Guo, J. Li, Y. P. Yuan, L. Li, M. Zhang, C. Zhou and Z. Lin, Angew. Chem., Int. Ed., 2016, 55, 14693–14697 CrossRef CAS PubMed.
- H. Li, Q. Zhang, C. C. R. Yap, B. K. Tay, T. H. T. Edwin, A. Olivier and D. Baillargeat, Adv. Funct. Mater., 2012, 22, 1385–1390 CrossRef CAS.
- X. Ning, S. Meng, X. Fu, X. Ye and S. Chen, Green Chem., 2016, 18, 3628–3639 RSC.
- Y. Shi, J. K. Huang and L. Jin, Sci. Rep., 2013, 3, 1839 CrossRef PubMed.
- Y. Yuan, S. Cao, L. Yin, L. Xu and C. Xue, Int. J. Hydrogen Energy, 2013, 38, 7218–7223 CrossRef CAS.
- X. Li, J. Yu, J. Low, Y. Fang, J. Xiao and X. Chen, J. Mater. Chem. A, 2015, 3, 2485–2534 CAS.
- J. Zhou, R. Wang, X. Liu, F. Peng, C. Li, F. Teng and Y. Yuan, Appl. Surf. Sci., 2015, 346, 278–283 CrossRef CAS.
- L. Long, J. Chen, X. Zhang, A. Zhong, Y. Huang, Q. Rong and H. Yu, NPG Asia Mater., 2016, 8, e263 CrossRef CAS.
Footnote |
| † Electronic supplementary information (ESI) available: SEM and TEM images; FT-IR spectra; N2 absorption–desorption isotherm; XPS spectra; and photocatalytic H2 production. See DOI: 10.1039/c7se00475c |
| This journal is © The Royal Society of Chemistry 2018 |


