A reduced graphene oxide–NiO composite electrode with a high and stable capacitance†
Xiaoming
Sun
 ,
Hao
Lu
 ,
Peng
Liu
,
Thomas E.
Rufford
,
Peng
Liu
,
Thomas E.
Rufford
 ,
Rohit R.
Gaddam
 ,
Xin
Fan
 and
X. S.
Zhao
 *
*
The School of Chemical Engineering, The University of Queensland, St Lucia, Brisbane, QLD 4072, Australia. E-mail: george.zhao@uq.edu.au
First published on 18th December 2017
Abstract
We report a vacuum-thermal strategy for the preparation of a composite electrode material consisting of reduced graphene oxide and nickel oxide nanoparticles, which displays interesting electrocapacitive properties. Graphene oxide thermally expands in a vacuum and simultaneously nickel(II) acetylacetonate decomposes to form NiO nanoparticles between graphene layers. This method not only allows the uniform dispersion of NiO nanoparticles between graphene layers but also enables simultaneous reduction of graphene oxide. The structural and electrochemical advantages of both reduced graphene oxide and nanoscale NiO particles are maintained. The reduced graphene oxide–NiO composite exhibits a specific capacitance of 880 F g−1 at a current density of 1 A g−1 in 6 M KOH and a 93.1% retention of initial capacitance after 5000 cycles at 5 A g−1.
1. Introduction
Supercapacitors (SCs), also known as ultracapacitors, are energy storage systems with unique characteristics, including high power density, fast charge/discharge rates and a long cycle life.1 The energy storage mechanism of SCs is based on electric double layer (EDL) capacitance and pseudocapacitance. The main shortcoming of SCs is their low energy density in comparison with rechargeable batteries. The energy density of SCs can be improved by enhancing the specific capacitance and/or increasing the working voltage window of the cell. As the capacitance of SCs is determined by the specific capacitance of the electrode materials, a great deal of research interest has been focused on new electrode materials with a high specific surface area accessible to electrolyte ions, high electron conductivity, and excellent stability upon cycling.2–4Graphene has been studied widely as a promising electrode material for SCs.5–8 Many studies have investigated methods to expand and/or exfoliate graphite to prepare graphene materials, including mechanical expansion methods,9 chemical methods,10,11 and thermal methods.12,13 Among them, methods involving thermal expansion at high temperatures14 and sometimes in a vacuum15 are a facile approach.
In addition, metal oxides with a high pseudocapacitance such as nickel oxide (NiO),16–18 manganese oxide,19–21 and iron oxide22,23 have been combined with graphene to prepare composite electrodes for SCs. Such composite electrode materials are reported to benefit from excellent kinetics of charge transfer, structural stability during charge/discharge processes, and good electrical conductivity.
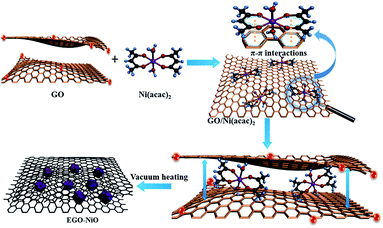
We have previously reported the capacitive improvement of graphene by introducing metal oxides,24 conducting polymers,25 carbon nanotubes,26 and carbon nanospheres.27 Here, we demonstrate a facile approach to produce a composite electrode of expanded graphene oxide (EGO) decorated with NiO nanoparticles (this composite is labelled EGO–NiO) as an advanced electrode material for SCs. The preparation is schematically illustrated in Fig. 1. Nickel(II) acetylacetonate [Ni(acac)2] was selected as the nickel precursor, which can diffuse between graphene sheets of graphene oxide (GO) flakes.28–30 Upon heating up to 550 °C, Ni(acac)2 decomposes to form NiO nanoparticles31,32 on the GO sheet surface. The interlayer space of the GO sheets was simultaneously expanded. Meanwhile, a large number of oxygen-containing groups on GO were thermally reduced.11 The deposited NiO nanoparticles prevent restacking of the reduced GO (RGO), providing sufficient space for electrolyte ions to move while the NiO nanoparticles contribute significantly to pseudocapacitance.
2. Experimental
2.1 Chemicals
Graphite flakes, potassium permanganate (KMnO4, 99 wt%), polytetrafluoroethylene (PTFE, 60 wt% in water), nickel(II) acetylacetonate (Ni(acac)2, 95%) and Whatman cellulose filter paper were purchased from Sigma-Aldrich. Hydrochloric acid (HCl, 32 wt%), sulfuric acid (H2SO4, 95 wt%) and ammonia solution (NH3·H2O) were purchased from EMSURE. Hydrogen peroxide (H2O2, 30 wt%), sodium nitrate (NaNO3, 95%) and potassium hydroxide (KOH) were purchased from CHEM-supply. Carbon black (Vulcan XC 72R) was provided by Cabot, Co. USA. Nickel foam was purchased from Shenzhen Biyuan Electronic, Co. Ltd, China. All chemicals were used as received without further purification.2.2 Preparation of GO
Graphite oxide was prepared using a modified Hummers' method described elsewhere.33 Typically, 5 g of graphite flakes and 2.5 g of NaNO3 were mixed in a 500 mL two-necked flask. Then 120 mL of 95 wt% H2SO4 was added, and the mixture was stirred at a speed of 300 rpm for 30 min in a water bath at 4 °C. Then 15 g of KMnO4 was added in small amounts to keep the reaction temperature lower than 98 °C. The mixture was stirred overnight at 4 °C before 150 mL of deionized water (DI water) was added drop-wise under vigorous stirring. The diluted suspension was further stirred for another 24 h before 50 mL of 30 wt% H2O2 was added to the mixture. We recovered the solids from the suspension using a centrifuge, then washed them with DI water, and dispersed the GO in suspension using an ultrasonic bath.2.3 Preparation of the EGO–NiO composite
The pH of the GO suspension was adjusted to 10 by adding ammonia (25 wt%). Then Ni(acac)2 was added to the suspension at a mass ratio of GO![[thin space (1/6-em)]](https://www.rsc.org/images/entities/char_2009.gif) :
:![[thin space (1/6-em)]](https://www.rsc.org/images/entities/char_2009.gif) Ni(acac)2 = 1
Ni(acac)2 = 1![[thin space (1/6-em)]](https://www.rsc.org/images/entities/char_2009.gif) :
:![[thin space (1/6-em)]](https://www.rsc.org/images/entities/char_2009.gif) 1. The mixture was stirred at 400 rpm for 1 h to obtain a solid precipitate, which we separated using a centrifuge and dried at 60 °C for 24 h. The intermediate product collected at this stage is denoted as GO/Ni(acac)2. The GO/Ni(acac)2 was heated in a furnace under a vacuum of approximately 75 Pa at 5 °C min−1 to 220 °C and held at this temperature for 0.5 h before the final heat treatment at 550 °C for another 3 h. We describe the product from this process as EGO–NiO.
1. The mixture was stirred at 400 rpm for 1 h to obtain a solid precipitate, which we separated using a centrifuge and dried at 60 °C for 24 h. The intermediate product collected at this stage is denoted as GO/Ni(acac)2. The GO/Ni(acac)2 was heated in a furnace under a vacuum of approximately 75 Pa at 5 °C min−1 to 220 °C and held at this temperature for 0.5 h before the final heat treatment at 550 °C for another 3 h. We describe the product from this process as EGO–NiO.
We compared the physical and chemical properties, and electrochemical performance of the EGO–NiO composite to those of three samples produced by other methods. (a) Thermally treated GO flakes (T-GO) were prepared from GO by the same two-step procedure at 220 °C and 550 °C under vacuum as described for EGO–NiO. (b) A GO–nickel oxide composite, GO–solNiO, was prepared from a water soluble nickel precursor, Ni(NO3)2, by the same procedures as those used for EGO–NiO. And (c) a GO–nickel oxide composite, phGO–NiO, was prepared by physically mixing GO with Ni(acac)2 at a mass ratio of 1![[thin space (1/6-em)]](https://www.rsc.org/images/entities/char_2009.gif) :
:![[thin space (1/6-em)]](https://www.rsc.org/images/entities/char_2009.gif) 1, and this mixture was also heated at 550 °C for 3 h in a vacuum.
1, and this mixture was also heated at 550 °C for 3 h in a vacuum.
2.4 Characterization
Samples were characterized by transmission electron microscopy (TEM, JEOL 2100), energy dispersive X-ray spectroscopy (EDS), scanning electron microscopy (SEM, JEOL F7001), and X-ray photoelectron spectroscopy (XPS, Kratos Axis Ultra photoelectron spectrometer using a monochromatic Al Kα excitation source: 1486.6 eV, at 225 W, 15 kV and 15 mA). The XPS spectra were calibrated to carbon C 1s at a binding energy of 284.6 eV, and quantitative analysis was performed with Casa XPS after Shirley background subtraction. X-ray diffraction (XRD) patterns were recorded on a Bruker D8 Advance X-ray diffractometer with Ni-filtered Cu Kα radiation (λ = 1.54056 Å) at a scan rate of 2 °C min−1, a voltage of 40 kV and a current of 30 mA. N2 adsorption and desorption experiments were performed on a Tristar II 3020 at 77 K. Before measurement, all samples were degassed at 150 °C overnight under vacuum. The specific surface area was determined by using the Brunauer–Emmett–Teller (BET) method. Atomic force microscopy (AFM) analysis was performed with a Cypher S AFM (Oxford Instruments).2.5 Electrochemical characterization
Electrodes were fabricated by mixing an active material (80 wt%), carbon black (15 wt%) as a conductive additive, and PTFE (5 wt%) as a binder. The mixture was compressed into a KOH-cleaned Ni foam support with approximately 1.5 mg cm−2 loading of the active material. A three-electrode cell with Hg/HgO as the reference electrode and 6 M KOH as the electrolyte was used to assess the samples. The electrodes were soaked in the KOH electrolyte for 24 h before electrochemical measurements.Cyclic voltammetry (CV) and galvanostatic charge–discharge (GCD) tests were performed on an Autolab PGSTAT 3020N. The CV scans were collected in a potential window of 0–0.5 V and at scan rates of 5–50 mV s−1. The GCD tests were performed at current densities from 1 to 20 A g−1 in the potential window of 0–0.5 V. Electrochemical impedance spectroscopy (EIS) was carried out at the open circuit potential with an amplitude of 10 mV in the frequency range of 10−2 to 105 Hz.
The specific capacitance of a single electrode was calculated from GCD profiles using eqn (1):
 | (1) |
3. Results and discussion
The XRD patterns of GO and GO/Ni(acac)2 presented in Fig. 2a show diffraction peaks at 2θ = 12.6°, corresponding to an interlayer d-spacing of 0.70 nm in GO, and 2θ = 10.8°, corresponding to an increased d-spacing of 0.82 nm in the GO/Ni(acac)2 intermediate product. The diffraction pattern of EGO–NiO in Fig. 2a does not feature any strong peaks at 2θ values between 10° and 13°. Instead, in the low angle XRD pattern (Fig. 2b), we can observe a small peak at 2θ = 1.96°. This 2θ value corresponds to a d-spacing of 4.50 nm, which indicates a significant expansion of the graphene layers in EGO–NiO. In contrast, the d-spacing in T-GO was only 0.33 nm (see Fig. S1† with a broad peak at around 2θ = 26°), which is close to the interlayer spacing of graphite,34 indicating that this vacuum-thermal treatment cannot lead to interlayer expansion of GO in the absence of Ni(acac)2. The presence of nickel oxide in EGO–NiO is confirmed by XRD peaks (Fig. 2a) at 2θ = 37.25° and 2θ = 43.28°, which match the diffraction patterns of the (111) and (200) planes of NiO (JCPDS 47-1049), respectively.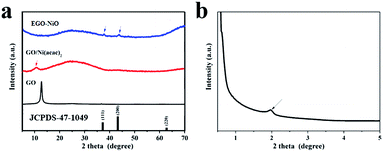 | ||
| Fig. 2 (a) XRD patterns of GO, GO/Ni(acac)2, and EGO–NiO, and (b) small-angle XRD pattern of EGO–NiO; JCPDS 47-1049 is the index pattern of NiO. | ||
We used AFM to examine the EGO–NiO composite more closely, and observed NiO nanoparticles decorated on the flakes of RGO (Fig. S2a†). The height of an RGO flake was estimated, from a cross-sectional contour of the flake, to be approximately 0.9 nm (Fig. S2b†), which is consistent with other reports for a single layer of graphene.35,36 The thickness of the NiO nanoparticles on the RGO surface was estimated, from the AFM images, to be around 4.2 nm and this result is consistent with the EGO–NiO interlayer estimated from the small-angle XRD pattern (Fig. 2b). Thus, the AFM results together with the XRD patterns of EGO–NiO suggest that the significantly expanded interlayer spacing is attributed to the presence of NiO nanoparticles between the graphene sheets decomposed from Ni(acac)2.
The XRD patterns of GO–solNiO and phGO–NiO are included in Fig. S3.† In Fig. S3a,† the diffraction peaks of the (111) and (200) planes of crystalline NiO are again observed in GO–solNiO and phGO–NiO. However, we did not observe any characteristic GO peak around 2θ = 12.6° in Fig. S3a,† nor any peak that could be attributed to the expansion of GO in the small angle XRD patterns (Fig. S3b†) of GO–solNiO and phGO–NiO. These XRD results suggest that the NiO was formed as a separate phase instead of between graphene layers in GO–solNiO and phGO–NiO, and highlight that precursor selection and pre-anchoring into graphene layers is critical to achieving the EGO–NiO structure.
The porous structure of sample EGO–NiO was characterized by nitrogen sorption analysis. As shown in Fig. S4,† sample EGO–NiO exhibits a type IV isotherm, which indicates the existence of abundant mesopores. The BET surface area is 128 m2 g−1.
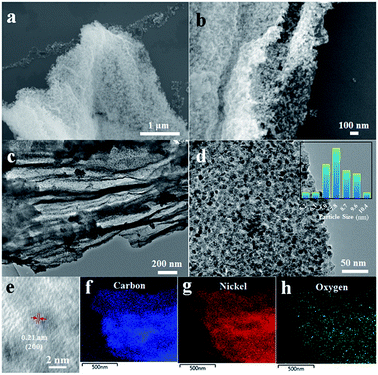
The SEM images of EGO–NiO in Fig. 3a and b show that the EGO–NiO retained the flake structure of GO, with dispersed NiO particles and layers of reduced GO visible in the images. The nanosized NiO particles and the RGO layers are also observed in the TEM image shown in Fig. 3c. The distribution of NiO particle sizes calculated from TEM images (Fig. 3d) shows that the average size of NiO particles was 7.8 nm, and we interpret this size as the width of nanoparticles parallel to the RGO sheet planes. The nanocrystal lattice of NiO was captured in the HRTEM image (Fig. 3e), which shows a well-defined crystalline lattice spacing of 0.21 nm, consistent with the (200) crystallographic plane of NiO. Fig. 3f and g show the carbon and nickel elemental maps, obtained from TEM-EDS respectively, which confirm the well-dispersed state of NiO nanoparticles in EGO–NiO.
The SEM images of GO–solNiO and phGO–NiO in Fig. S5a and c† show densely stacked GO flakes several microns thick, which is consistent with the XRD results which indicate that no obvious GO expansion occurs when the soluble nickel precursor is used or upon physical mixing of Ni(acac)2 with GO. Considering the obvious peaks of crystalline NiO observed for sample GO–solNiO, along with the nanoparticles observed in the SEM image shown in Fig. S5b,† it can be concluded that the NiO nanoparticles in sample GO–solNiO existed on the surface of GO flakes instead of being interspersed between graphene layers. We also observe in Fig. S5d† that NiO particles were formed on the external GO surfaces of phGO–NiO. Hence, we postulate that the key step in the preparation of EGO–NiO is the diffusion of Ni(acac)2 in a basic GO suspension, which facilitates π–π interactions between the aromatic acetylacetonate (acac) ligands and the graphitic layers of the sp2 carbon network. This concept has been demonstrated for other metal-acetylacetonate compounds with GO and graphene materials.28–30 However, for phGO–NiO, during vacuum heating, due to the lack of expansion of GO, the narrow interlayer space causes an obstruction, preventing Ni(acac)2 molecules from diffusing in. Consequently, Ni(acac)2 adsorbs on the external surfaces of GO and at high temperature sublimes to deposit NiO only on the external GO surfaces.
The nickel content of these three composite materials was analysed by EDS from SEM (Fig. S6†). Interestingly, the nickel content of EGO–NiO and GO–solNiO is 2.85 and 1.40 at% respectively, which are lower than that of phGO–NiO (8.8 at% Ni). This may possibly be due to the leaching of unbound Ni ions during the washing process.
The XPS survey spectra in Fig. 4a confirm the presence of carbon, oxygen, nickel species on the surface of EGO–NiO, and only carbon and oxygen species on GO. The C 1s XPS spectrum of GO (Fig. 4b) was deconvoluted into four components: C![[double bond, length as m-dash]](https://www.rsc.org/images/entities/char_e001.gif) C at a binding energy of 283.7 eV, C–C at 284.6 eV, a dominant C–O peak associated with epoxy and alkoxy groups at 286.6 eV, and a C
C at a binding energy of 283.7 eV, C–C at 284.6 eV, a dominant C–O peak associated with epoxy and alkoxy groups at 286.6 eV, and a C![[double bond, length as m-dash]](https://www.rsc.org/images/entities/char_e001.gif) O peak associated with carbonyl groups at 288.2 eV.37,38 In contrast, the dominant peak in the C 1s XPS spectrum of EGO–NiO (Fig. 4c) is the C–C peak, with a low intensity C–O peak and no observable C
O peak associated with carbonyl groups at 288.2 eV.37,38 In contrast, the dominant peak in the C 1s XPS spectrum of EGO–NiO (Fig. 4c) is the C–C peak, with a low intensity C–O peak and no observable C![[double bond, length as m-dash]](https://www.rsc.org/images/entities/char_e001.gif) O peak. This change observed for EGO–NiO indicates the reduction of oxygen species on the GO and a partial restoration of the conjugated sp2 graphene network after the vacuum-thermal treatment. The Ni 2p XPS spectrum of EGO–NiO in Fig. 4d exhibits two main peaks at binding energies of 871.5 eV assigned to Ni 2p1/2 and 853.7 eV assigned to Ni 2p3/2. We attribute the satellite peaks of Ni 2p1/2 at a binding energy of 880.8 eV and Ni 2p3/2 at 861.8 eV in Fig. 4d to Ni2+ in NiO.39–42 These XPS results confirm the reduction of GO and the formation of NiO after the vacuum heating process to prepare EGO–NiO.
O peak. This change observed for EGO–NiO indicates the reduction of oxygen species on the GO and a partial restoration of the conjugated sp2 graphene network after the vacuum-thermal treatment. The Ni 2p XPS spectrum of EGO–NiO in Fig. 4d exhibits two main peaks at binding energies of 871.5 eV assigned to Ni 2p1/2 and 853.7 eV assigned to Ni 2p3/2. We attribute the satellite peaks of Ni 2p1/2 at a binding energy of 880.8 eV and Ni 2p3/2 at 861.8 eV in Fig. 4d to Ni2+ in NiO.39–42 These XPS results confirm the reduction of GO and the formation of NiO after the vacuum heating process to prepare EGO–NiO.
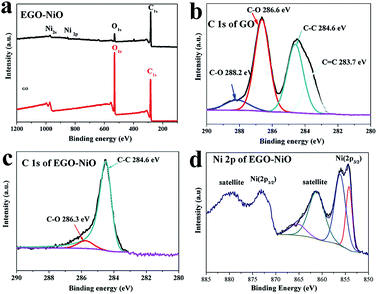 | ||
| Fig. 4 XPS survey spectra of GO and EGO–NiO (a), C 1s XPS spectrum of GO (b), C 1s XPS spectrum of EGO–NiO (c), and Ni 2p XPS spectrum of EGO–NiO (d). | ||
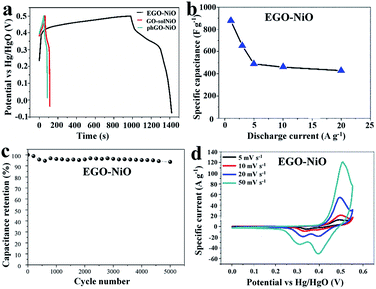
Fig. 5 summarises the electrocapacitive performance of EGO–NiO electrodes in GCD and CV tests performed in 6 mol L−1 KOH. The GCD profiles measured at a current density of 1 A g−1 in Fig. 5a show that the EGO–NiO electrode delivered a much longer discharge time than the GO–solNiO and phGO–NiO electrodes, and it follows that the EGO–NiO specific capacitance of 880 F g−1 calculated from the GCD discharge profile was significantly greater than the capacitances of GO–solNiO (182 F g−1) and phGO–NiO (165 F g−1). The capacitance of EGO–NiO was also much greater than the charge storage capacity of a GO electrode (Fig. S7†). Similar to literature reports, Fig. 5a indicates the loss of coulombic efficiency at low current density, which is possibly due to the slow electrochemical reaction at nanostructured metal oxide electrodes at lower current density.43 Furthermore, Fig. 5b shows that the electrochemical performance of EGO–NiO remained excellent at fast charge–discharge rates with a specific capacitance of 428 F g−1 at current densities up to 20 A g−1.
Fig. 5c demonstrates the stability of the EGO–NiO electrode over 5000 consecutive GCD cycles at a current density of 5 A g−1. After 5000 charge–discharge cycles, the EGO–NiO electrode retains 93.1% of its initial capacitance. Moreover, a capacitance retention of 80.1% can be achieved after 5000 cycles at a high current density of 20 A g−1 (Fig. S8†). The relatively quicker capacitance fade and shorter cycle life at higher current density may possibly be due to the severe structural change of electrode materials under fast charging–discharging.
Based on these results and the characterisation of the electrode materials, we attribute the outstanding performance (high capacitance and electrochemical stability against the electrolyte) of the EGO–NiO electrode to several factors, including the sufficient surface area accessible to electrolyte ions, removal of oxygen-containing groups thereby improving the conductivity, and the pseudocapacitance that NiO particles contribute to.44
The CV curves of EGO–NiO (Fig. 5d) exhibit redox peak-pairs with an anodic peak at around 0.48 V in the forward scan and a cathodic peak at around 0.35 V in the backward scan. These peaks correspond to NiO electrochemical reactions associated with the redox couple Ni2+/Ni3+:45,46
| NiO + OH− ↔ NiOOH + e− |
It is noted that two obvious cathodic peaks were observed with the increase of scan rates. They were caused by the transformation of NiOOH to α-Ni(OH)2 in the alkaline solution during the charging process and the instability of α-Ni(OH)2, which results in the formation of β-Ni(OH)2.47–49 Accordingly, the two oxidation reactions of Ni(OH)2 give two varieties of oxyhydroxide, β and γ NiOOH, which can explain the two reduction peaks observed during the backward scan in Fig. 5d.50
The Nyquist plot (ESI Fig. S7d†) produced from EIS measurements with the EGO–NiO electrode features a low x-axis intercept in the high frequency region indicating a low equivalent series resistance (ESR), and a negligible semicircle at medium frequencies, much smaller than that of the GO electrode (Fig. S7†). The diameter of the semicircle represents the charge transfer resistance (Rct). Furthermore, in the low-frequency region, the curve of EGO–NiO is close to a vertical straight line and this shape demonstrates that the resistance to the diffusion of ions in the electrode is small.51–53 These EIS results, that indicate fast electron and ion transport in the composite electrode, are consistent with the excellent capacitance retention of the EGO–NiO electrode at high current densities (Fig. 5b).
Fig. 6 compares the rate capability of EGO–NiO with those of some NiO–graphene composite electrode materials reported in the literature,54–58 and the same reference data are tabulated in Table S1.† The EGO–NiO electrode prepared in this work showed higher or comparable specific capacitance, rate capability, and cycling stability in comparison with other electrode materials. It can be seen that EGO–NiO has an excellent rate capability at high current densities up to 20 A g−1. In the EGO–NiO composite, the removal of oxygen-containing groups improves the electrical conductivity of the RGO network. RGO plays the role of a conductive support for the deposition of NiO nanoparticles. The good interfacial contact between NiO and RGO promotes the conductivity of the electrode, thus ensuring a good rate capability.
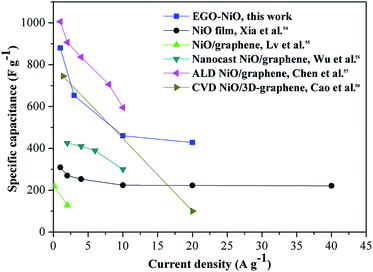 | ||
| Fig. 6 A comparison of the rate capability of the electrode material prepared in this work with those reported in the literature.54–58 | ||
4. Conclusions
In summary, this work demonstrates a simple approach to preparing graphene–NiO composite electrodes for supercapacitors. The selection of Ni(acac)2 as the nickel precursor is a key factor that allows NiO to be deposited between graphene layers. The sandwich structure combines EDL capacitance and pseudocapacitance from redox reactions of NiO. The improved specific surface area accessible to electrolyte ions benefiting from the expansion of GO and the improved electron conductivity resulting from the reduction of GO both enhance the electrochemical performance of EGO–NiO. The composite exhibited an excellent electrocapacitive behaviour in 6 M KOH electrolyte (880 F g−1 at 1 A g−1) and was stable during charge–discharge cycling (93.1% retention after 5000 cycles at 5 A g−1).Conflicts of interest
There are no conflicts to declare.Acknowledgements
This work was supported by the Australian Research Council under the Laureate Program (FL170100101) and the UQ Vice Chancellor's Research and Teaching Fellowship Project (2015000144). The authors thank the Australian Microscopy and Microanalysis Research Facility at the Centre for Microscopy and Microanalysis, The University of Queensland. Xiaoming Sun acknowledges the China Scholarship Council (CSC) and The University of Queensland for providing scholarships.References
- Y. Zhai, Y. Dou, D. Zhao, P. F. Fulvio, R. T. Mayes and S. Dai, Adv. Mater., 2011, 23, 4828–4850 CrossRef CAS PubMed.
- P. Simon and Y. Gogotsi, Nat. Mater., 2008, 7, 845–854 CrossRef CAS PubMed.
- L. L. Zhang and X. S. Zhao, Chem. Soc. Rev., 2009, 38, 2520–2531 RSC.
- G. Wang, L. Zhang and J. Zhang, Chem. Soc. Rev., 2012, 41, 797–828 RSC.
- L. L. Chen, Y. Liu, Y. Zhao, N. Chen and L. T. Qu, Nanotechnology, 2016, 27, 19 Search PubMed.
- H.-K. Kim, A. R. Kamali, K. C. Roh, K.-B. Kim and D. J. Fray, Energy Environ. Sci., 2016, 9, 2249–2256 CAS.
- X. Dong, N. Hu, L. Wei, Y. Su, H. Wei, L. Yao, X. Li and Y. Zhang, J. Mater. Chem. A, 2016, 4, 9739–9743 CAS.
- Y. Lin, X. Han, C. J. Campbell, J.-W. Kim, B. Zhao, W. Luo, J. Dai, L. Hu and J. W. Connell, Adv. Funct. Mater., 2015, 25, 2920–2927 CrossRef CAS.
- K. S. Novoselov, A. K. Geim, S. V. Morozov, D. Jiang, Y. Zhang, S. V. Dubonos, I. V. Grigorieva and A. A. Firsov, Science, 2004, 306, 666 CrossRef CAS PubMed.
- S. Stankovich, R. D. Piner, X. Chen, N. Wu, S. T. Nguyen and R. S. Ruoff, J. Mater. Chem., 2006, 16, 155 RSC.
- S. Stankovich, D. A. Dikin, R. D. Piner, K. A. Kohlhaas, A. Kleinhammes, Y. Jia, Y. Wu, S. T. Nguyen and R. S. Ruoff, Carbon, 2007, 45, 1558–1565 CrossRef CAS.
- M. J. McAllister, J.-L. Li, D. H. Adamson, H. C. Schniepp, A. A. Abdala, J. Liu, M. Herrera-Alonso, D. L. Milius, R. Car, R. K. Prud'homme and I. A. Aksay, Chem. Mater., 2007, 19, 4396–4404 CrossRef CAS.
- W. Chen, L. Yan and P. R. Bangal, Carbon, 2010, 48, 1146–1152 CrossRef CAS.
- Z.-S. Wu, W. Ren, L. Gao, B. Liu, C. Jiang and H.-M. Cheng, Carbon, 2009, 47, 493–499 CrossRef CAS.
- W. Lv, D.-M. Tang, Y.-B. He, C.-H. You, Z.-Q. Shi, X.-C. Chen, C.-M. Chen, P.-X. Hou, C. Liu and Q.-H. Yang, ACS Nano, 2009, 3, 3730–3736 CrossRef CAS PubMed.
- W. P. Sun, X. H. Rui, M. Ulaganathan, S. Madhavi and Q. Y. Yan, J. Power Sources, 2015, 295, 323–328 CrossRef CAS.
- X. Zhu, H. Dai, J. Hu, L. Ding and L. Jiang, J. Power Sources, 2012, 203, 243–249 CrossRef CAS.
- X. Ren, C. Guo, L. Xu, T. Li, L. Hou and Y. Wei, ACS Appl. Mater. Interfaces, 2015, 7, 19930–19940 CAS.
- X. Sun, P. Liu, Y. Gu, T. E. Rufford and X. S. Zhao, RSC Adv., 2016, 6, 44717–44722 RSC.
- M. Lin, B. Chen, X. Wu, J. Qian, L. Fei, W. Lu, L. W. H. Chan and J. Yuan, Nanoscale, 2016, 8, 1854–1860 RSC.
- J. Zhang and X. S. Zhao, Carbon, 2013, 52, 1–9 CrossRef CAS.
- Z. Y. Xia, D. Wei, E. Anitowska, V. Bellani, L. Ortolani, V. Morandi, M. Gazzano, A. Zanelli, S. Borini and V. Palermo, Carbon, 2015, 84, 254–262 CrossRef CAS.
- M. Li, F. Pan, E. S. G. Choo, Y. B. Lv, Y. Chen and J. M. Xue, ACS Appl. Mater. Interfaces, 2016, 8, 6972–6981 CAS.
- J. Zhang, J. Jiang and X. S. Zhao, J. Phys. Chem. C, 2011, 115, 6448–6454 CAS.
- K. Zhang, L. L. Zhang, X. S. Zhao and J. Wu, Chem. Mater., 2010, 22, 1392–1401 CrossRef CAS.
- L. L. Zhang, Z. G. Xiong and X. S. Zhao, J. Power Sources, 2013, 222, 326–332 CrossRef CAS.
- Z. Lei, N. Christov and X. S. Zhao, Energy Environ. Sci., 2011, 4, 1866–1873 CAS.
- B. Karasulu, R. H. J. Vervuurt, W. M. M. Kessels and A. A. Bol, Nanoscale, 2016, 8, 19829–19845 RSC.
- V. Singh, D. Joung, L. Zhai, S. Das, S. I. Khondaker and S. Seal, Prog. Mater. Sci., 2011, 56, 1178–1271 CrossRef CAS.
- P. Dong, Y. Wang, L. Guo, B. Liu, S. Xin, J. Zhang, Y. Shi, W. Zeng and S. Yin, Nanoscale, 2012, 4, 4641–4649 RSC.
- W. S. Seo, H. H. Jo, K. Lee, B. Kim, S. J. Oh and J. T. Park, Angew. Chem., Int. Ed., 2004, 43, 1115–1117 CrossRef CAS PubMed.
- W. S. Seo, H. H. Jo, K. Lee and J. T. Park, Adv. Mater., 2003, 15, 795–797 CrossRef CAS.
- Y. Gu, H. Wu, Z. G. Xiong, W. Al Abdulla and X. S. Zhao, J. Mater. Chem. A, 2014, 2, 451–459 CAS.
- I.-Y. Jeon, H.-J. Choi, S.-Y. Bae, D. W. Chang and J.-B. Baek, J. Mater. Chem., 2011, 21, 7820–7826 RSC.
- I. K. Moon, J. Lee, R. S. Ruoff and H. Lee, Nat. Commun., 2010, 1, 73 Search PubMed.
- Y. Zhang, L. Liu, N. Xi, Y. Wang, Z. Dong and U. C. Wejinya, J. Appl. Phys., 2011, 110, 114515 CrossRef.
- Y. Zhang, X. Yuan, Y. Wang and Y. Chen, J. Mater. Chem., 2012, 22, 7245–7251 RSC.
- S. Park, J. An, J. R. Potts, A. Velamakanni, S. Murali and R. S. Ruoff, Carbon, 2011, 49, 3019–3023 CrossRef CAS.
- J. Yan, Z. Fan, W. Sun, G. Ning, T. Wei, Q. Zhang, R. Zhang, L. Zhi and F. Wei, Adv. Funct. Mater., 2012, 22, 2632–2641 CrossRef CAS.
- L. Jiang, R. Zou, W. Li, J. Sun, X. Hu, Y. Xue, G. He and J. Hu, J. Mater. Chem. A, 2013, 1, 478–481 CAS.
- S. Min, C. Zhao, Z. Zhang, K. Wang, G. Chen, X. Qian and Z. Guo, RSC Adv., 2015, 5, 62571–62576 RSC.
- L. T. Hoa, H. N. Tien, V. H. Luan, J. S. Chung and S. H. Hur, Sens. Actuators, B, 2013, 185, 701–705 CrossRef CAS.
- G. S. Gund, D. P. Dubal, N. R. Chodankar, J. Y. Cho, P. Gomez-Romero, C. Park and C. D. Lokhande, Sci. Rep., 2015, 5, 12454–12466 CrossRef PubMed.
- L. L. Zhang, Z. Xiong and X. S. Zhao, J. Power Sources, 2013, 222, 326–332 CrossRef CAS.
- X. Xia, Y. Zhang, D. Chao, C. Guan, Y. Zhang, L. Li, X. Ge, I. M. Bacho, J. Tu and H. J. Fan, Nanoscale, 2014, 6, 5008–5048 RSC.
- B. Vidhyadharan, N. K. M. Zain, I. I. Misnon, R. A. Aziz, J. Ismail, M. M. Yusoff and R. Jose, J. Alloys Compd., 2014, 610, 143–150 CrossRef CAS.
- H. Zhou, B. Lv, Y. Xu and D. Wu, Mater. Res. Bull., 2014, 50, 399–404 CrossRef CAS.
- Q. Yi, J. Zhang, W. Huang and X. Liu, Catal. Commun., 2007, 8, 1017–1022 CrossRef CAS.
- H. Bode, K. Dehmelt and J. Witte, Electrochim. Acta, 1966, 11, 1079–1087 CrossRef CAS.
- P. Oliva, J. Leonardi, J. F. Laurent, C. Delmas, J. J. Braconnier, M. Figlarz, F. Fievet and A. d. Guibert, J. Power Sources, 1982, 8, 229–255 CrossRef CAS.
- L. L. Zhang, R. Zhou and X. S. Zhao, J. Mater. Chem., 2010, 20, 5983–5992 RSC.
- Y. Liu, D. Yan, R. Zhuo, S. Li, Z. Wu, J. Wang, P. Ren, P. Yan and Z. Geng, J. Power Sources, 2013, 242, 78–85 CrossRef CAS.
- Y. Wang, Z. Shi, Y. Huang, Y. Ma, C. Wang, M. Chen and Y. Chen, J. Phys. Chem. C, 2009, 113, 13103–13107 CAS.
- X.-h. Xia, J.-p. Tu, X.-l. Wang, C.-d. Gu and X.-b. Zhao, J. Mater. Chem., 2011, 21, 671–679 RSC.
- W. Lv, F. Sun, D.-M. Tang, H.-T. Fang, C. Liu, Q.-H. Yang and H.-M. Cheng, J. Mater. Chem., 2011, 21, 9014–9019 RSC.
- C. H. Wu, S. X. Deng, H. Wang, Y. X. Sun, J. B. Liu and H. Yan, ACS Appl. Mater. Interfaces, 2014, 6, 1106–1112 CAS.
- C. Chen, C. Chen, P. Huang, F. Duan, S. Zhao, P. Li, J. Fan, W. Song and Y. Qin, Nanotechnology, 2014, 25, 504001 CrossRef PubMed.
- X. Cao, Y. Shi, W. Shi, G. Lu, X. Huang, Q. Yan, Q. Zhang and H. Zhang, Small, 2011, 7, 3163–3168 CrossRef CAS PubMed.
Footnote |
| † Electronic supplementary information (ESI) available. See DOI: 10.1039/c7se00420f |
| This journal is © The Royal Society of Chemistry 2018 |

