A hybrid catalyst of Pt/CoNiO2 on carbon nanotubes and its synergetic effect towards remarkable ethanol electro-oxidation in alkaline media†
Received
10th August 2017
, Accepted 24th October 2017
First published on 25th October 2017
Abstract
Herein, a hybrid catalyst of Pt/CoNiO2 on carbon nanotubes (Pt/CoNiO2–CNTs) has been successfully synthesized by a facile and cost-effective method, and its crystal structures, chemical valence states, and morphologies have been characterized in detail. CO stripping voltammograms reveal that the adsorbed COads on the active sites of the Pt/CoNiO2–CNT catalyst is easily oxidized at a lower potential (−0.60 V) as compared to the Pt particles on rGO (−0.35 V) and acid-treated CNTs (−0.36 V). Cyclic voltammograms demonstrate that the designed Pt/CoNiO2–CNT catalyst possesses an ultrahigh electrocatalytic activity (1136.2 mA mgPt−1) for ethanol oxidation, which is 5.1 and 3.0 times higher than that of Pt/rGO (221.6 mA mgPt−1) and Pt/CNTs (375.4 mA mgPt−1), respectively. The Tafel plot of Pt/CoNiO2–CNTs is 205 mV dec−1, indicating much faster reaction kinetics than that of the compared catalysts. In addition, the outstanding long-term stability indicates that the designed Pt/CoNiO2–CNT catalyst exhibits expected application prospects in direct alkaline ethanol fuel cells. Moreover, the catalytic mechanism of the hybrid Pt/CoNiO2–CNTs has been proposed and discussed via C2 and C1 pathways with respect to the final products for CH3COO− and CO32−, respectively.
Introduction
With the increasing global warming and pollution, more countries and organizations are paying more explicit attention to sustainable energy development.1,2 Low-carbon innovation and renewable energy technologies, such as fuel cells, solar cells etc.,3 have aroused widespread interest in the past few decades; among these, efficient fuel cell devices can directly convert chemical energy into electricity with almost no pollution except for some CO2 gas.4,5 Especially, direct alcohol fuel cells have attracted significant attention due to their unique advantages such as fertile source materials, being lightweight, and easy operations.6,7 Because of their much quicker fuel oxidation and oxygen reduction kinetics, direct alkaline fuel cells (DAFC) have been developed as one of the most sophisticated fuel cells as compared to the acid fuel cells at low temperatures.8–12 Moreover, the easy-poisoning nature of Pt-based catalysts in an acidic solution is another driving force that promotes the development of alkaline fuel cells.13–16
Recently, oxygen reduction reactions in an alkaline solution have been rapidly developed, and outstanding progress has been made in the aspects of mechanistic study and catalytic performance.17–19 However, most of the designed alkaline anode catalysts, including Pt-based anode catalysts, are kinetically sluggish and do not satisfy the requirements for practical applications.20–23 Spendelow and Wieckowski have reviewed various Pt-based catalysts in alkaline media over the past few decades and uncovered that noble metal loading, particle size distribution, and CO poisoning of Pt are the most important barriers inhibiting the development of these catalysts.24 Therefore, it is urgent to develop effective strategies to improve the activity and durability of Pt-based catalysts in alkaline alcohol fuel cells.
Previous studies have revealed that transition metal oxides can resist alkaline corrosion and help to improve their ability of anti-CO poisoning in fuel cells.25–27 Among them, spinel nickel cobaltite (CoNiO2), which has a relatively low price and exhibits environmentally friendly features, has attracted significant attention.28,29 Some studies have shown that the earth-abundant CoNiO2 possesses excellent electrochemical properties and exhibits a much higher electrical conductivity than cobalt oxides or nickel oxides alone.30 In addition, CoNiO2, as a highly active catalyst, has been extensively explored in the water splitting reaction in alkaline media over the past few years.31–33 However, applications of CoNiO2 in direct alkaline ethanol fuel cells are quite rare; thus, the study of CoNiO2-based hybrid materials as an efficient anode catalyst is still highly significant.
In this study, we have successfully synthesized the Pt/CoNiO2–CNT hybrid material, in which the Pt particles are uniformly dispersed on the surface of a CoNiO2–CNT support by a facile reduction method. The as-synthesized Pt/CoNiO2–CNT hybrid catalyst exhibits much higher catalytic activity and long-term stability than Pt/rGO and Pt/CNT catalysts for ethanol electro-oxidation in alkaline media. Moreover, the obtained Pt-based hybrid catalyst exhibits superior anti-CO poisoning ability.
Experimental
Materials
All chemical reagents used in this experiment were of analytical grade. Ni(NO3)2·6H2O, Co(NO3)2·6H2O, H2PtCl6, NH4F, NaBH4, H2SO4, HNO3, ethanol, Nafion, and cetyltrimethylammonium bromide (CTAB, Alfa Aesar) were procured commercially and used as received without further purification. The CNTs with a diameter of 40–60 nm, lengths of 5–15 mm, and a purity of 98% used in this study were purchased from Shenzhen Nanotechnologies Port Co. Ltd. (Shenzhen, China).
Preparation of CNTs and CoNiO2–CNTs
The commercial CNTs were initially treated by a typical hydrothermal method.34 Raw-CNT powders were dispersed in a H2SO4–HNO3 solution (8.0 M for each acid) at a bath temperature of 80 °C and then treated for 2 h under hydrothermal condition. The product was washed with deionized water and dried in a vacuum oven at 70 °C for 12 h for further use.
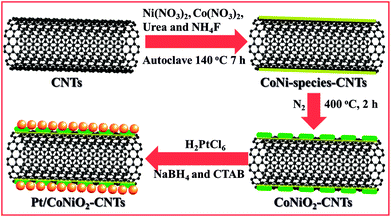
The CoNiO2–CNT hybrid composites were obtained through a hydrothermal process and a subsequent high-temperature calcination, in which 50 mg acid-treated CNTs, 0.29 g Ni(NO3)2·6H2O, 0.58 g Co(NO3)2·6H2O, 0.90 g urea, and 0.22 g NH4F were one-step dissolved in 90 mL deionized water and then ultrasonicated for 60 min. The as-obtained suspension was then transferred into a Teflon-lined stainless-steel autoclave (lower than the total volume of 2/3) and hydrothermally treated at 140 °C for 7 h. After being cooled down to room temperature, the resulting products were filtered and washed with abundant deionized water and ethanol to remove the residues. The cleaned products were put in a vacuum oven for 12 h at 70 °C. After this, the dried samples were placed in a N2-protected furnace, and the temperature was slowly increased to 400 °C and maintained for another 2 h. The yielded products were denoted as CoNiO2/CNT hybrid composites.
Preparation of the Pt/CoNiO2–CNT catalysts
The Pt/CoNiO2–CNT hybrid catalyst was obtained through an impregnation method using NaBH4 and CTAB as reducing and protectant agents, respectively; herein, the theoretical loading of Pt on the CoNiO2–CNT surface was fixed at 20 wt%. Typically, 50 mg of CoNiO2/CNTs and 3.3 mL of 18.96 mM H2PtCl6 were initially added to a 60 mL mixture solution of ethanol/water (1![[thin space (1/6-em)]](https://www.rsc.org/images/entities/char_2009.gif) :1, v/v ratio). After vigorous stirring for 0.5 h, 20 mL freshly prepared reducing solution (40 mg NaBH4 and 15 mg CTAB) was slowly added dropwise to the abovementioned mixture solution under vigorous stirring condition. The resulted solution was continuously stirred for another 24 h and then washed with excess deionized water. The received solid composites were dried in a vacuum oven at 80 °C for 5 h and denoted as Pt/CoNiO2–CNTs (Scheme 1). For better comparison, the Pt particles on acid-treated CNTs and rGO (20 wt% Pt) were also prepared using a similar experimental method, in which rGO was synthesized via a modified Hummers method.35
:1, v/v ratio). After vigorous stirring for 0.5 h, 20 mL freshly prepared reducing solution (40 mg NaBH4 and 15 mg CTAB) was slowly added dropwise to the abovementioned mixture solution under vigorous stirring condition. The resulted solution was continuously stirred for another 24 h and then washed with excess deionized water. The received solid composites were dried in a vacuum oven at 80 °C for 5 h and denoted as Pt/CoNiO2–CNTs (Scheme 1). For better comparison, the Pt particles on acid-treated CNTs and rGO (20 wt% Pt) were also prepared using a similar experimental method, in which rGO was synthesized via a modified Hummers method.35
 |
| | Scheme 1 Schematic of the preparation process of the Pt/CoNiO2–CNT composite. | |
Spectroscopic characterizations
The structures, components, and morphologies of the samples were characterized by scanning electron microscopy (SEM, FEI Quanta 200 FEG, Holland), transmission electron microscopy (TEM, JEM-2100F, Japan), high-resolution transmission electron microscopy (HRTEM), energy-dispersive X-ray spectroscopy (EDS, FEI Quanta 200 FEG, Holland), X-ray diffraction (XRD, Rigaku D/MAX 2500v/pc (Japan) diffractometer with Cu Kα radiation), energy-dispersive spectroscopy (EDX, FEI Quanta 200 FEG, Holland), Raman spectroscopy, and X-ray photoelectron spectroscopy (XPS, JPS-9010TR (Japan) with Mg Kα radiation). Inductively coupled plasma analysis (ICP, IRIS Intrepid II XSP) was used to determine the real metal loading of the as-prepared catalyst.
Electrochemical measurements
A general three-electrode system was used to examine all the electrochemical data via a CHI 660C electrochemical working station at room temperature. A glassy carbon electrode, Pt foil, and saturated calomel electrode (SCE) were used as the working, counter, and reference electrodes, respectively. The glassy carbon electrode was first polished by Al2O3 powder and then subsequently cleaned in ethanol and water. The working electrodes were prepared as follows: 2.0 mg catalyst was dispersed in 400 μL H2O/C2H5OH (v/v = 1:1) and ultrasonicated for 5 min to form a uniform catalyst ink. Then, 5 μL of catalyst ink was pipetted onto the glassy carbon electrode surface (ϕ = 3 mm); after drying, 5 μL diluted Nafion (0.5 wt%) was dropped onto the catalyst to avoid exfoliation. The Pt loading content on the working electrode is ca. 70.8 μg cm−2.
CO-stripping cyclic voltammetry (CV) was used to evaluate the electrochemical active surface area (EAS) of different catalysts in a 1.0 M KOH solution. First, CO was purged into a 1.0 M KOH solution, then a constant potential of −0.3 V (vs. SCE) was set, and the system was continuously run for 45 min, during which the CO gas was uninterruptedly bubbled into the solution in the initial 30 min, and then, N2 gas was bubbled into the solution for 15 min to remove the dissolved CO gas. After this, typical CV curves with continuous two cycles were obtained in the solution in the range from −0.8 V to 0.3 V at a scan rate of 50 mV s−1. The ethanol electrochemical oxidation was investigated in a N2-saturated 1.0 M KOH + 0.5 M CH3CH2OH solution at a scan rate of 50 mV s−1 for all the CV cycles. The long-term stability was determined at a positive potential of 0.3 V for 3600 s. All the electrochemical tests were carried out at ambient temperature (25 ± 1 °C).
Results and discussion
Schematic synthesis of Pt/CoNiO2–CNTs
The preparation process for the Pt/CoNiO2–CNT catalyst is shown in Scheme 1. The acid-treated CNTs were initially mixed with Ni(NO3)2, Co(NO3)2, urea, and NH4F in deionized water via violent ultrasonic treatment for one hour. The resulting solution was transferred into an autoclave and heated to 140 °C for seven hours. After treatment, the Co–Ni hydroxide species were homogeneously distributed on the surface of the acid-treated CNTs. After calcination at 400 °C for two hours, the porous Co–Ni oxide species was formed on the CNT surface. After this, the added PtCl62− ions strongly adsorbed onto the surface of Co–Ni oxides/CNTs via electrostatic interaction force. After the mixture solution of NaBH4 and CTAB was added, the precursor PtCl62− ions slowly reduced to Pt seed crystals in the initial stage. Through interaction with the induced CTAB, the Pt crystal formed a special structure in the subsequent crystal growth process. After twenty-four hours, the surfactant and various impurities were removed, and the targeted catalyst was received. The real Pt metal loading on the CoNiO2–CNT support was detected by the inductively coupled plasma (ICP) method. The testing results show that the percentage of Pt is 21.3% on the Pt/CoNiO2–CNT hybrid catalyst, which is consistent with the theoretical results.
XRD patterns and Raman spectrum analysis
The as-prepared composites were initially evaluated by X-ray diffraction (XRD). As shown in Fig. 1A, the XRD pattern shows that the main peaks of the prepared samples are consistent with the standard patterns of CoNiO2 (JCPDS: 10-0188). In addition, some small messy peaks are detected, which can be ascribed to the doped CoOOH species.36 After inducing Pt particles, the XRD patterns (Fig. 1A) show that all samples exhibit five main peaks located at 39.8, 46.2, 67.5, 81.3, and 85.7°, which belong to the face centered cubic structures of metal Pt (111), (200), (220), (311), and (222), respectively (JCPDS: 04-0802).37 It should be noted that a typical peak located at ∼26° is derived from the diffraction pattern of the carbon (002) plane.38 Compared with that of Pt/rGO and Pt/CNTs, the intensity of the peak for Pt/CoNiO2–CNT hybrid material is weaker, and the widths of the peaks are much broader; this indicates that the particles of Pt on CoNiO2–CNTs are much smaller than others. In addition, an apparent peak shift could be observed for Pt (220) on Pt/CoNiO2–CNTs in comparison with the case of other two catalysts; this indicated that some Pt alloy might coexist in the synthesized composite. Generally, the Scherrer equation is used to calculate the size of the Pt particles. The average particle size of the Pt particles is estimated by the following equation:39| | | D = Kλ/βcosθ | (1) |
where D (nm) is the calculated average diameter of the Pt particles, λ is the used wavelength of X-ray (0.154056 nm for Cu Kα), K is the Scherrer constant (0.89), θ is the Bragg diffraction angle, and β is the half height width of the peak in radians. The average particle size of different catalysts was calculated to be 3.3, 4.1, and 5.7 nm for the Pt particles on CoNiO2–CNT, rGO, and CNT supports, respectively. The smallest particle size indicates that the CoNiO2–CNT support is beneficial to minimize the particle distribution, which may be due to the much stronger interaction between Pt particles and CoNiO2.
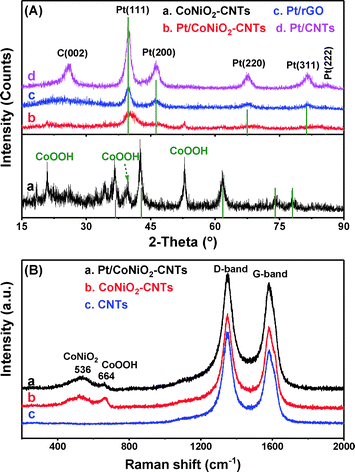 |
| | Fig. 1 (A) XRD patterns of (a) CoNiO2–CNTs, (b) Pt/CoNiO2–CNTs, (c) Pt/rGO and (d) Pt/CNTs. (B) Raman spectrum of (a) Pt/CoNiO2–CNTs, (b) CoNiO2–CNTs, and (c) CNTs. | |
Raman spectra are further used to characterize the modification process and detect related scattering peaks. As shown in Fig. 1B, all the materials exhibit two obvious characteristic peaks located at ∼1348 and ∼1583 cm−1, which correspond to the D-band and G-band, respectively. Generally, the D-band is contributed from the vibrations of sp3 carbon atoms with disordered structures, and the G-band originates from the domains of graphite with sp2 carbon atom vibrations in the composite structures.35 Specially, Pt/CoNiO2–CNTs and CoNiO2–CNTs show two additional peaks at ∼536 and ∼664 cm−1, which are considered to have originated from the scattering peaks of CoNiO2 and CoOOH, respectively.40,41 The results further demonstrate that CoNiO2 is clearly modified on acid-treated CNTs.
Morphology characterization and XPS analysis
The morphologies, elements, and particle size distributions of Pt/CoNiO2–CNTs are characterized by TEM images and EDS mapping. As shown in Fig. 2a, the TEM images of Pt/CoNiO2–CNTs show that the particles of Pt are well-dispersed on the CoNiO2 modified acid-treated CNT surface. The particle size distribution of Pt (see Fig. 2b and S1†) obtained from randomly selected 100 particles shows that the average particle size is ∼3.1 nm, which is consistent with the calculated XRD results. The high-resolution TEM image (see Fig. 2c) exhibits three different types of fringe spacings at about 0.34, 0.241, and 0.224 nm corresponding to CNTs (002), CoNiO2 (111), and Pt (111) interplanar distances, respectively. The EDS spectra of Pt/CoNiO2–CNTs (see Fig. S2†) shows that the elements C, O, Co, Ni, and Pt are clearly exhibited in the target composite. Additionally, as shown in Fig. 2d–g, the elements Pt, Co, Ni, and O are consistently distributed throughout the composite; this further indicates that the Pt particles are well-dispersed on the targeted CoNiO2–CNT hybrid material.
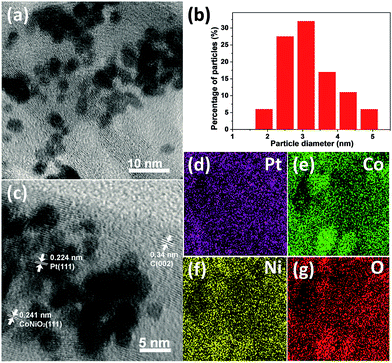 |
| | Fig. 2 (a) TEM image and (b) particle size distribution of Pt/CoNiO2–CNTs; (c) High-resolution TEM image of Pt/CoNiO2–CNTs; EDS mapping of (d) Pt, (e) Co, (f) Ni, and (g) O for Pt/CoNiO2–CNTs. | |
The XPS technique provides information on the composition of the catalyst and the corresponding chemical valence states of the designated composites. The entire XPS spectrum is initially corrected by the high-resolution C 1s spectrum. As shown in Fig. 3a, the C 1s spectrum is mainly deconvoluted into three peaks: 284.0 eV (sp2 C![[double bond, length as m-dash]](https://www.rsc.org/images/entities/char_e001.gif) C), 284.8 eV (sp3 C–C), and ∼286.0 eV (C–O). The full-range XPS spectrum of the as-prepared Pt/CoNiO2–CNTs (see Fig. S3†) shows that the material is composed of C, O, Pt, Ni, and Co. As shown in Fig. 3b, the high-resolution Pt 4f peaks can be deconvoluted into three pairs of peaks for Pt 4f7/2 (70.8, 71.4, and 72.8 eV) and Pt 4f5/2 (74.1, 74.8, and 76.1 eV), in which the binding energies at 70.8 and 74.1 eV are related to metal Pt0, the binding energies at 71.4 and 74.8 eV are ascribed to Pt2+ from PtO or Pt(OH)2, and the binding energies located at 72.8 and 76.1 eV are attributed to PtO2.38,42 As shown in Fig. 3c, the high-resolution Co 2p with Co 2p3/2 and Co 2p1/2 peaks in the Pt/CoNiO2–CNT composite is observed, in which the binding energies for metal Co0 are located at 778.0 and 797.7 eV, indicating that partial PtCo alloys are formed.43 The binding energies of the Co2+ species are located at 783.4 and 801.0 eV, and those of the Co3+ species are located at 781.4 and 799.3 eV, respectively.43 It should be noted that there are two other pairs of peaks at higher binding energies, which can be considered as satellite peaks from cobalt (hydro)oxide. The high-resolution Ni 2p of Pt/CoNiO2–CNTs is shown in Fig. 3d, in which the two relatively high spike peaks at 856.6 and 874.2 eV are ascribed to the Ni2+ oxidation state of Ni 2p3/2 and Ni 2p1/2, respectively.34 The other two peaks observed at 859.1 and 877.1 eV are ascribed to Ni 2p3/2 and Ni 2p1/2 of Ni3+, respectively.44 It is noteworthy that a pair of peaks at high binding energies can be clearly observed, which is derived from the shakeup satellite peaks of nickel (hydro)oxide.
C), 284.8 eV (sp3 C–C), and ∼286.0 eV (C–O). The full-range XPS spectrum of the as-prepared Pt/CoNiO2–CNTs (see Fig. S3†) shows that the material is composed of C, O, Pt, Ni, and Co. As shown in Fig. 3b, the high-resolution Pt 4f peaks can be deconvoluted into three pairs of peaks for Pt 4f7/2 (70.8, 71.4, and 72.8 eV) and Pt 4f5/2 (74.1, 74.8, and 76.1 eV), in which the binding energies at 70.8 and 74.1 eV are related to metal Pt0, the binding energies at 71.4 and 74.8 eV are ascribed to Pt2+ from PtO or Pt(OH)2, and the binding energies located at 72.8 and 76.1 eV are attributed to PtO2.38,42 As shown in Fig. 3c, the high-resolution Co 2p with Co 2p3/2 and Co 2p1/2 peaks in the Pt/CoNiO2–CNT composite is observed, in which the binding energies for metal Co0 are located at 778.0 and 797.7 eV, indicating that partial PtCo alloys are formed.43 The binding energies of the Co2+ species are located at 783.4 and 801.0 eV, and those of the Co3+ species are located at 781.4 and 799.3 eV, respectively.43 It should be noted that there are two other pairs of peaks at higher binding energies, which can be considered as satellite peaks from cobalt (hydro)oxide. The high-resolution Ni 2p of Pt/CoNiO2–CNTs is shown in Fig. 3d, in which the two relatively high spike peaks at 856.6 and 874.2 eV are ascribed to the Ni2+ oxidation state of Ni 2p3/2 and Ni 2p1/2, respectively.34 The other two peaks observed at 859.1 and 877.1 eV are ascribed to Ni 2p3/2 and Ni 2p1/2 of Ni3+, respectively.44 It is noteworthy that a pair of peaks at high binding energies can be clearly observed, which is derived from the shakeup satellite peaks of nickel (hydro)oxide.
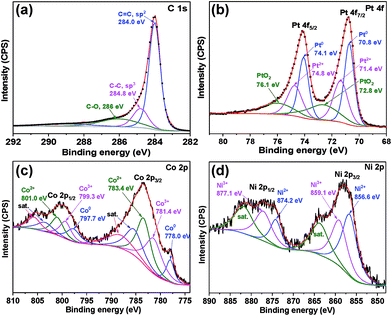 |
| | Fig. 3 High-resolution XPS spectrum of (a) C 1s, (b) Pt 4f, (c) Co 2p, and (d) Ni 2p for Pt/CoNiO2–CNTs. | |
Electrochemical performance analysis
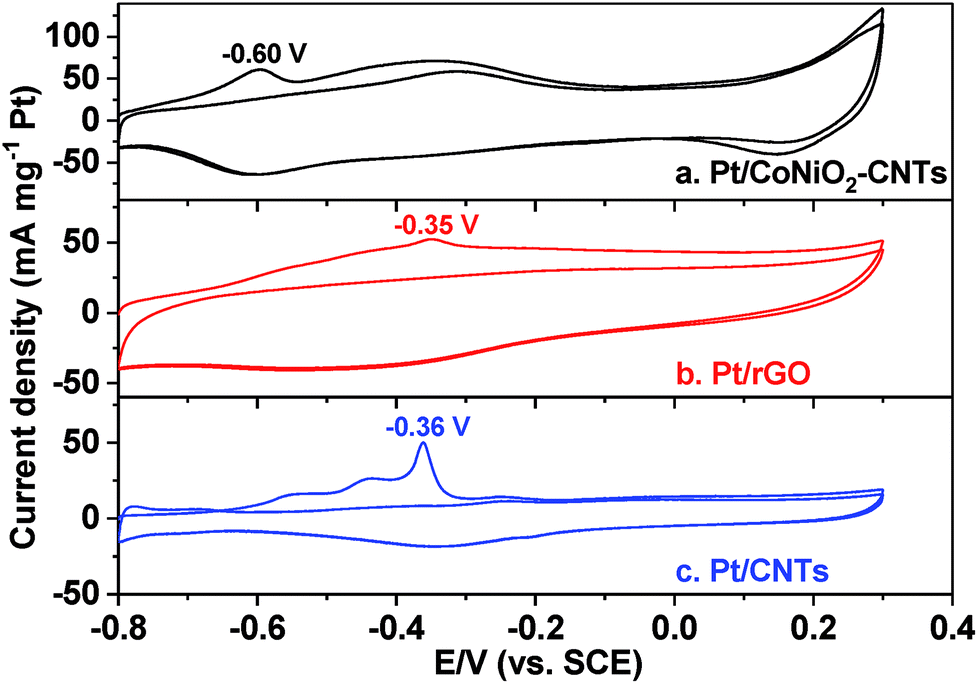
CO-stripping voltammetry is an effective method to elevate the removal ability of intermediates (especially COads), but can also be used to calculate the EAS values of target catalysts in the electrocatalytic process. As shown in Fig. 4, the CO-stripping voltammograms of Pt/CoNiO2–CNT, Pt/rGO, and Pt/CNT catalysts were obtained in a 1.0 M KOH solution at a scan rate of 50 mV s−1. It can be seen that the hydrogen (H) adsorption/desorption peaks are completely suppressed in the range from −0.6 to −0.8 V due to CO covered on the surface of the catalysts. In the first cycle, the adsorbed COads molecules will be oxidized in the forward scan and then, will almost disappear in subsequent cycles; this indicates that the adsorbed COads molecules are thoroughly removed in the first cycle. The lower peak potential indicates a stronger ability of the catalyst to remove the intermediate products. As seen from Fig. 4, the forward peak potentials are located at about −0.60 V, −0.35 V, and −0.36 V for the electro-oxidation of the adsorbed COads molecules on Pt/CoNiO2–CNT, Pt/rGO, and Pt/CNT catalysts, respectively; this reveals that the designed Pt/CoNiO2–CNT catalyst is more beneficial for the removal of the intermediates in the electro-oxidation process. In addition, the EAS values of different catalysts could be calculated by the integral oxidation peaks of the adsorbed COads molecules, and a charge to metal area conversion factor of 420 μC cm−2 was adopted for Pt-based electrocatalysts.45| |  | (2) |
where QCO (μC) is the oxidative charge for removal of the adsorbed COads molecules on the catalyst surface. The calculated EAS values are 66.4, 46.9, and 18.8 m2 g−1 for Pt/CoNiO2–CNTs, Pt/rGO, and Pt/CNTs, respectively. The largest EAS value of the Pt/CoNiO2–CNT catalyst is due to the smallest particle size and good dispersion of Pt particles on the CoNiO2-modified CNT substrate.
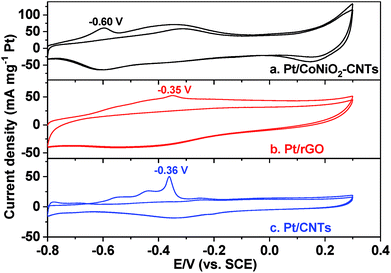 |
| | Fig. 4 CO-stripping voltammetric curves of (a) Pt/CoNiO2–CNTs, (b) Pt/rGO, and (c) Pt/CNTs in CO-saturated 1.0 M KOH with continuous two cycles at a scan rate of 50 mV s−1. | |
The typical CV curves of different catalysts for ethanol electro-oxidation were comprehensively investigated in a 1.0 M KOH solution containing 0.5 M ethanol. As shown in Fig. 5A, all the catalysts show the typical CV curves of Pt-based catalysts for ethanol electro-oxidation in an alkaline solution, in which the forward peak current densities are mainly contributed by the completely oxidized products of CO2 (existing in the form of CO32− ions) and some incomplete oxidized intermediate products (such as COads, CH3COads, etc.), and the backward peak current densities are mainly due to the continuous oxidation of the intermediate products into CO2.46 It can be seen that the Pt/CoNiO2–CNT catalyst exhibits a remarkably enhanced current density (1136.2 mA mgPt−1) in the forward scan as compared to Pt/rGO (221.6 mA mgPt−1), Pt/CNT (375.4 mA mgPt−1), and commercial Pt/C (176.4 mA mgPt−1) catalyst, and the significantly improved catalytic performance can be ascribed to the synergistic effect of well-dispersed Pt particles and the CoNiO2–CNT substrate. It should be specially noted that CoNiO2–CNTs as a sole catalyst has almost no catalytic performance for ethanol electro-oxidation (see Fig. S4†). In addition, the anti-poisoning ability of the catalyst can be expressed as the ratio of the forward peak current density (jf) to the backward peak current density (jb). Fig. 5A shows that the ratio (jf/jb) of Pt/CoNiO2–CNTs is 1.22, which is apparently higher than that of the commercial Pt/C (1.09); this indicates a better anti-poisoning ability. To better highlight the excellent catalytic activity of our catalyst, we have further compared it with the catalysts reported in literature, as shown in Table S1.† The results show that the catalytic performance and anti-poisoning ability of our developed hybrid catalyst are better than those of most of ever reported Pt-based catalysts for ethanol electro-oxidation in an alkaline solution. More importantly, as shown in Fig. 5B, the Tafel slope of Pt/CoNiO2–CNTs is 205 mV dec−1 (similar to that of the commercial Pt/C), which is lower than that of Pt/rGO (422 mV dec−1) and Pt/CNTs (218 mV dec−1), showing much faster reaction kinetics.47
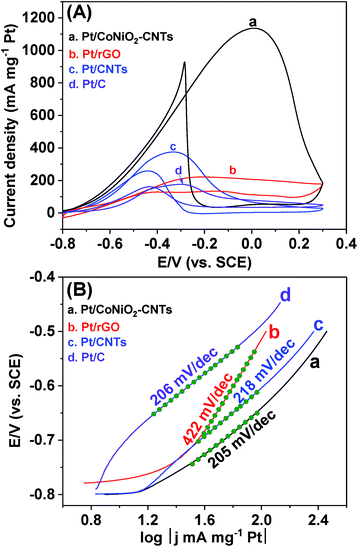 |
| | Fig. 5 (A) CV curves and (B) corresponding Tafel plots of (a) Pt/CoNiO2–CNTs, (b) Pt/rGO, (c) Pt/CNTs and (d) Pt/C in a 1.0 M KOH + 0.5 M CH3CH2OH solution at a scan rate of 50 mV s−1. | |
Apart from the electrocatalytic activity, long-term stability is another significant criterion to evaluate the usefulness of a catalyst. As shown in Fig. 6, time-dependent current densities are investigated in a solution of 1.0 M KOH + 0.5 M ethanol for 3600 s at a fixed potential of −0.3 V. It can be seen that all catalysts have relatively high initial current densities, which then suffer a rapid recession stage until they reach relatively steady states. The higher initial current densities result from higher ethanol concentrations, and the sharp decay is due to the decrease in the ethanol concentration gradient and the poisoning of the accumulated intermediate species. It is worth noting that the current density of Pt/CoNiO2–CNTs is significantly higher than that of the Pt/rGO and Pt/CNT catalysts in the whole process, and the final current density of Pt/CoNiO2–CNTs (37.7 mg cm−1 Pt) is 55.4- and 2.2-fold higher than that of Pt/rGO and Pt/CNTs, respectively.
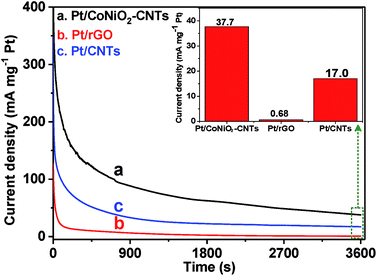 |
| | Fig. 6 Long-term stability of (a) Pt/CoNiO2–CNTs, (b) Pt/rGO, and (c) Pt/CNTs in a 1.0 M KOH + 0.5 M CH3CH2OH solution for continuous 3600 s. | |
Mechanism discussion
The excellent electrochemical activity and long-term stability of Pt/CoNiO2–CNTs for ethanol electro-oxidation could be ascribed to the synergistic effect of the well-dispersed small Pt particles and the CoNiO2-modified CNT substrate. As shown in Scheme 2, the specific synergistic catalytic process can be understood, and the different steps can be deduced as follows:5,48| | | CH3CH2OH → CH3CH2OHads | (4) |
| | | CH3CH2OHads + 3OHads → CH3COads + 3H2O + 3e− | (5) |
| | | CH3COads + OHads → CH3COOH | (6) |
| | | CH3COOH + OH− → CH3COO− + H2O | (7) |
| | | COads + OHads + 3OH− → CO32− + 2H2O + e− | (8) |
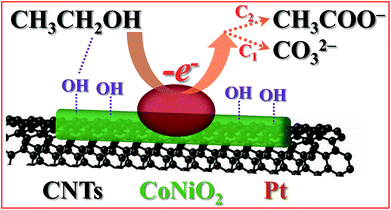 |
| | Scheme 2 Schematic of the mechanism of Pt/CoNiO2–CNTs for ethanol electro-oxidation in an alkaline solution. | |
As is well known, the surface of CoNiO2 carries a negative charge under alkaline conditions because the hydroxyl group (–OH) adsorbs onto the surface of CoNiO2; this results in the formation of CoNiO2–OHads species on the hybrid support. Herein, upon continuously increasing the potentials on the anode, the active sites of Pt on the hybrid catalyst will adsorb the ethanol molecules from the solution, and Pt–CH3CH2OHads species will be formed. Then, the Pt–CH3CH2OHads species will be oxidized to Pt–CH3COads intermediates with the help of the adsorbed OHads species on the CoNiO2–CNT support, and ultimately, they will be converted into CH3COO− species.49 These processes for ethanol oxidation were proposed by Tripković and Koper and denoted as the C2 pathway.50,51 In contrast, the C1 pathway considers that the C–C bond of the adsorbed CH3CHOads will be broken initially, and then, the poisoning species COads will be formed.49 Subsequently, the formed COads species can combine with the adsorbed OHads species on CoNiO2–CNTs and eventually oxidize to carbonate in an alkaline solution.
Conclusion
In summary, the CoNiO2-modified CNT is synthesized by a one-pot hydrothermal method, and the well-dispersed Pt particles are deposited onto the substrate by a facile direct reduction method. The crystal structure and compositions of the Pt/CoNiO2–CNTs are clearly characterized by Raman spectrum and XRD patterns, and the small Pt particles are observed on the surface of the CoNiO2-modified CNT support with good dispersion. Importantly, the as-prepared Pt/CoNiO2–CNT catalyst has a larger EAS value and higher electrocatalytic activity and stability than Pt particles on the rGO and CNT substrate for ethanol electro-oxidation. The catalytic mechanisms for ethanol electro-oxidation have been extensively discussed with respect to the synthesized Pt/CoNiO2–CNT catalyst, and the final products have been analyzed by C2 and C1 pathways. The superior electrocatalytic performance of the designed catalyst reported herein highlights an effective method to achieve ultrahigh catalytic activity for ethanol in alkaline media, indicating potential application prospects of this catalyst in direct alkaline ethanol fuel cells.
Conflicts of interest
There are no conflicts to declare.
Acknowledgements
This work was supported by the National Natural Science Foundation of China (21363003, 21165004, 21163002), Natural Science Foundation of Guangxi Province (2014GXNSFGA118008, 2014GXNSFFA118003), BAGUI scholar program (2014A001), and Project of Talents Highland of Guangxi Province.
Notes and references
- X. Huang, Z. Zhao, L. Cao, Y. Chen, E. Zhu, Z. Lin, M. Li, A. Yan, A. Zettl, Y. M. Wang, X. Duan, T. Mueller and Y. Huang, Science, 2015, 348, 1230–1234 CrossRef CAS PubMed.
- D. Wang, H. L. Xin, R. Hovden, H. Wang, Y. Yu, D. A. Muller, F. J. DiSalvo and H. D. Abruña, Nat. Mater., 2013, 12, 81–87 CrossRef CAS PubMed.
- S. K. Nataraj, C.-H. Wang, H.-C. Huang, H.-Y. Du, L.-C. Chen and K.-H. Chen, ACS Sustainable Chem. Eng., 2015, 3, 302–308 CrossRef CAS.
- B. P. Setzler, Z. Zhuang, J. A. Wittkopf and Y. Yan, Nat. Nanotechnol., 2016, 11, 1020–1025 CrossRef CAS PubMed.
- B. M. Daas and S. Ghosh, J. Electroanal. Chem., 2016, 783, 308–315 CrossRef CAS.
- Z. Li and Q. Niu, ACS Sustainable Chem. Eng., 2014, 2, 533–536 CrossRef CAS.
- L. Li, J. Zhang, Y. Liu, W. Zhang, H. Yang, J. Chen and Q. Xu, ACS Sustainable Chem. Eng., 2013, 1, 527–533 CrossRef CAS.
- X. Yang, X. Liu, X. Meng, X. Wang, G. Li, C. Shu, L. Jiang and C. Wang, J. Power Sources, 2013, 240, 536–543 CrossRef CAS.
- Y. Shen, K. Xiao, J. Xi and X. Qiu, J. Power Sources, 2015, 278, 235–244 CrossRef CAS.
- L. Zhang and Y. Shen, ChemElectroChem, 2015, 2, 887–895 CrossRef CAS.
- Y. Shen, M. Z. Zhang, K. Xiao and J. Xi, ChemCatChem, 2014, 6, 3254–3261 CrossRef CAS.
- Y. Shen, Z. Zhang, K. Xiao and J. Xi, Phys. Chem. Chem. Phys., 2014, 16, 21609–21614 RSC.
- Q. He, Y. Shen, K. Xiao, J. Xi and X. Qiu, Int. J. Hydrogen Energy, 2016, 41, 20709–20719 CrossRef CAS.
- Q. Liu, J. Fan, Y. Min, T. Wu, Y. Lin and Q. Xu, J. Mater. Chem. A, 2016, 4, 4929–4933 CAS.
- Q. Liu, Y. Lin, J. Fan, D. Lv, Y. Min, T. Wu and Q. Xu, Electrochem. Commun., 2016, 73, 75–79 CrossRef CAS.
- Q. Liu, K. Jiang, J. Fan, Y. Lin, Y. Min, Q. Xu and W.-B. Cai, Electrochim. Acta, 2016, 203, 91–98 CrossRef CAS.
- M. Li, Z. Zhao, T. Cheng, A. Fortunelli, C.-Y. Chen, R. Yu, Q. Zhang, L. Gu, B. V. Merinov, Z. Lin, E. Zhu, T. Yu, Q. Jia, J. Guo, L. Zhang, W. A. Goddard, Y. Huang and X. Duan, Science, 2016, 354, 1414–1419 CrossRef CAS PubMed.
- L. Bu, N. Zhang, S. Guo, X. Zhang, J. Li, J. Yao, T. Wu, G. Lu, J.-Y. Ma, D. Su and X. Huang, Science, 2016, 354, 1410–1414 CrossRef CAS PubMed.
- Q. Wang, Z. Tang, L. Wang, H. Yang, W. Yan and S. Chen, ChemistrySelect, 2016, 1, 6044–6052 CrossRef CAS.
- J. Zhang, X. Yang, H. Shao, C.-C. Tseng, S. Tian, W. Hu, C. Jing, J. Tian and Y. Zhao, Fuel Cells, 2017, 17, 115–122 CrossRef CAS.
- X. Yang, M. Zhen, G. Li, X. Liu, X. Wang, C. Shu, L. Jiang and C. Wang, J. Mater. Chem. A, 2013, 1, 8105–8110 CAS.
- Y. Zhao, X. Yang, J. Tian, F. Wang and L. Zhan, Mater. Sci. Eng., B, 2010, 171, 109–115 CrossRef CAS.
- Y. Shen, B. Gong, K. Xiao and L. Wang, ACS Appl. Mater. Interfaces, 2017, 9, 3535–3543 CAS.
- J. S. Spendelow and A. Wieckowski, Phys. Chem. Chem. Phys., 2007, 9, 2654–2675 RSC.
- S. Sharma and B. G. Pollet, J. Power Sources, 2012, 208, 96–119 CrossRef CAS.
- P. K. Shen and C. Xu, Electrochem. Commun., 2006, 8, 184–188 CrossRef CAS.
- C. Xu, Z. Tian, P. Shen and S. P. Jiang, Electrochim. Acta, 2008, 53, 2610–2618 CrossRef CAS.
- C. Yuan, J. Li, L. Hou, X. Zhang, L. Shen and X. W. Lou, Adv. Funct. Mater., 2012, 22, 4592–4597 CrossRef CAS.
- Y. Yang, L. Ren, C. Zhang, S. Huang and T. Liu, ACS Appl. Mater. Interfaces, 2011, 3, 2779–2785 CAS.
- J. Liu, Y. Li, X. Huang, G. Li and Z. Li, Adv. Funct. Mater., 2008, 18, 1448–1458 CrossRef CAS.
- P. Li and H. C. Zeng, Adv. Funct. Mater., 2017, 27, 1606325 CrossRef.
- X.-F. Lu, L.-F. Gu, J.-W. Wang, J.-X. Wu, P.-Q. Liao and G.-R. Li, Adv. Mater., 2016, 29, 1604437 CrossRef PubMed.
- H. Cheng, Y. Su, P.-Y. Kuang, G.-F. Chen and Z.-Q. Liu, J. Mater. Chem. A, 2015, 3, 19314–19321 CAS.
- Y. Zhao, X. Yang, J. Tian, F. Wang and L. Zhan, Int. J. Hydrogen Energy, 2010, 35, 3249–3257 CrossRef CAS.
- X. Peng, D. Chen, X. Yang, D. Wang, M. Li, C.-C. Tseng, R. Panneerselvam, X. Wang, W. Hu, J. Tian and Y. Zhao, ACS Appl. Mater. Interfaces, 2016, 8, 33673–33680 CAS.
- J. Huang, J. Chen, T. Yao, J. He, S. Jiang, Z. Sun, Q. Liu, W. Cheng, F. Hu, Y. Jiang, Z. Pan and S. Wei, Angew. Chem., Int. Ed., 2015, 127, 8846–8851 CrossRef.
- Y. Zhao, X. Yang, J. Tian, F. Wang and L. Zhan, J. Power Sources, 2010, 195, 4634–4640 CrossRef CAS.
- X. Yang, J. Zheng, M. Zhen, X. Meng, F. Jiang, T. Wang, C. Shu, L. Jiang and C. Wang, Appl. Catal., B, 2012, 121–122, 57–64 CrossRef CAS.
- D. Chen, Y. Zhao, Y. Fan, X. Peng, X. Wang and J. Tian, J. Mater. Chem. A, 2013, 1, 13227–13232 CAS.
- X. Leng, Y. Shao, L. Wu, S. Wei, Z. Jiang, G. Wang, Q. Jiang and J. Lian, J. Mater. Chem. A, 2016, 4, 10304–10313 CAS.
- T. Pauporté, L. Mendoza, M. Cassir, M. C. Bernard and J. Chivot, J. Electrochem. Soc., 2005, 152, C49–C53 CrossRef.
- L. Wang, Z. Tang, W. Yan, Q. Wang, H. Yang and S. Chen, J. Power Sources, 2017, 343, 458–466 CrossRef CAS.
- X. Yang, H. Li, A.-Y. Lu, S. Min, Z. Idriss, M. N. Hedhili, K.-W. Huang, H. Idriss and L.-J. Li, Nano Energy, 2016, 25, 42–50 CrossRef CAS.
- Y. Feng, X. Yu and U. Paik, Chem. Commun., 2015, 52, 1633–1636 RSC.
- T. Vidaković, M. Christov and K. Sundmacher, Electrochim. Acta, 2007, 52, 5606–5613 CrossRef.
- L. Ma, D. Chu and R. Chen, Int. J. Hydrogen Energy, 2012, 37, 11185–11194 CrossRef CAS.
- C. Xiao, S. Li, x. Zhang and D. MacFarlane, J. Mater. Chem. A, 2017, 5, 7825–7832 CAS.
- K. Artyushkova, B. Halevi, M. Padilla, P. Atanassov and E. A. Baranova, J. Electrochem. Soc., 2015, 162, H345–H351 CrossRef CAS.
- L. Jiang, A. Hsu, D. Chu and R. Chen, Int. J. Hydrogen Energy, 2010, 35, 365–372 CrossRef CAS.
- A. V. Tripković, K. D. Popović and J. D. Lović, Electrochim. Acta, 2001, 46, 3163–3173 CrossRef.
- S. C. S. Lai, S. E. F. Kleijn, F. T. Z. Öztürk, V. C. van Rees Vellinga, J. Koning, P. Rodriguez and M. T. M. Koper, Catal. Today, 2010, 154, 92–104 CrossRef CAS.
Footnotes |
| † Electronic supplementary information (ESI) available. See DOI: 10.1039/c7se00392g |
| ‡ These authors contributed equally. |
|
| This journal is © The Royal Society of Chemistry 2018 |

 a and
Xiulin
Yang
a and
Xiulin
Yang