
Facile synthesis of electrocatalytically active NbS2 nanoflakes for an enhanced hydrogen evolution reaction (HER)†
Deepesh
Gopalakrishnan
 ,
Andrew
Lee
,
Naresh Kumar
Thangavel
and
Leela Mohana
Reddy Arava
*
,
Andrew
Lee
,
Naresh Kumar
Thangavel
and
Leela Mohana
Reddy Arava
*
Department of Mechanical Engineering, Wayne State University, Detroit, Michigan 48202, USA. E-mail: leela.arava@wayne.edu
First published on 6th November 2017
Abstract
We report a simple ambient pressure annealing technique for the synthesis of ultrathin niobium disulfide (NbS2) nanoflakes. The structure, morphology and composition of the as-synthesized NbS2 flakes are well characterized using various microscopic and spectroscopic techniques. The synthesized two-dimensional layered NbS2 is in stoichiometric proportion, and has a single crystal 3R-NbS2 polymorph structure with semiconducting behavior and has abundant catalytic defect sites. In this paper, the hydrogen evolution reaction (HER) activity of the NbS2 nanoflakes/rGO composite having dense exposed basal planes with improved conductivity is explored, and it is found to be a good HER catalyst in terms of low onset potential, low Tafel slope and high exchange current density.
Introduction
Two-dimensional layered materials have gained attention in recent years due to their unique physicochemical properties arising from their low structural dimensionality.1,2 The studies on graphene with unique electronic and mechanical properties have motivated researchers to extend their studies to explore other graphene-like materials.3,4 Thus phosphorene, silicene, and transition metal dichalcogenides (TMDs) have gained more attention. TMDs depending on their atomic arrangement (crystal structure) can exhibit a wider range of electrical properties from insulators and semiconductors to metals. TMDs are composed of slabs with atomically arranged hexagonally close-packed sheets of transition metal atoms (M) sandwiched between two sheets of chalcogen atoms (X). Although the intraslab M–X bonds are covalent, the MX2 interslabs are stacked by van der Waals forces; thus, the TMDs can be readily exfoliated using various methods including mechanical cleavage, sonication in solvents, and electrochemical Li intercalation and subsequent exfoliation.5 It is easy to convert TMDs into thin 2D slabs in large scales using these liquid-phase procedures;6 also, TMDs are naturally abundant and mechanically strong with exceptionally high Young's modulus values and flexibility, which make them attractive candidates for many potential applications.7 There are a substantial number of literature studies which are exclusively on Group 6 TMDs like MoS2, WS2, MoSe2 and WSe2 when compared with other group TMD materials.8–11 This limited study outside of the Group 6 TMDs urges for exploiting group 5 TMDs including VS2, VSe2, NbS2, NbSe2, VTe2, TaS2, etc. NbS2 exhibits the same lamellar structural features of MoS2 and WS2, which allowed researchers to easily find an alternative promising catalyst to MoS2/WS2.12 The catalytic, intercalation, optical, and superconductivity properties along with its abundance make NbS2 a potential candidate among TMDs.13 NbS2 is unique with the lack of one electron in the d bands which gives the compound its peculiar electronic and magnetic properties.14,15 Also, like MoS2, NbS2 has a prismatic 2H structure and is capable of forming in the 1T metallic phase. As per reports, NbS2 has four phases: two stoichiometric and two non-stoichiometric – 2H NbS2 and 3R NbS2 and 2H Nb1+xS2 and 3R Nb1+xS2, respectively.16NbS2 has been fervently studied as a hydrodesulfurization catalyst in the fields of petroleum purification, sensors, cathode materials and superconductors with a wide transition temperature range.17–19 But difficulty in the preparation of stoichiometrically stable NbS2 nanomaterials hinders it from practical applications. The oxides like MoO3, WO3 can react with low pressure sulfur to form corresponding sulfides; but, Nb2O5 or NbO2 requires a high sulfur pressure around 6 atm and a high temperature to form stable NbS2 crystals which holds back from their simple synthesis routes.20–22 Also, the number of layers and the thickness of the NbS2 crystals synthesized cannot be controlled. Thus, it is a challenge to develop a facile synthesis route for few-layered NbS2 flakes.22 Chemical vapor deposition involving the thermal decomposition of organometallic niobium precursors is considered as a viable technique for the synthesis of nano-NbS2.12,23 But through CVD, it is more likely to form Nb2O5 and NbS as the end products of these reactions. In addition, the sulfur sources employed as precursors for the CVD technique are highly organic and toxic require special equipments. Also, the limited previous studies on NbS2 nanosheets hinders their exploration for various applications. Thus, it is essential to develop a novel synthesis route for NbS2 which addresses these key issues. Still, the traditional hydrothermal and other wet chemical synthesis routes have limited controllability on the composition and crystal structure of NbS2 nanomaterials.24,25 These well explored techniques may lead to perceptible changes in the catalytic performance. In addition, the catalytic activity has an intrinsic correlation with the nature, structure and composition of the catalyst. Crystalline nature is an indispensable parameter which can affect three figures of merit namely Tafel slope, turn-over frequency (TOF) and stability of the catalyst towards catalytic performance.25 Thus, engineering the crystalline structure of NbS2 is the key factor for enhanced electrocatalytic activity. Lastly, it is indeed essential to develop a facile route for the synthesis of highly crystalline NbS2 nanostructures which are catalytically active for the generation of hydrogen.
The ongoing pursuit of hydrogen as a future energy carrier calls for hydrogen generation catalysts.26 Exploration of low-cost catalytically active HER catalysts as alternatives to scarce and expensive Pt is of fundamental interest.14,27–29 Thus, the need for alternative catalysts with lower material and production costs is of high demand. Active sites in catalysts are normally formed by unsaturated surface atoms with dangling bonds.14 Research on MoS2, an electrocatalytically active Group 6 member, has prompted researchers to investigate other two-dimensional layered materials.29,30 Unlike the inert basal planes of Group 6 TMDs, the catalytically active basal planes of Group 5 compounds can provide enhanced HER activity and thus can outpace any other recently known electrocatalysts.31,32 Group 5 TMDs including NbS2 with highly metallic nature and a favorable ΔG are touted to surpass Group 6 TMDs in terms of HER catalytic activity without any further chemical modification,33 but it has not been experimentally proved yet. The enhanced activity at the basal planes of NbS2 is not clearly understood.24 Also, H binding on the basal planes can be improved by increasing the surface area and conducting channels. Herein, we experimentally explore the electrochemical HER activity of highly crystalline NbS2 nanoflakes as an improved electrocatalyst because of their low onset potential, high exchange current density, and low Tafel slope. In addition, we show an improvement in the H2 generation reaction kinetics through the addition of a graphene conductive matrix in between NbS2 nanoflakes.
Experimental
NbS2 nanoflakes were synthesized using a tube furnace to anneal commercial powdered niobium (1 g, Alfa Aesar, >99% purity) with elemental sulfur (3 g, Sigma Aldrich, >99% purity). The precursors including sulfur and niobium were placed in the first and the middle zone of the tube respectively as shown in Fig. 1, which schematically illustrates the experimental setup. A constant flow of argon was passed through the tube during the annealing procedure to prevent niobium metal from oxidizing into niobium oxide. The temperature of the furnace was ramped up to the set temperature in 100 minutes, and then kept at the temperature for 80 minutes before being allowed to naturally cool back to room temperature. The synthesis was done at various temperatures of 750, 850, 950, and 1050 °C. The niobium to sulfur mass ratio used was 1![[thin space (1/6-em)]](https://www.rsc.org/images/entities/char_2009.gif) :3. NbS2/rGO was synthesized by sulfurizing the mixture containing Nb with 20% of GO (prepared through a modified Hummers method) under an argon atmosphere at a temperature of 1050 °C. The synthesis parameters of NbS2/rGO were maintained the same as those for the synthesis of NbS2 flakes.
:3. NbS2/rGO was synthesized by sulfurizing the mixture containing Nb with 20% of GO (prepared through a modified Hummers method) under an argon atmosphere at a temperature of 1050 °C. The synthesis parameters of NbS2/rGO were maintained the same as those for the synthesis of NbS2 flakes.
 | ||
| Fig. 1 Schematic representation of the synthesis of NbS2 nanoflakes. | ||
Morphological and compositional analyses of NbS2 samples were carried out using various spectroscopic and microscopic techniques. The as-synthesized samples were examined using a scanning electron microscope (SEM, JSM 7600 FE SEM), a transmission electron microscope (TEM, JOEL), and a confocal Raman microscope with a laser excitation wavelength of 532 nm (Andor Solis Shamrock 500). UV visible spectra were recorded to check the absorption features and determine the optical bandgap of the NbS2 samples using a Shimadzu UV-3600 UV-VIS-NIR spectrophotometer. The crystalline nature of the as-grown samples was analyzed using an X-ray diffractometer (XRD, Bruker) using Cu-Kα radiation (1.5418 Å). The catalyst ink for the electrochemical HER measurements was prepared by mixing 4 mg of NbS2 nanoflakes, ethanol, deionized water, and 0.5 wt% Nafion followed by sonication for 30 min. Further, 5 μl of catalyst ink containing NbS2 nanoflakes was dropped onto a Glassy Carbon (GC) electrode of an area of 0.07 cm2 which was cleaned before dropcasting with 0.05 μm alumina nanoparticle solution. The electrochemical studies were carried out using a three-electrode system using a Biologic potentiostat. A Ag/AgCl (sat) electrode was used as the reference electrode with a Pt wire as the counter electrode. NbS2 coated GC served as a working electrode where 0.5 M H2SO4 was used as the electrolyte. Linear sweep voltammetry (LSV) of this entire three-electrode system with a scan rate of 2 mV s−1 was performed in 0.5 M H2SO4 electrolyte de-aerated with Ar (for 1 h).
Results and discussion
The crystal structures of as-synthesized NbS2 at different temperatures were examined with XRD. The composition of the material formed by annealing at varying temperatures confirms the temperature dependent formation of pure phase NbS2, and the corresponding XRD patterns of the materials formed are shown in Fig. 2a. The NbS2 formed at a temperature of 750 °C contained slight traces of unreacted sulfur and Nb2O5. The mixture formed at 850 °C contained diffraction peaks of both Nb2S8 and Nb2O5. When the precursors were heated up to 950 °C, a composite mixture of NbS2 and Nb2O5 was formed. But we also found here a highly intense peak of unreacted organo-sulfur. Further when the temperature is increased to 1050 °C, NbS2 is formed with highly intense peaks which correspond to the highly crystalline nature of the as-formed NbS2 from the higher growth temperature. The sharp peak (003) shows the layer structured NbS2 with layers piled up with respect to the C axis. The diffraction peaks from the (104) and (015) planes correspond to the disordered and randomly distributed NbS2 nanosheets. The XRD data analysis indicates the 3R-type rhombohedral structure of NbS2 at 1050 °C with lattice constants, a = b = 3.330 Å and c = 7.918 Å (PDF: 03-065-3655).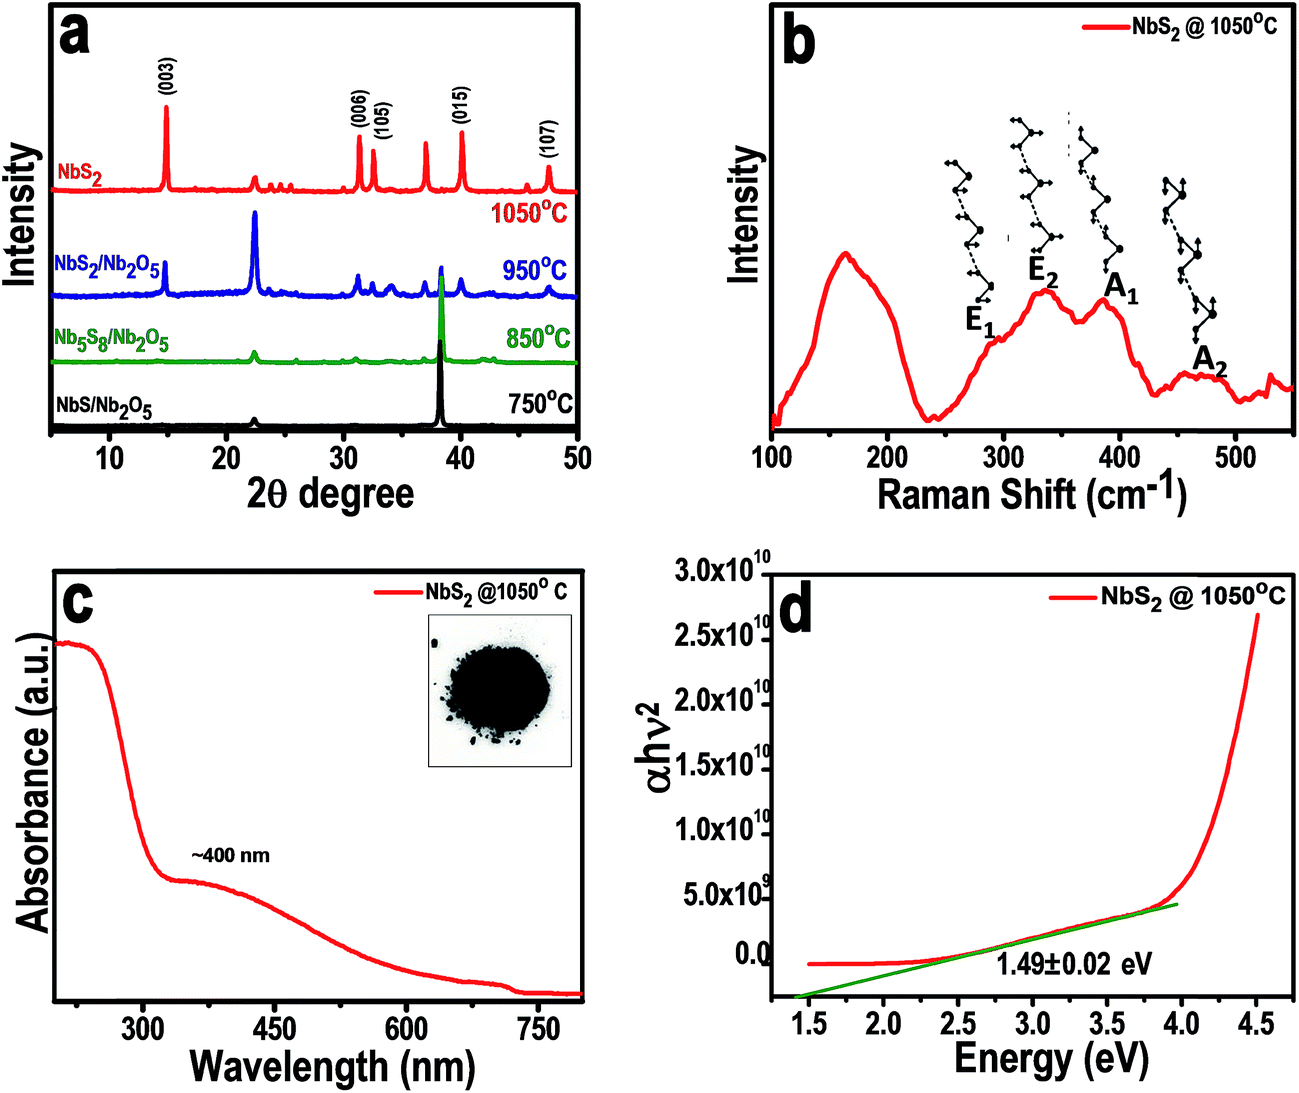 | ||
| Fig. 2 Characterization of NbS2 nanoflakes. (a) XRD patterns of NbS2 flakes synthesized at different temperatures showing the formation of pure phase NbS2 nanoflakes. (b) Raman spectrum showing the characteristic vibration modes of NbS2. (c) UV vis absorption spectra of NbS2 flakes synthesized at 1050 °C (inset: photograph of the as-synthesized NbS2 powder). (d) Tauc plot of NbS2 nanoflakes showing an indirect bandgap of ∼1.49 eV. | ||
Raman scattering measurements were carried out for NbS2 nanoflakes synthesized at 1050 °C and the results are shown in Fig. 2b. There are four major non-degenerate Raman active modes, at around 290, 330, 386, and 450 cm−1 representing E modes (E1 and E2) and A modes (A1 and A2), respectively. Raman spectrum with all the 4 active modes predicts the as synthesized NbS2 exist in the 3R phase.12 The peaks at 386 cm−1 and 450 cm−1 are assigned to the A1 and A2 modes, respectively, of 3R-NbS2 with a sharper A1 mode revealing the crystalline nature of the NbS2 nanoflakes. The broad peak observed at 158 cm−1 is attributed to the existence of single crystalline NbS2 with defects which help in enhancing the conductivity towards better catalysis. Furthermore, E modes at 330 (E2) and the shoulder peak at 290 (E1) correspond to the rigid layer modes whose intensities are relative to the thickness of the layers. In our case, E mode peaks are less sharp which indicates the presence of few-layered NbS2 nanoflakes. To reconfirm the crystal phase and its influence on conductivity, we calculated the optical band gap from UV vis absorption spectra.
The absorption spectra were collected for the NbS2 nanoflakes which were initially dispersed in a 4:1 ratio of water–ethanol mixture (Fig. 2c and d). A characteristic excitonic absorption shoulder around 400 nm was found (Fig. 2c) and the bandgap calculated from the absorption spectra using the Tauc method was found to be around 1.49 eV (Fig. 2d), which suggests a semiconducting behavior of 3R-NbS2. This observed finite optical indirect bandgap confirms the nonmetallic behavior of the synthesized NbS2 nanoflakes. The inset of Fig. 2c shows the photograph of the synthesized grey powder; the yield was high through this simple synthesis technique.
We examined the morphologies of all the synthesized NbS2 nanoflakes. Fig. 3a–d show the SEM images of the as-synthesized NbS2 nanosheets at different temperatures, viz. 750, 850, 950 and 1050 °C. The morphological changes are obvious as the temperature increases which confirms the structural formation of pure phase NbS2 from the NbO/NbS mixture. At 750 °C, the nanoflakes coalesced together and later at 850 °C they become flakier with fewer unreacted precursors. At 950 °C hexagonal platelets started forming and finally at 1050 °C, the flakes formed with a uniform hexagonal platelet morphology whose lateral dimensions extended from a few nm to 2 μm. This also confirms the temperature stability of the NbS2 nanoflakes. At 1050 °C the nanoflakes were found to be layered platelets with definite edges and clearly exposed basal planes which can be correlated with the absence of restacking of the as-formed niobium sulfide nanoflakes.
 | ||
| Fig. 3 SEM images of NbS2 nanoflakes. (a) 750 °C, (b) 850 °C, (c) 950 °C, and (d) 1050 °C showing the morphological changes while forming the pure phase NbS2, (e) and (f) are the TEM images of the formed NbS2 at 1050 °C. | ||
TEM monitoring of NbS2 annealed at 1050 °C revealed the crystalline nature of the synthesized nanoflakes (Fig. 3e and f). The lattice fringes were highly ordered with a lattice plane distance of 0.29 nm which corresponds to the (0 1 0) or (1 0 0) plane of highly crystalline NbS2. Also, the as-synthesized NbS2 nanoflakes were found to be very thin and have a defect-free structure.
The evolution of surface morphology depending on the growth temperature has been studied. During the growth, as the temperature increased, the vapor pressure of sulfur got increased up to 1 atm and the vapors of sulfur reacted with Nb particles to form NbS2 nanoflakes. At a low temperature, the formed coalesced NbS2 flakes showed a smooth surface with sharp edges; but, the Nb to NbS2 transformation was incomplete. However, at a higher temperature the flakes formed were coarse and distinct and their edges were more precise.
High electrocatalytic activity can be achieved either by increasing the number of exposed active sites,29 improving the conductivity of the material34 or incorporating a cocatalyst.35 Here, the addition of graphene oxide (GO) to the Nb precursor and its further annealing in the presence of sulfur under an argon atmosphere at 1050 °C resulted in thermal reduction of GO along with the sulfurization of Nb to form the NbS2–rGO composite. The prepared NbS2–rGO composite was characterized with microscopic techniques and the results are shown in Fig. S1 in the ESI.† The NbS2 nanoflakes were found to be uniformly dispersed on the graphene surface and retain their crystalline nature.
XPS of NbS2/rGO was carried out to estimate the oxidation states of Nb and S and the presence of C as shown in Fig. S2.† It was found that Nb exists in the +4 oxidation state, which can be clearly determined from the binding energies of Nb 3d3/2 at 206.55 eV and Nb 3d5/2 at 203.8 eV. These results match well with the previous reports and thus confirm the formation of NbS2 nanoflakes in the presence of carbon. Also, the oxidation state of Nb(+4) is well maintained during the reduction of GO which brings about charge balance during the one pot synthesis of the NbS2/rGO composite. Moreover, the spectrum showed 2 peaks at 162.5 and 163.6 eV which correspond to the S 2p3/2 and S 2p1/2 components of NbS2, respectively. The peaks at 284.8 and 285.2 eV correspond to the Sp2 graphitic carbon and Sp3 carbon of reduced graphene oxide in the NbS2/rGO composite.
Thus, embedding NbS2 nanoflakes in the graphene matrix is expected to enhance the electrochemical hydrogen evolution through the utilization of the high surface area and conductance of graphene.36–38
Linear sweep HER measurements have been performed for the NbS2 based electrocatalyst at a scan rate of 2 mV s−1 with a conventional 3-electrode setup. Fig. 4a compares the iR corrected HER linear polarization current obtained on NbS2, NbS2/rGO and platinum–carbon (Pt/C) modified GC electrodes (comparison of LSVs of NbS2 and NbS2/rGO with and without iR correction is given in Fig. S3a (ESI†)). The NbS2/rGO surface showed a lower HER onset overpotential, η = 0.35 V whereas bare NbS2 exhibited 0.42 V vs. the RHE (Pt/C showed 0.025 V). Following the hydrogen reduction onset, a sharp increment in current was observed on both surfaces and NbS2/rGO achieved 10 mA cm−2 current density at 0.5 V vs. RHE whereas the NbS2 surface required 0.55 V vs. RHE, showing the role of the conductive surface in the enhancement of catalytic activity. For a better electrocatalytic activity comparison, Tafel slopes (η = blogj + a) were measured (Fig. 4c) from the linear region of the curves and a smaller Tafel slope value of 72 mV per decade on the NbS2/rGO surface compared to NbS2 (103 mV per decade) was found. From the slope values, it's quite difficult to ascertain the HER mechanism on the NbS2 surface since the reaction on the TMD surface is not well established. However, there are three possible reaction steps proposed for the HER in acidic medium; the first reaction step involves the discharge step (Volmer reaction), which is either followed by atom–atom combination (Tafel reaction) or ion–atom recombination (Heyrovsky reaction).39,40 It is elucidated that if the Tafel slope is 30 mV per decade, the HER proceeds via the Volmer–Tafel mechanism or if it is above 40 mV per decade, it follows the Volmer–Heyrovsky mechanism. Herein, the HER on both surfaces with Tafel slopes above 40 mV per decade suggests the involvement of the Volmer–Heyrovsky mechanism. Furthermore, the exchange current density (jo) calculated from the intercept for NbS2/rGO was found to be 3.16 × 10⁻⁴ A cm−2 whereas, NbS2 exhibited a value of 5.52 × 10⁻⁵ A cm−2 suggesting the presence of more active sites on conductive networks.
 | ||
| Fig. 4 Electrochemical HER performance of NbS2 nanoflakes compared with NbS2/rGO. (a) Linear sweep voltammogram curves of NbS2/rGO nanoflakes compared with NbS2 and Pt/C. (b) EIS spectrum showing the change in Rct for NbS2/rGO when compared to NbS2 nanoflakes alone (partial magnification of EIS spectra is shown in the inset). (c) Tafel plot for the HER performance of NbS2 flakes and NbS2/rGO (d) Schematic representation of hydrogen evolution on NbS2 nanosheets. | ||
To further corroborate the activity, interfacial charge transfer resistance (Rct) values for NbS2/rGO and the NbS2 surface were measured using electrochemical impedance spectroscopy at open circuit potential (Fig. 4b). The NbS2/rGO shows a charge transfer resistance value of 200 Ω whereas the NbS2 electrode shows 5000 Ω. This significant reduction in the Rct of NbS2/rGO clearly evidenced that incorporation of a conductive graphene support will aid in efficient charge transport. The higher activity and greater decrease in the charge transfer resistance of graphene supported NbS2 (shown in the inset of Fig. 4b) are ascribed to the solid electronic coupling between them, making more edge active sites available for catalysis. Furthermore, stability of the electrode materials is one of the key parameters in determining the efficiency of electrocatalysts. Cyclic voltammetric experiments were performed in the potential range between −0.3 and 0.2 V in acidic medium to evaluate the catalyst stability. Even after 500 cycles both the electrodes are able to retain their catalytic activity with a negligible decrease in the cathodic current (Fig. S3b in the ESI†). The stability of the NbS2/rGO was again analyzed using the SEM technique and we found that both NbS2 and graphene have a stable morphology even after 500 cycles. In Fig. S3b† (inset), we can see disintegrated NbS2 flakes with rigid edges without any morphological changes along with rGO confirming the stable HER performance. This disintegration might have occurred due to the sonication assisted sample preparation of HER catalysts. Fig. 4d is the schematic representation of the evolution of hydrogen on the basal plane of the NbS2 nanoflakes.
Besides charge transfer kinetic measurements, to corroborate the superior HER performance of NbS2/rGO compared to bare NbS2, we estimated the effective surface area using a simple cyclic voltammetry method (Fig. S4†). From Fig. 5, the slopes of the plot where half of positive and negative current densities plotted against the different voltage scan rate gives the electrochemical double-layer capacitances, Cdl. NbS2/rGO exhibits a Cdl value of 2 μF cm−2, larger than that of NbS2 nanoflakes alone which reveals the enhanced surface area of the NbS2/rGO composite through the rGO incorporation helping it to expose a more active area for better HER performance.
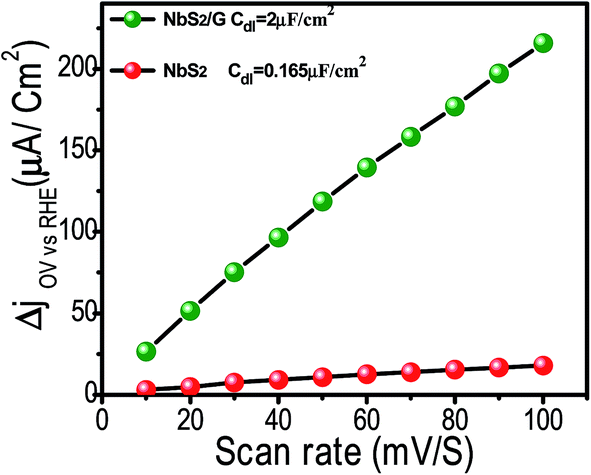 | ||
| Fig. 5 Linear fitting of the capacitive current differences against scan rates. The calculated double layer capacitances of both the NbS2 and NbS2/rGO electrodes are given. | ||
Conclusions
We demonstrate an easy and novel route of synthesis of NbS2 using Nb powder and S sources under a controlled atmosphere. The NbS2 nanoflakes were well characterized and found to be a 3R polymorph with rhombohedral crystal structures. The optical bandgap was measured and found to be ∼1.49 eV confirming the semiconducting nature of 3R-NbS2. With its flakey morphology and large number of exposed active sites along with electrical coupling with graphene, the NbS2/rGO hybrid showed an enhanced HER activity with a small onset potential ∼0.15 eV, a Tafel slope of 84 mV per decade, and a large cathodic current. Thus, this novel one-pot synthesis of a NbS2/rGO hybrid composite shows the potential of NbS2 as a good electrocatalyst.Conflicts of interest
There are no conflicts to declare.Acknowledgements
This article was supported in part by the NSF Division of Chemical, Bioengineering, Environmental, and Transport Systems (CBET: 1748363) and ACS Petroleum Research Fund (ACSPRF: 57647-DNI10). A. L. acknowledges NSF Division of Engineering Education & Centers (REU Site: 1461031).References
-
H. Topsøe, B. S. Clausen and F. E. Massoth, in Catalysis: Science and Technology, ed. J. R. Anderson and M. Boudart, Springer Berlin Heidelberg, Berlin, Heidelberg, 1996, pp. 1–269 Search PubMed
.
- Y. Aray, D. Zambrano, M. H. Cornejo, E. V. Ludeña, P. Iza, A. B. Vidal, D. S. Coll, D. M. Jímenez, F. Henriquez and C. Paredes, J. Phys. Chem. C, 2014, 118, 27823–27832 CAS
- X. Huang, Z. Zeng and H. Zhang, Chem. Soc. Rev., 2013, 42, 1934–1946 RSC
- R. Mas-Balleste, C. Gomez-Navarro, J. Gomez-Herrero and F. Zamora, Nanoscale, 2011, 3, 20–30 RSC
- M. Chhowalla, H. S. Shin, G. Eda, L.-J. Li, K. P. Loh and H. Zhang, Nat. Chem., 2013, 5, 263–275 CrossRef PubMed
- J. N. Coleman, M. Lotya, A. O'Neill, S. D. Bergin, P. J. King, U. Khan, K. Young, A. Gaucher, S. De, R. J. Smith, I. V. Shvets, S. K. Arora, G. Stanton, H.-Y. Kim, K. Lee, G. T. Kim, G. S. Duesberg, T. Hallam, J. J. Boland, J. J. Wang, J. F. Donegan, J. C. Grunlan, G. Moriarty, A. Shmeliov, R. J. Nicholls, J. M. Perkins, E. M. Grieveson, K. Theuwissen, D. W. McComb, P. D. Nellist and V. Nicolosi, Science, 2011, 331, 568–571 CrossRef CAS PubMed
- H. Wang, H. Feng and J. Li, Small, 2014, 10, 2165–2181 CrossRef CAS PubMed
- X. Shang, W.-H. Hu, X. Li, B. Dong, Y.-R. Liu, G.-Q. Han, Y.-M. Chai and C.-G. Liu, Electrochim. Acta, 2017, 224, 25–31 CrossRef CAS
- W.-H. Hu, G.-Q. Han, F.-N. Dai, Y.-R. Liu, X. Shang, B. Dong, Y.-M. Chai, Y.-Q. Liu and C.-G. Liu, Int. J. Hydrogen Energy, 2016, 41, 294–299 CrossRef CAS
- W.-H. Hu, X. Shang, G.-Q. Han, B. Dong, Y.-R. Liu, X. Li, Y.-M. Chai, Y.-Q. Liu and C.-G. Liu, Carbon, 2016, 100, 236–242 CrossRef CAS
- G.-Q. Han, X. Shang, S.-S. Lu, B. Dong, X. Li, Y.-R. Liu, W.-H. Hu, J.-B. Zeng, Y.-M. Chai and C.-G. Liu, Int. J. Hydrogen Energy, 2017, 42, 5132–5138 CrossRef CAS
- W. Ge, K. Kawahara, M. Tsuji and H. Ago, Nanoscale, 2013, 5, 5773–5778 RSC
- J. A. Wilson and A. D. Yoffe, Adv. Phys., 1969, 18, 193–335 CrossRef CAS
- X. Chen, Y. Gu, G. Tao, Y. Pei, G. Wang and N. Cui, J. Mater. Chem. A, 2015, 3, 18898–18905 CAS
- Y. Zhou, Z. Wang, P. Yang, X. Zu, L. Yang, X. Sun and F. Gao, ACS Nano, 2012, 6, 9727–9736 CrossRef CAS PubMed
- W. G. Fisher and M. J. Sienko, Inorg. Chem., 1980, 19, 39–43 CrossRef CAS
- C. Geantet, J. Afonso, M. Breysse, N. Allali and M. Danot, Catal. Today, 1996, 28, 23–30 CrossRef CAS
- N. Kumagai and K. Tanno, Electrochim. Acta, 1991, 36, 935–941 CrossRef CAS
- W. M. R. Divigalpitiya, R. F. Frindt and S. R. Morrison, J. Phys. D: Appl. Phys., 1990, 23, 966 CrossRef CAS
- Y. Zhang, Y. Zhang, Q. Ji, J. Ju, H. Yuan, J. Shi, T. Gao, D. Ma, M. Liu, Y. Chen, X. Song, H. Y. Hwang, Y. Cui and Z. Liu, ACS Nano, 2013, 7, 8963–8971 CrossRef CAS PubMed
- Y. Zhan, Z. Liu, S. Najmaei, P. M. Ajayan and J. Lou, Small, 2012, 8, 966–971 CrossRef CAS PubMed
- J. K. Dash, L. Chen, P. H. Dinolfo, T.-M. Lu and G.-C. Wang, J. Phys. Chem. C, 2015, 119, 19763–19771 CAS
- C. J. Carmalt, E. S. Peters, I. P. Parkin, T. D. Manning and A. L. Hector, Eur. J. Inorg. Chem., 2004, 2004, 4470–4476 CrossRef
- J. Yuan, J. Wu, W. J. Hardy, P. Loya, M. Lou, Y. Yang, S. Najmaei, M. Jiang, F. Qin, K. Keyshar, H. Ji, W. Gao, J. Bao, J. Kono, D. Natelson, P. M. Ajayan and J. Lou, Adv. Mater., 2015, 27, 5605–5609 CrossRef CAS PubMed
- Y. Li, Y. Yu, Y. Huang, R. A. Nielsen and W. A. Goddard, ACS Catal., 2015, 5, 448–455 CrossRef CAS
- M. S. Dresselhaus and I. L. Thomas, Nature, 2001, 414, 332–337 CrossRef CAS PubMed
- P. D. Tran and J. Barber, Phys. Chem. Chem. Phys., 2012, 14, 13772–13784 RSC
- M. G. Walter, E. L. Warren, J. R. McKone, S. W. Boettcher, Q. Mi, E. A. Santori and N. S. Lewis, Chem. Rev., 2010, 110, 6446–6473 CrossRef CAS PubMed
- D. Gopalakrishnan, D. Damien and M. M. Shaijumon, ACS Nano, 2014, 8, 5297–5303 CrossRef CAS PubMed
- D. Gopalakrishnan, D. Damien, B. Li, H. Gullappalli, V. K. Pillai, P. M. Ajayan and M. M. Shaijumon, Chem. Commun., 2015, 51, 6293–6296 RSC
- X. Chia, A. Ambrosi, P. Lazar, Z. Sofer and M. Pumera, J. Mater. Chem. A, 2016, 4, 14241–14253 CAS
- C. Tsai, K. Chan, J. K. Nørskov and F. Abild-Pedersen, Surf. Sci., 2015, 640, 133–140 CrossRef CAS
- H. Pan, Sci. Rep., 2014, 4, 5348 CrossRef CAS PubMed
- D. R. Cummins, U. Martinez, A. Sherehiy, R. Kappera, A. Martinez-Garcia, R. K. Schulze, J. Jasinski, J. Zhang, R. K. Gupta, J. Lou, M. Chhowalla, G. Sumanasekera, A. D. Mohite, M. K. Sunkara and G. Gupta, Nat. Commun., 2016, 7, 11857 CrossRef CAS PubMed
- A. B. Laursen, S. Kegnaes, S. Dahl and I. Chorkendorff, Energy Environ. Sci., 2012, 5, 5577–5591 CAS
- Y. Li, H. Wang, L. Xie, Y. Liang, G. Hong and H. Dai, J. Am. Chem. Soc., 2011, 133, 7296–7299 CrossRef CAS PubMed
- J. Duan, S. Chen, M. Jaroniec and S. Z. Qiao, ACS Nano, 2015, 9, 931–940 CrossRef CAS PubMed
- J.-S. Li, Y. Wang, C.-H. Liu, S.-L. Li, Y.-G. Wang, L.-Z. Dong, Z.-H. Dai, Y.-F. Li and Y.-Q. Lan, Nat. Commun., 2016, 7, 11204 CrossRef CAS PubMed
- P. C. K. Vesborg, B. Seger and I. Chorkendorff, J. Phys. Chem. Lett., 2015, 6, 951–957 CrossRef CAS PubMed
- M. Zeng and Y. Li, J. Mater. Chem. A, 2015, 3, 14942–14962 CAS
Footnote |
| † Electronic supplementary information (ESI) available: TEM and SEM images of the NbS2/rGO nanocomposite and HER stability measurements are included. See DOI: 10.1039/c7se00376e |
| This journal is © The Royal Society of Chemistry 2018 |