
 Open Access Article
 This Open Access Article is licensed under a Creative Commons Attribution-Non Commercial 3.0 Unported Licence
The morphology and surface charge-dependent cellular uptake efficiency of upconversion nanostructures revealed by single-particle optical microscopy†
Di
Zhang‡
a,
Lin
Wei‡
b,
Meile
Zhong
b,
Lehui
Xiao
 *ab,
Hung-Wing
Li
c and
Jianfang
Wang
d
*ab,
Hung-Wing
Li
c and
Jianfang
Wang
d
aState Key Laboratory of Medicinal Chemical Biology, Tianjin Key Laboratory of Biosensing and Molecular Recognition, College of Chemistry, Nankai University, Tianjin, 300071, China. E-mail: lehuixiao@nankai.edu.cn
bKey Laboratory of Chemical Biology & Traditional Chinese Medicine Research, Key Laboratory of Phytochemical R&D of Hunan Province, College of Chemistry and Chemical Engineering, Hunan Normal University, Changsha, 410082, China
cDepartment of Chemistry, Hong Kong Baptist University, Kowloon Tong, Hong Kong SAR, China
dDepartment of Physics, The Chinese University of Hong Kong, Shatin, Hong Kong SAR, China
First published on 18th May 2018
Abstract
The cellular uptake efficiency of nanostructures has been demonstrated to be highly dependent on the surface charge, size and shape although the cellular internalization process is still far from being well-understood. In this work, a series of NaYF4:Yb3+, Er3+ upconversion nanoparticles (UCNPs) with different morphologies and surface coatings were prepared to explore the influence of surface charge and morphology on the cellular internalization process with single-particle fluorescence microscopy. It is found that the higher the surface charge and larger the surface-to-volume ratio of the nanoparticles, the more efficient the cellular uptake will be. Particularly, the surface charge is demonstrated to be the primary influence factor for small sized nanoparticles on the cellular uptake process. By blocking the endocytosis routes with temperature modulation (from 37 to 4 °C) or introduction of chemical inhibitors (dynasore and genistein), multiplexed mechanisms are found to be involved in the cellular uptake process, including clathrin- and caveolae-mediated endocytosis, physical adhesion and penetration, and so on. Moreover, in the aspect of size effect, an energy-dependent endocytosis process plays a more important role for larger size particles. In short, this study presents a pattern of cellular internalization pathway for the nanoparticles with different morphologies and surface charges, which would provide useful information for the development of robust drug delivery systems.
Introduction
Over the past few decades, nanoscale materials have aroused great attention in biological imaging and molecular sensing owing to their unique optical properties, small size, favourable biocompatibility and ease of functionalization.1–8 Particularly, a variety of functional nanomaterials have been developed as delivery vehicles in the field of therapy and diagnosis, which are administered to biological fluids and tissues.9–12 Investigating the interaction of nanoparticles with cells is significant to understand a wealth of mechanistic information about cellular and biological processes and thus to design efficient nanoscale delivery systems.13,14Several strategies have demonstrated that slight alterations in the surface charge, size and geometry of the nanostructure greatly influences the extent and rate of its cellular internalization efficiency.15 However, the majority of those studies basically focus on nanospheres.16,17 The roles of size and shape of the nanoparticle in the process of cellular uptake, especially the differences between two- and three-dimensional (2- and 3-D) structures, still lack comprehensive characterization. For example, no elucidation on the differences of the cellular uptake efficiency between the particles with different surface-to-volume ratios (i.e., from a plate to a rod structure with the same cross-sectional area) has been provided. In addition, there is a lack of related studies on the nanoparticles of large size (hundreds of nanometers or even micron level), which have been frequently utilized for drug delivery.
Up to now, many nanomaterials, including noble metal nanoparticles,10,18 hybridized inorganic nanostructures,19 and polymeric composites,20,21 have been employed for studying the cellular internalization using optical microscopy, transmission electron microscopy (TEM) and scanning electron microscopy (SEM). However, these nanomaterials typically do not fluoresce. It is difficult to visualize and reveal details in situ at the subcellular level with high temporal and spatial resolution.22 This problem has then been addressed by doping nanomaterials with organic dyes to give fluorescence signal in several studies,10,13 where they still suffer from poor photostability, limited signal-to-noise ratios and undesired biocompatibility.23 UCNPs, as a new class of lanthanide-doped fluorescent materials, have been used for drug/gene delivery24–27 due to their low cytotoxicity, sharp emission bandwidth, high quantum yield and superior photostability.23,28–30 Importantly, compared with organic dyes and other popular inorganic fluorescent materials, UCNPs can convert low energy near-infrared light into high energy emission,31–33 which significantly reduces the auto-fluorescence from biological samples.34,35 More importantly, these particles are harmless to cells.36
In this work, a series of NaYF4:Yb3+, Er3+ UCNPs have been prepared to explore the cellular uptake pattern of nanomaterials with 2- and 3-D structures at the single-particle level. Specifically, four types of UCNPs, with good mono-dispersibility and photostability, were synthesized through a modified hydrothermal method. The UCNPs were endowed with different charges by coating them with polyacrylic acid (PAA), polyvinylpyrrolidone (PVP) and polyethyleneimine (PEI). Then the polymer-coated UCNPs with different morphologies were co-cultured with HeLa cells (as a model of cancerous cell lines) to explore the effect of surface charge and morphology on the cellular internalization efficiency. From the fluorescence microscopy images, it is found that the nanoparticles with positive surface charge and large surface-to-volume ratios are more likely to be taken up by cells. By blocking the endocytosis process with temperature modulation (from 37 to 4 °C) or introduction of chemical inhibitors (dynasore and genistein), multiple mechanisms are demonstrated to co-exist in the internalization process, including energy-dependent endocytosis, physical adhesion and then penetration. Moreover, electrostatic adsorption is the major impetus for small-size nanoparticles, while energy-dependent endocytosis plays an important role for large-size nanoparticles in the cellular internalization process. Interestingly, when the energy-dependent endocytosis process is inhibited, the role of the charge effect is found to be gradually weakened with increased particle size. The findings deciphered herein would have valuable implications in the design of nanostructures for biomedical applications.
Experimental
Chemicals and materials
Y(NO3)3·6H2O, Yb(NO3)3·5H2O, Er(NO3)3·5H2O, NaF, and 3-aminopropyltrimethoxysilane were all purchased from Sigma-Aldrich (St. Louis, MO, USA). PAA and PEI were obtained from Aladdin Reagent Co. Ltd (Shanghai, China). PVP was bought from J&K Scientific Ltd (Beijing China). All other chemicals were purchased from Sinopharm Chemical Reagent Co., Ltd (Shanghai, China). All reagents were of analytical grade and used without further purification.Characterization
Scanning electron microscopy (SEM) measurements were performed on a field emission scanning electron microscope (JEOL JSM-7500F). X-ray diffraction (XRD) measurements of the dry powder were performed on a RIGAKU D/MAX 2500 X-ray diffractometer (Japan) using Cu-Kα radiation by depositing powder on a glass substrate from 2θ = 10° up to 60° with a 0.5° increment. Fourier transform infrared spectroscopy (FT-IR) measurements were recorded using a Nicolet Avatar 370 instrument (Thermo Fisher Scientific, Inc., Waltham, MA). The ζ-potential of nanoparticles was characterized by dynamic light scattering (DLS) (Zetasizer Nano-ZS90, U.K.). Fluorescence spectroscopy measurements were performed on a Hitachi F-4600 fluorescence spectrometer (Hitachi, Ltd, Japan).Synthesis of NaYF4:Yb3+, Er3+ UCNPs
Y(NO3)3·6H2O (2.0 mL, 0.2 M), Yb(NO3)3·5H2O (0.45 mL, 0.2 M) and Er(NO3)3·5H2O (0.05 mL, 0.2 M) were successively added to 22.5 mL of trisodium citrate aqueous solution (0.05 M). Then, NaF solution (10 mL, 0.625 M) was added to the mixture after vigorous stirring for 30 min. The solution was stirred for another 1 h before the pH of mixture was adjusted to about 3 by adding dilute HNO3 solution. Afterwards, the as-obtained solution was transferred into a 50 mL autoclave and maintained at 180 °C for 6 h. Finally, the products were collected by centrifugation, washed with ethanol three times, and then dried in a vacuum oven at 60 °C, which was denoted as UCNP-1. The elongated UCNP-2, UCNP-3 and UCNP-4 could be obtained by changing the molar ratios of sodium citrate![[thin space (1/6-em)]](https://www.rsc.org/images/entities/char_2009.gif) :rare earth ions from the original 90:1 to 50:1, 30:1, and 10:1, respectively.
:rare earth ions from the original 90:1 to 50:1, 30:1, and 10:1, respectively.
Decoration of UCNPs with polymers
A ligand exchange method was used for the surface functionalization of UCNPs.37 Briefly, dried UCNPs (2 mg) were dispersed in 2 mL PAA aqueous solution (5 mg mL−1) and stirred overnight. The solution was centrifuged to remove unreacted reagents and the precipitate was washed with deionized water three times. The product was re-dispersed in deionized water and stored at 4 °C. The UCNPs-PEI and UCNPs-PVP were obtained by the same procedures.An optical microscope for UCNP imaging
A modified upright optical microscope (Olympus, Japan) was utilized for the single-particle imaging experiments. The laser beam from a fiber-coupled 980 nm cw laser was expanded with a collimating lens and projected to the back port of the filter cube. The light was then reflected by a short-pass dichroic mirror and focused at the back focal plane of the objective. The emitted fluorescence from the UCNPs was collected by the objective and filtered with a band-pass filter. A Hamamatsu sCMOS camera was used to capture the image for the single-particle imaging experiments. All data were analyzed using ImageJ (http://rsbweb.nih.gov/ij/).Cytotoxicity assay
The cytotoxicity assay of PAA-, PVP-, and PEI-capped UCNPs was conducted using the MTT (3-(4,5-dimethylthiazol-2-yl)-2,5-diphenyltetrazolium bromide, a tetrazole) test. HeLa cells were seeded in 96-well plates with a density of 3 × 10⁴ cells per well and cultured for 8 h under the conditions of 37 °C and 5% CO2. After being washed with PBS, the cells were cultured with various concentrations of PAA-, PVP-, and PEI-coated UCNPs (0, 1, 2, 4, 8, 16, 32, 64, 125, 250, 500, and 1000 μg mL−1). After incubation for 24 h, the culture medium was discarded and MTT solution (20 μL, 5 mg mL−1) was added to each well for another 4 h. Then the supernatant was removed from each well and 100 μL DMSO was added. Cell viability was measured using a microplate reader at a wavelength of 490 nm.Cellular uptake experiments
HeLa cells were firstly cultured in Dulbecco's modified Eagle's medium (DMEM) containing 10% fetal bovine serum (FBS) under the conditions of 37 °C and 5% CO2. Then the cells were seeded on a glass slide in a Petri dish and cultured overnight to reach an appropriate cell density.For cellular uptake experiments, the culture medium in the Petri dish was removed and the cells were washed three times with PBS. Polymer-coated UCNPs with different morphologies were dispersed in DMEM (0.04 mg mL−1) and then these solutions were subsequently co-incubated with the cells for 4 h at 37 and 4 °C, respectively. Prior to fluorescence imaging experiments, the medium was removed and the cells were washed three times with PBS buffer to remove non-specifically bound UCNPs on the cell surface.
For the chemical inhibitor treatment experiments, the cells in Petri dishes were incubated for 1 h after being treated with dynasore (20 μL, 5 mM), genistein (20 μL, 15 mM) and a mixture of dynasore (20 μL, 5 mM) and genistein (20 μL, 15 mM), respectively. The redundant reagents were removed by washing cells three times with PBS. After retreatment with the above reagents, the cells were co-incubated with four types of UCNPs-PEI (20 μL, 0.4 mg mL−1) for 2 h, respectively, before fluorescence microscopy imaging.
Results and discussion
Synthesis and characterization of UCNPs with different morphologies
Recently, a range of approaches have been developed to prepare lanthanide-doped UCNPs.38,39 Among these approaches, thermolysis has been most widely employed to yield high-quality UCNPs of a narrow size distribution, good crystallinity and outstanding optical properties.40 However, this method suffers from some drawbacks that limit its further applications, such as harsh reaction conditions, hazardous precursors, toxic byproducts and low upconversion quantum yield.40,41 In contrast, a hydrothermal method displays the advantages of facile reaction conditions and non-toxicity. More importantly, the resultant product tends to exhibit a well-controlled crystal phase, size and shape, and hence hydrothermal methods are considered to be an ideal alternative to other conventional methods.42,43In this work, the NaYF4:Yb3+, Er3+ UCNPs were synthesized through a modified hydrothermal method according to previously reported procedures, in which sodium citrate was served as the protective agent.44,45Fig. 1a shows the scanning electron microscopy (SEM) images of the synthesized UCNPs with desirable uniformity and mono-dispersibility. Apparently, by adjusting the dosage of sodium citrate, four kinds of UCNPs with varying sizes and shapes were readily obtained. In detail, when the molar ratio of sodium citrate and rare earth elements is 90:1, the UCNPs display a 2-D hexagonal thin slice-like symmetry structure (diameter = 375 nm, UCNPs-1). By reducing the ratio to 50:1 and 30:1, another two kinds of nanoparticles were acquired, UCNPs-2 and -3, which show typical a 3-D hexagonal column structure with identical diameters (500 nm) but with different lengths (200 and 650 nm, respectively). The morphology of the nanoparticles changed to a long rod shape when the molar ratio became 10:1 (UCNPs-4). As confirmed by the XRD patterns in Fig. S1,† the products are single phase hexagonal NaYF4 (PDF no. 16-0334). Two emission peaks at 550 and 670 nm were noted in the fluorescence spectra of UCNPs-1, -2, -3 and -4 under 980 nm excitation, Fig. S2.† Apparently, despite the differences in the shapes of the nanoparticles, the fluorescence spectra of UCNPs still remain constant.
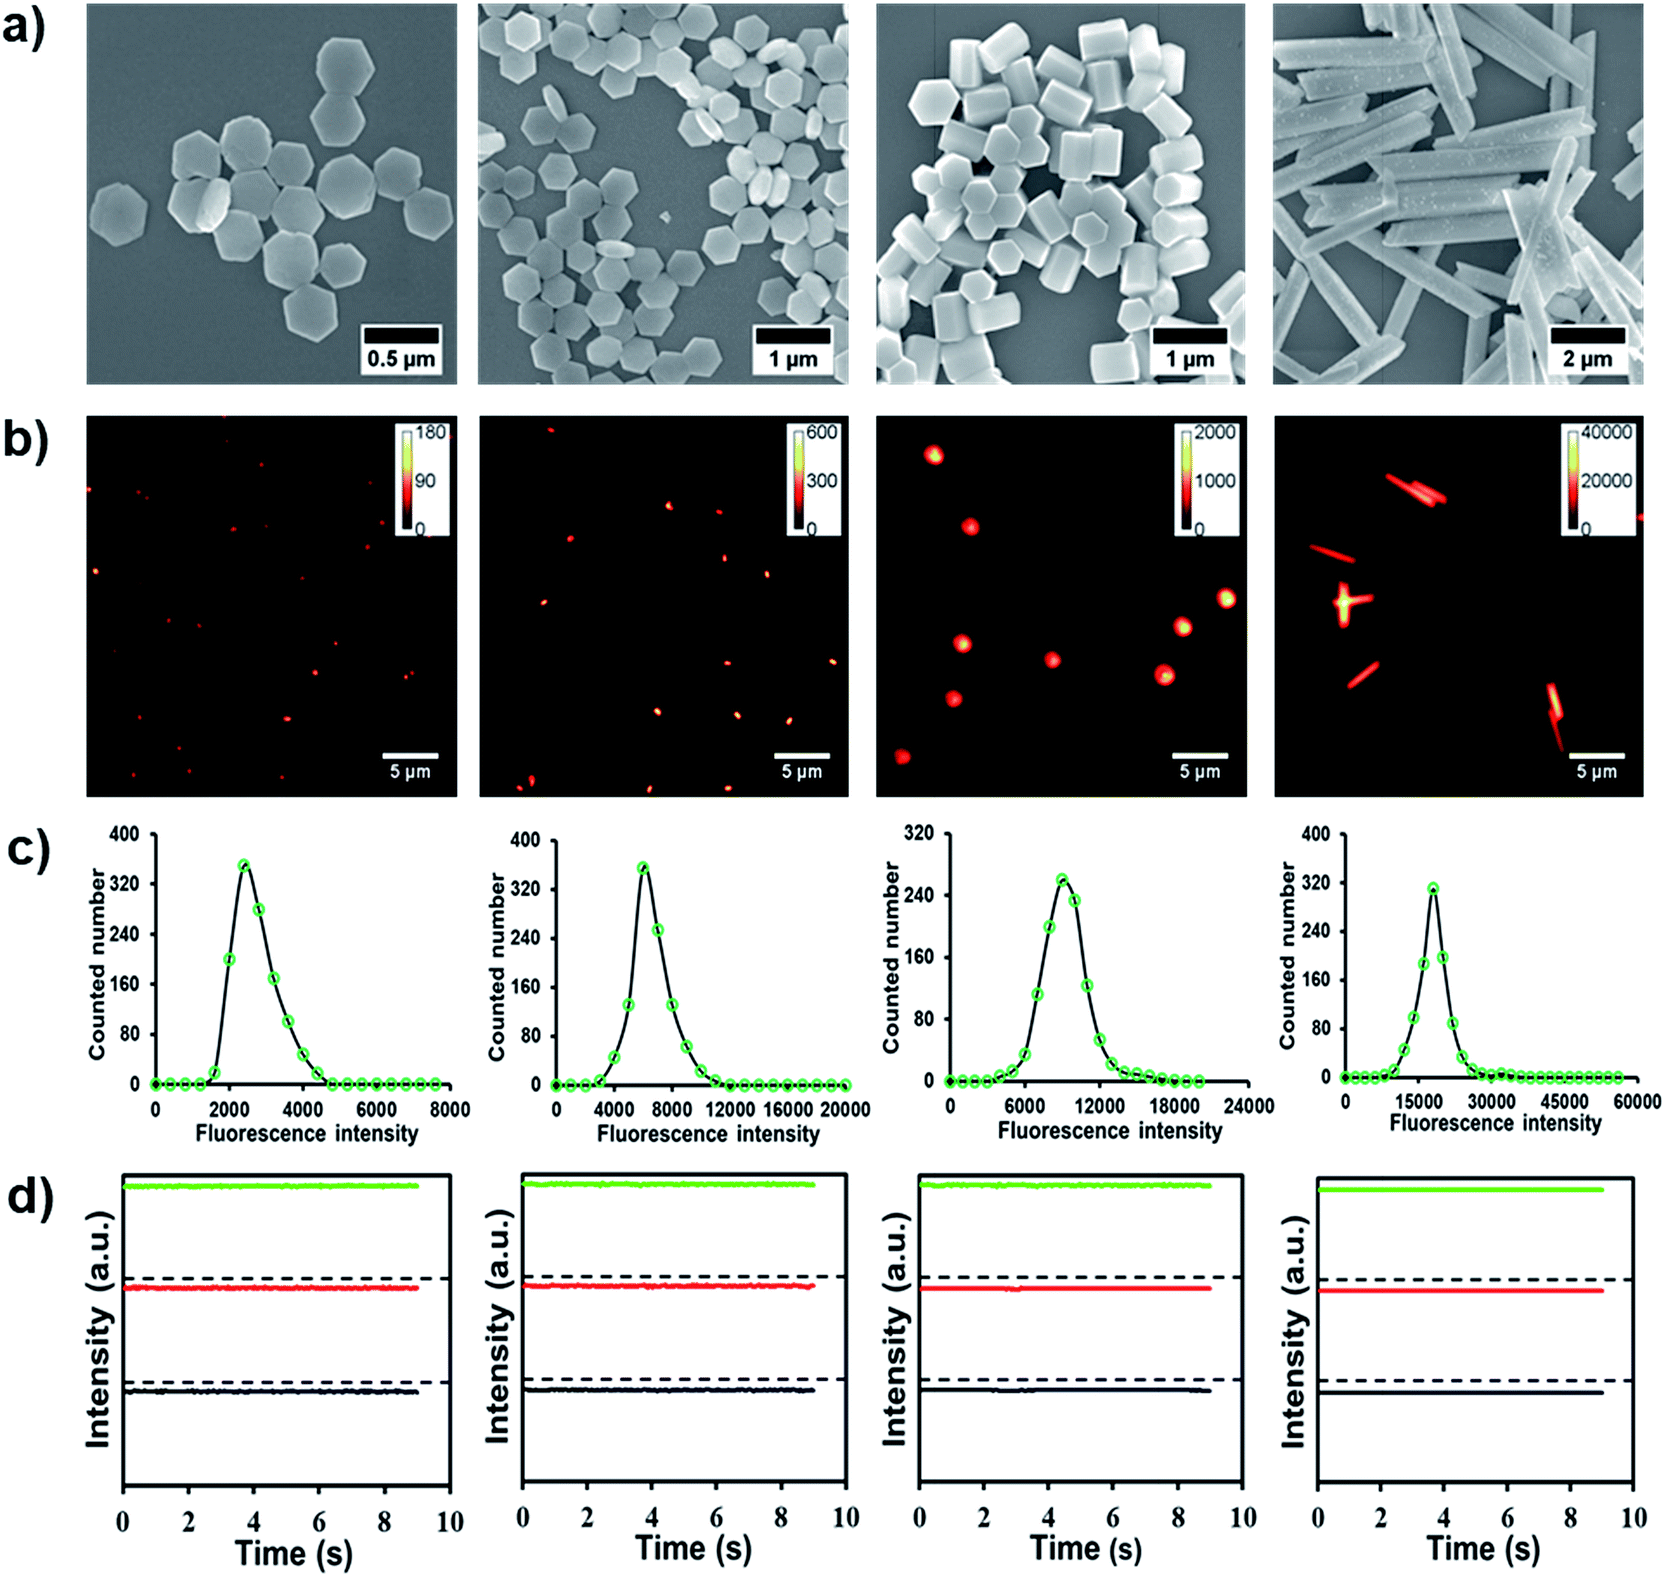 | ||
| Fig. 1 (a and b) are the SEM and single-particle fluorescence microscopy images of UCNPs-1, -2, -3 and -4. (c) Fluorescence intensity distribution histograms of the corresponding UCNPs. (d) Representative single-particle fluorescence intensity tracks as a function of time in (b). | ||
Since the fluorescence property is essential for the subsequent cellular imaging, we next explore the optical characteristics of UCNPs at the single-particle level. Typical epi-fluorescence images of UCNPs on the cover glass surface are shown in Fig. 1b. The UCNPs as-prepared in this work are well-dispersed. The brightness is a key parameter to evaluate the potency of the nanoparticle for cellular tracking and imaging. Therefore, single-particle fluorescence intensities of UCNPs-1, -2, -3 and -4 were further analyzed and are depicted in Fig. 1c. As shown in the statistically analyzed single-particle intensity histogram, the fluorescence intensity of UCNPs with different morphologies showed good Gaussian distribution and increased gradually with size, which was consistent with the size increment as shown in Fig. 1a. In addition to the brightness assay, the photostability of these UCNPs at the single-particle level is another important argument, which may lead to degrading signal-to-noise ratios and thus harming the spatial localization as well as temporal resolution. We then monitored the fluorescence stability of the four kinds of UCNPs. Representative fluorescence intensity tracks as a function of time from individual spots in the fluorescence images are shown in Fig. 1d. Evidently, the four kinds of UCNPs exhibit neither photobleaching nor photoblinking within the observation window, further demonstrating their good optical stability for single-particle imaging.
The cytotoxicity of polymer-coated UCNPs
As noted before, the surface charge of nanoparticles is one of the essential factors regulating their cellular translocation process. In this regard, PAA, PVP and PEI were chosen to endow the UCNPs with different surface charges for their distinctive hydrophilic properties, variety in active groups and outstanding biocompatibility.46,47 As shown in Fig. 2a–d, the zeta potentials of the four kinds of UCNPs were significantly altered after the ligand exchange process. UCNPs-PAA and -PEI show obviously negative and positive ζ-potentials, respectively, which can be interpreted as the consequence of the ionization processes of carboxyl and amino groups from PAA and PEI, respectively. The UCNPs-PVP with four shapes exhibit a slightly positive ζ-potential, which may be attributed to the protonation of the pyridinyl nitrogens on surface-bonded PVP moieties.47 The differences in zeta potentials supported the successful conjugation of different polymers onto their corresponding UCNPs, which was further confirmed by FT-IR spectra (Fig. S3†). It is worth noting that regardless of their morphologies, the trends of ζ-potential from these UCNPs after the surface modification are the same. Next, the optical properties of the polymer-coated UCNPs were also assessed based on the statistical fluorescence intensity analysis. As indicated in Fig. 2e–h, compared with the untreated UCNPs, the fluorescence intensity of polymer-coated UCNPs still retains a similar Gaussian distribution without apparent change in intensity, indicating that the polymer did not display influence on the fluorescence performance of UCNPs. Biocompatibility is a crucial issue that needs to be characterized prior to the cellular uptake and imaging studies. On this basis, the cytotoxicity of polymer-coated UCNPs as a function of mass concentration was evaluated by the MTT colorimetric assay after 24 h incubation. As shown in Fig. 3, only a slight decrease in cell viability was observed when the dosage of nanoparticles increased by 1000-fold. For example, about 80% of cells still survived even at a mass concentration of 1000 μg mL−1, which is much higher than the dosage used for the cellular uptake experiments. It is worth noting that the cell viability at the same mass concentrations is almost the same among the particles with different sizes and surface charges, suggesting the good biocompatibility of the UCNPs.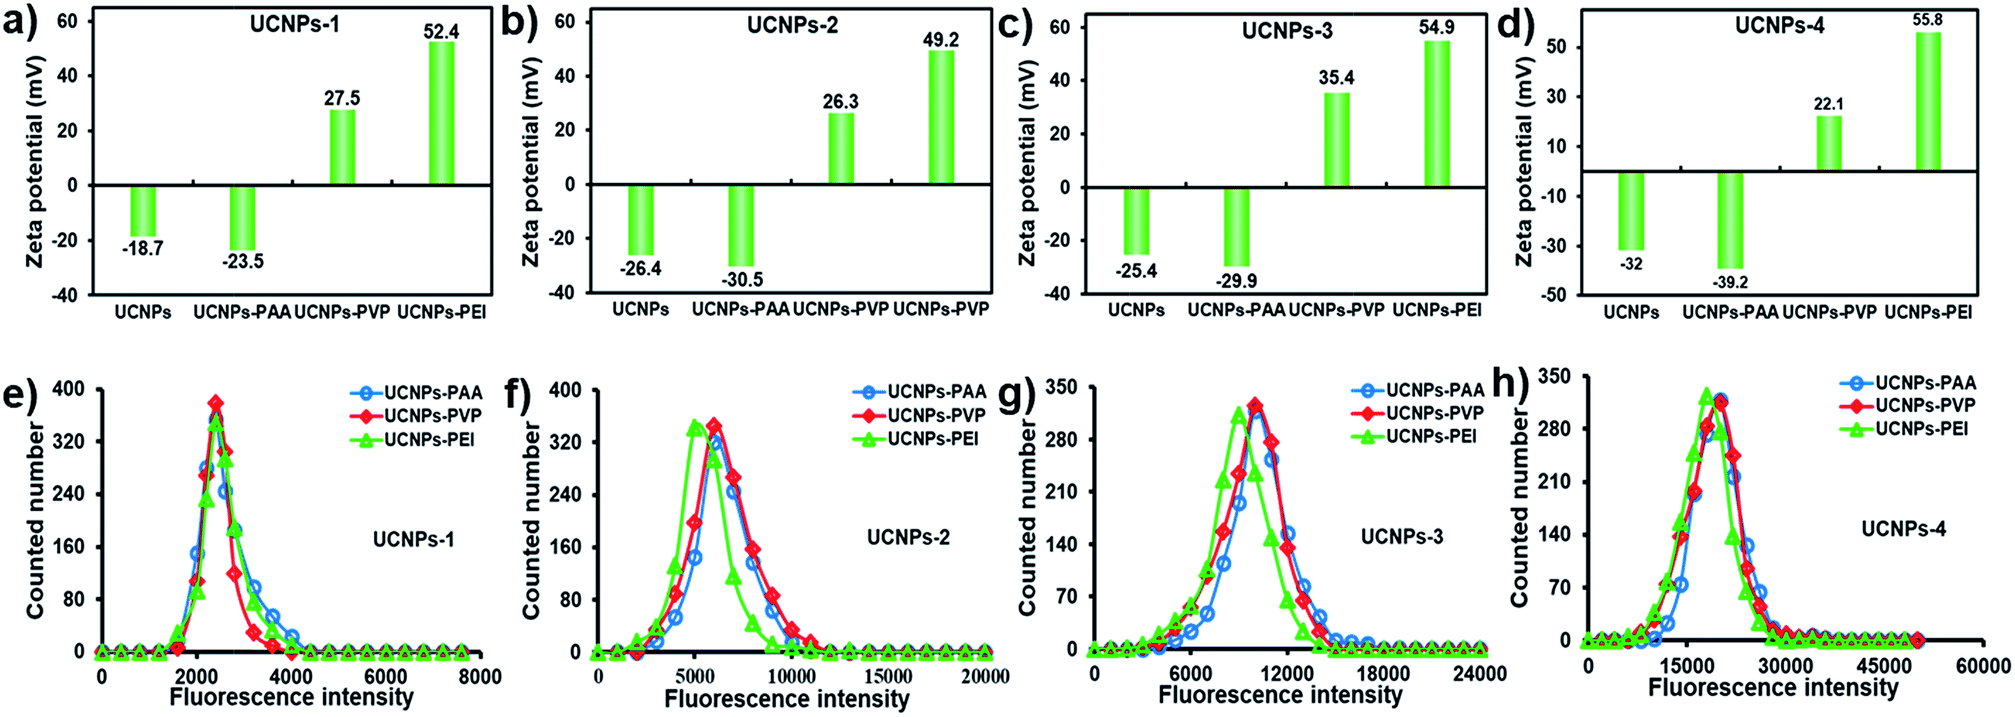 | ||
| Fig. 2 ζ-Potential (a–d) and single-particle fluorescence intensity distribution histograms (e–h) of polymer-coated UCNPs-1, -2, -3 and -4. | ||
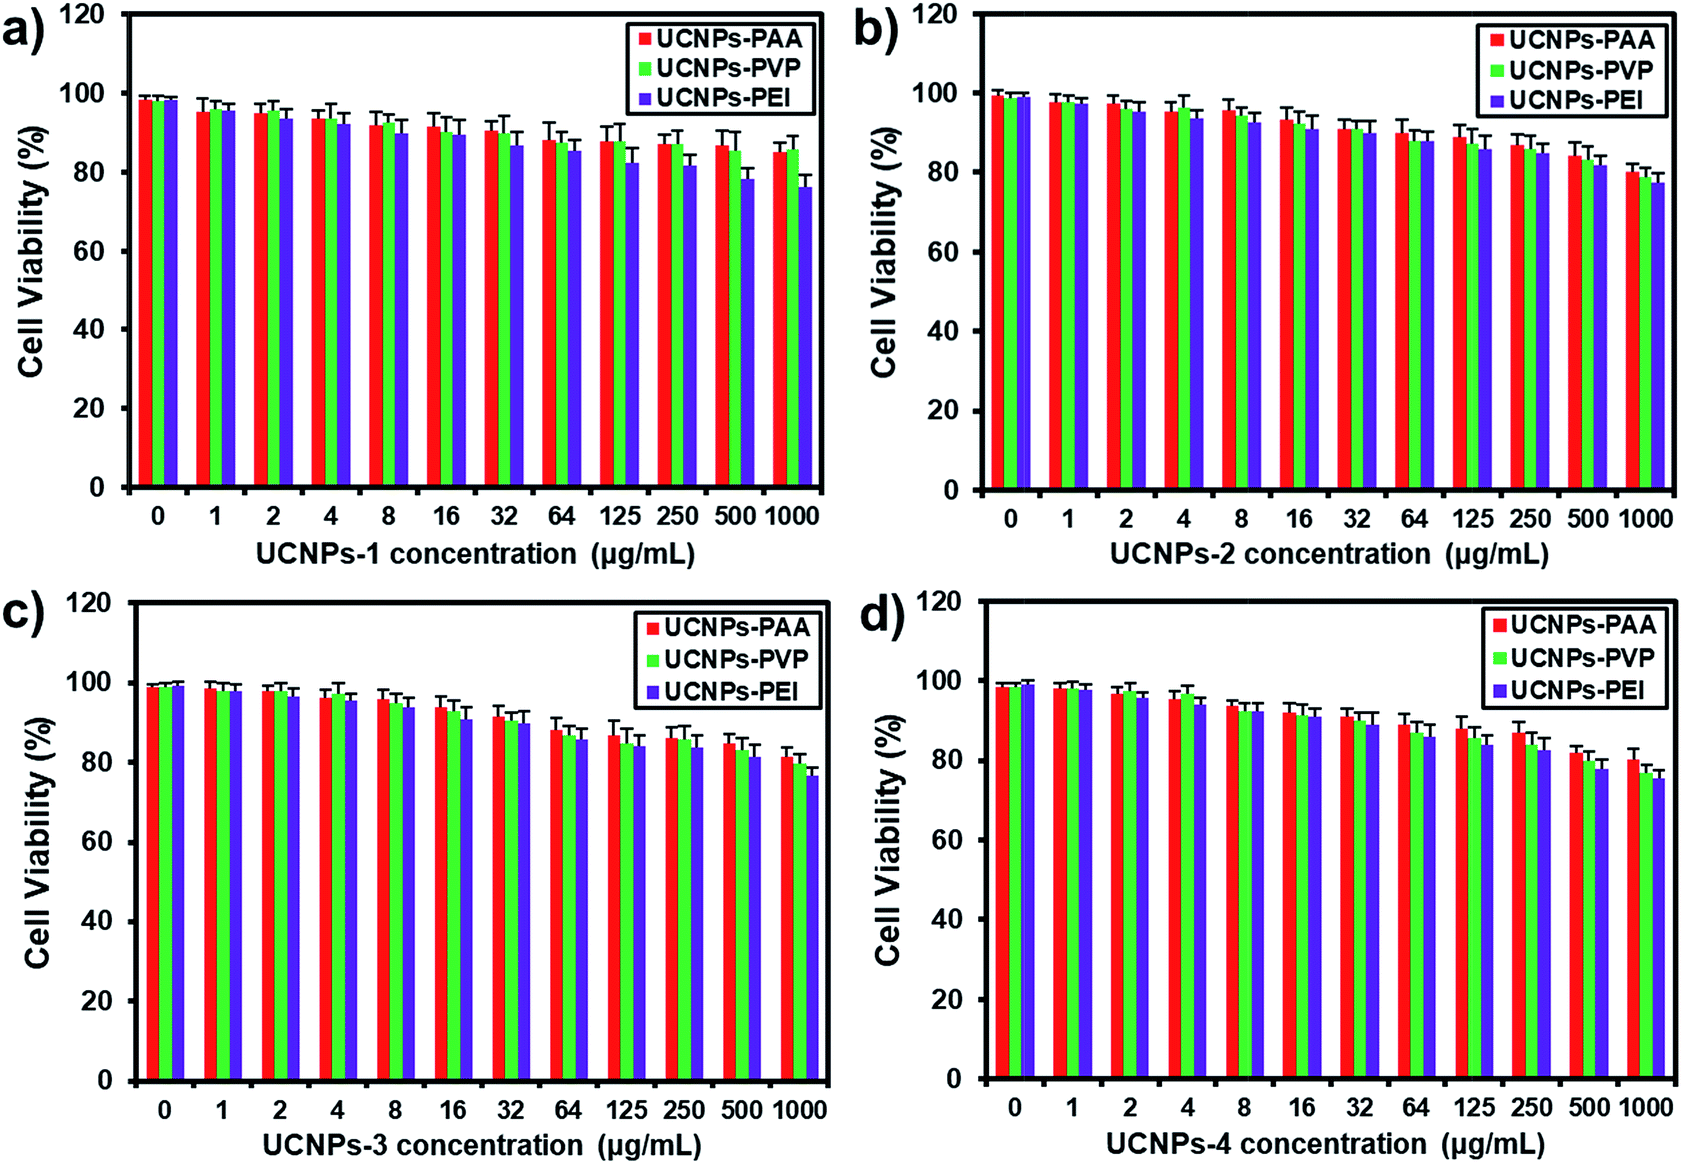 | ||
| Fig. 3 Relative cell viability of HeLa cells after being treated with different polymer-modified (a) UCNPs-1, (b) UCNPs-2, (c) UCNPs-3 and (d) UCNPs-4 with concentrations ranging from 0 to 1000 μg mL−1 for 24 h. | ||
Surface charge- and morphology-dependent cellular uptake process
In order to understand the effect of surface charge and morphology on the cellular internalization, UCNPs-PAA (negatively charged), -PVP (weakly positively charged) and -PEI (strongly positively charged) with various shapes were utilized to perform cellular uptake experiments. After incubation with different polymer-coated UCNPs at 37 °C for 4 h and then rinsing with PBS buffer three times, the HeLa cells were imaged with a fluorescence microscope under 980 nm excitation.Representative microscopy images are shown in Fig. 4. Because of the superior fluorescence stability and mono-dispensability of these UCNPs in physiological buffer, the amount of particles inside the living cell could be statistically analyzed through the equation N = Ft/Fs, where N is the number of particles inside the cell, Ft is the whole fluorescence intensity from the individual cell, and Fs is the measured fluorescence intensity from a single particle under the same imaging condition. The statistically counted number from single cells is plotted in Fig. 5a.
 | ||
| Fig. 4 The fluorescence microscopy characterization of HeLa cells co-cultured with polymer-modified (a) UCNPs-1, (b) UCNPs-2, (c) UCNPs-3 and (d) UCNPs-4 at 37 °C for 4 h. The images from left to right are the bright-field, fluorescence and merged microscopy images, respectively. | ||
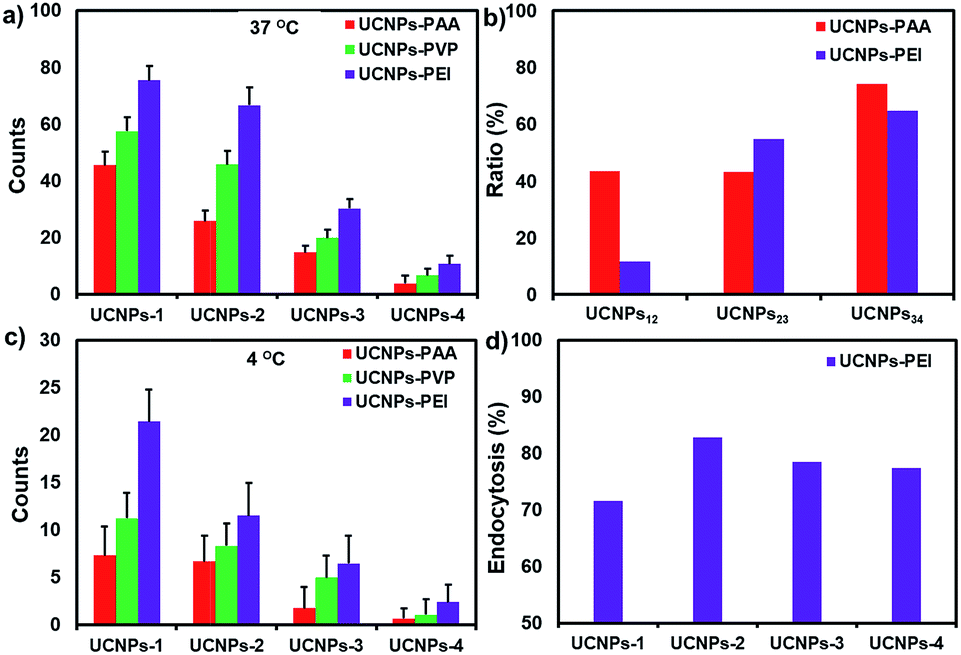 | ||
| Fig. 5 (a and c) are the statistically counted number of UCNPs from single cells at 37 and 4 °C, respectively. (b) The decreased percentage of UCNPs-PAA and -PEI at 37 °C when the size of the particle gradually grows. For example, UCNPs12 represents the decreased portion of particles when the shape of the nanoparticle changes from UCNPs-1 to -2. (d) The fraction of the contribution from the endocytosis process for UCNPs-PEI with different sizes. | ||
Apparently, whatever morphologies they are, the dosage of UCNPs-PEI within HeLa cells is the highest. The order of cellular uptake efficiency was UCNPs-PEI > UCNPs-PVP > UCNPs-PAA, indicating that the positively charged nanoparticles are more favourably taken up by cells. It is largely ascribed to the electrostatic attraction between the nanoparticles and negatively charged cytoplasmic membrane, which may be the primary driving force to regulate the cellular uptake of nanoparticles.
Because of the highest translocation efficiency, taking UCNPs-PEI as a model, we further explored the morphology effect on the cellular internalization efficiency. As shown in Fig. S4,† the uptake dosage of UCNPs-PEI-1 with a 2-D hexagonal structure (a plate) is noticeably higher than those with 3-D structures. Among the three UCNPs-PEI groups with 3-D structures, the internalization efficiency is quite varied from each other. Specifically, although UCNPs-PEI-2 and UCNPs-PEI-3 display similar shapes and cross-sectional areas (0.184 × 10⁻³ μm2 and 0.158 × 10⁻³ μm2, respectively), the uptake dosage of UCNPs-PEI-2 is twice over that of UCNPs-PEI-3. The rod-shaped UCNPs-PEI-4 displayed the lowest internalization efficiency compared with the other types of UCNPs-PEI. These observations demonstrate that the cellular translocation efficiency reduces gradually with the increase of nanoparticle size in the aspect of particle number.
Through calculating the surface-to-volume ratio (S/V), it was found that the uptake amount of UCNPs decreases with the decline of the particle surface-to-volume ratio in the case of nanoparticles with 3-D structures. (S/VUCNPs-2 = 19.78; S/VUCNPs-3 = 12.60; S/VUCNPs-4 = 6.11, respectively). This phenomenon is in good agreement with the above observation that the nanoparticles with relatively small size (volume) are liable to enter cells. A conceivable explanation for these results is that large-sized nanoparticles require stronger driving force and additional energy in the cellular uptake process.48 Nanoparticles with larger surface-to-volume ratios possess more effective surface areas for contact with cell membrane, which is beneficial for their cellular internalization.
Additionally, we found that in the process of converting nanoparticle morphology from 2- (i.e., UCNPs-1) to 3-D (i.e., UCNPs-2), the uptake dosage of positively charged nanoparticles (UCNPs-PEI) exhibited only about an 11.6% decline, while that of negatively charged nanoparticles (UCNPs-PAA) decreased by 43.5%. Further increasing the size of nanoparticles (UCNPs-3 and -4), a comparably sharp decline in the uptake efficiency was observed from both positively and negatively charged particles (Fig. 5b). Combined with these observations, it can be concluded that physical adhesion (i.e., electrostatic association) is the initial and primary impetus for small size nanoparticles during the translocation process. Whereas, when the size of the particle grows, the role of charge is diminished and particle morphology becomes the major modulation factor during the cellular uptake process.
Temperature-modulated cellular uptake process
A thorough understanding of the cellular uptake mechanisms is important for the design of nanocargos.49 To further reveal the detailed effects of energy-dependent endocytosis on the nanoparticles with different morphologies, the polymer-UCNPs were cultured with HeLa cells at 4 °C to block the energy-dependent endocytosis. A noticeable difference in the fluorescence intensity was detected between the two sets of experiments, i.e., 37 and 4 °C, respectively (Fig. 4 and 6). At 4 °C, few UCNPs could still enter the cells, demonstrating that multiplexed mechanisms are involved in the cellular uptake process, such as endocytosis, physical adhesion and then penetration. | ||
| Fig. 6 The fluorescence microscopy characterization of HeLa cells co-cultured with polymer-modified (a) UCNPs-1, (b) UCNPs-2, (c) UCNPs-3 and (d) UCNPs-4 at 4 °C for 4 h. The images from left to right are the bright-field, fluorescence and merged microscopy images, respectively. | ||
The quantitative statistics of nanoparticles within cells according to the fluorescence intensity analysis is shown in Fig. 5c. Compared with the results at 37 °C, the cellular uptake amount of UCNPs-PEI-1 with a 2-D structure at 4 °C declined to 71.5%, while that of the other 3-D UCNPs-PEI materials dropped to around 80%, indicating that the cellular uptake of UCNPs-PEI-1 is less affected by temperature over other size particles (Fig. 5d). According to the above results, it could be concluded that, on the consideration of the non-endocytosis process, physical association plays a more important role in the cellular internalization for 2-D nanoparticles in comparison with other larger positively charged nanoparticles. In addition, among the UCNPs with the same shape, positive nanoparticles (UCNPs-PEI) were still superior in intracellular translocation.
Effects of chemical inhibitors on the cellular internalization of positively charged UCNPs
Clathrin- and caveolae-mediated endocytosis processes are the most extensively studied endocytosis pathways for non-phagocytic eukaryotic cells. On this account, we further cultured HeLa cells with dynasore (an inhibitor of dynamin) and genistein (an inhibitor of tyrosine protein kinase) to study the detailed roles of the endocytosis process on the positively charged nanoparticles with different sizes. As shown in Fig. 7 and S5,† the cellular internalization amount of UCNPs-PEI was significantly decreased when the cells were pretreated with the above two chemical inhibitors, respectively. No discernible difference was found when the cells were treated with either dynasore or genistein (row 2 and 3 in Fig. 7), indicating that the two pathways may share an equal role in the cellular translocation process. Whilst, a weak green fluorescence signal could still be detected in HeLa cells when the two reagents coexist, suggesting that other mechanisms should be involved in this process, such as macropinocytosis and clathrin- and caveolae-independent endocytosis.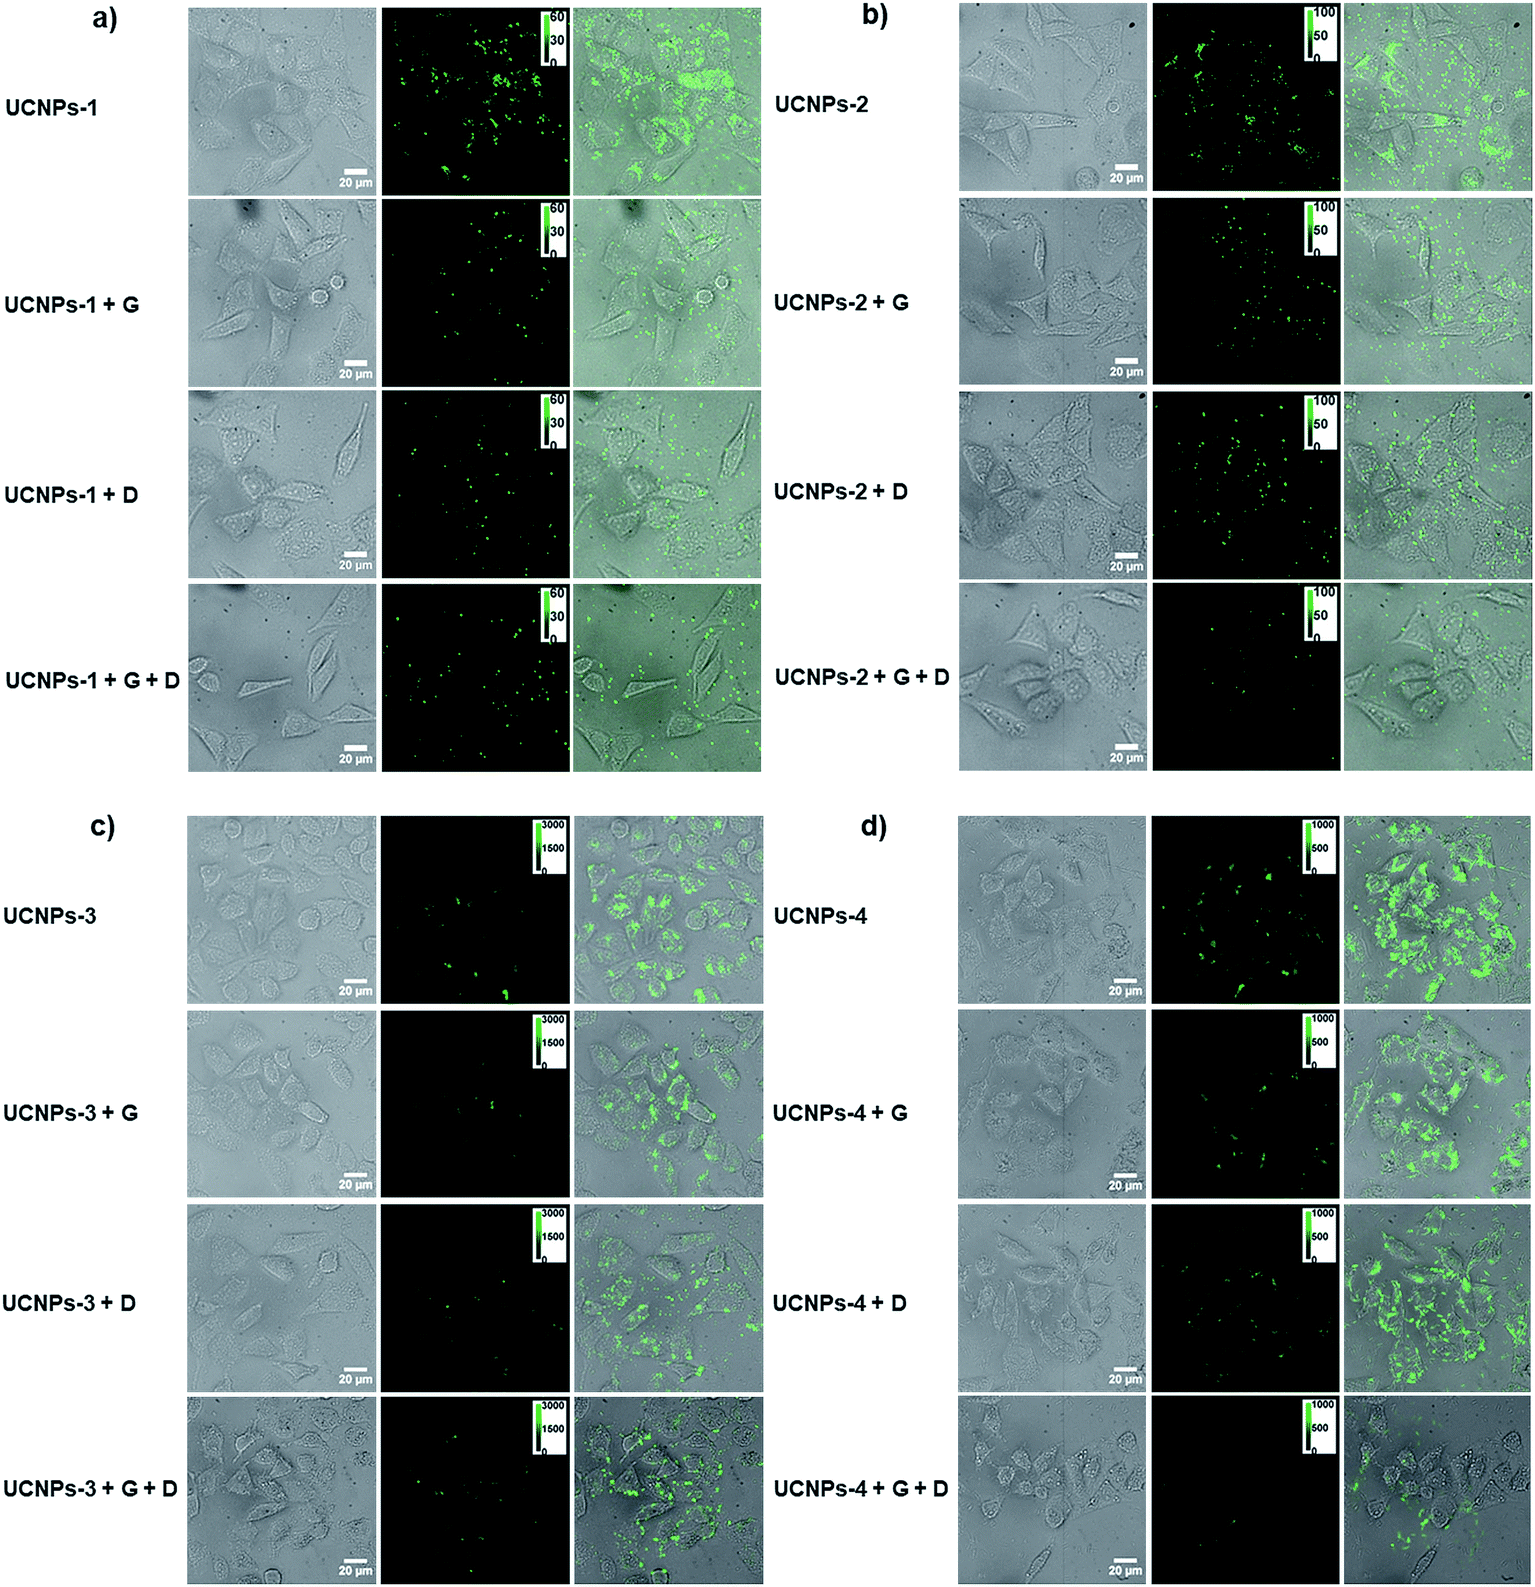 | ||
| Fig. 7 The fluorescence microscopy images of HeLa cells co-cultured with (a) UCNPs-PEI-1, (b) UCNPs-PEI-2, (c) UCNPs-PEI-3 and (d) UCNPs-PEI-4 for 2 h at 37 °C without drug treatment (first row), with genistein (second row), dynasore (third row), and both of them (last row), respectively. The images from left to right are the bright-field, fluorescence and merged microscopy images, respectively. | ||
Conclusions
In summary, in this work, the effects of surface charge and morphology on the cellular uptake kinetics of 2- and 3-D nanostructures were extensively explored with single-particle optical microscopy. Four kinds of NaYF4:Yb3+, Er3+ nanostructures with 2- and 3-D morphologies (specifically, with the same cross-section and different lengths) were synthesized. By taking advantage of the superior optical properties of UCNPs, the nanoparticles inside the living cells could be readily analyzed without any background noise from the cellular substrate. According to the fluorescence microscopy imaging results, it was found that: (1) the nanostructures with positive surface charge and large surface-to-volume ratios (with the same cross-sectional area) exhibited higher efficiency for cellular uptake. Physical adhesion (i.e., electrostatic association) is the initial and primary impetus for small size nanoparticles during the translocation process; (2) when the size of the particle grows, the role of surface charge is weakened and particle morphology becomes the major modulation factor during the cellular uptake process; (3) multiplexed mechanisms involved in the cellular uptake process, such as endocytosis, physical adhesion. Clathrin- and caveolae-mediated endocytosis processes are the essential routes on the aspect of energy-dependent process. These findings would provide important guidance for the design of nanosystems for functional material translocation.Conflicts of interest
There are no conflicts to declare.Acknowledgements
This work was supported by the National Natural Science Foundation of China (NSFC, Project no. 21522502), the Excellent Youth Scholars of Hunan Provincial Education Department (17B155) and the Opening Fund of Key Laboratory of Chemical Biology and Traditional Chinese Medicine Research (Ministry of Education of China), Hunan Normal University.Notes and references
- D. W. J. Stark, Angew. Chem., Int. Ed., 2011, 50, 1242–1258 CrossRef PubMed.
- L. Wei, Y. Ma, X. Shi, Y. Wang, X. Su, C. Yu, S. Xiang, L. Xiao and B. Chen, J. Mater. Chem. B, 2017, 5, 3383–3390 RSC.
- Y. Ma, Z. Zhang, Y. Xu, M. Ma, B. Chen, L. Wei and L. Xiao, Talanta, 2016, 161, 476–481 CrossRef PubMed.
- Q. Yang, Z. Ye, M. Zhong, C. Bo, C. Jian, R. Zeng, W. Lin, H. Li and L. Xiao, ACS Appl. Mater. Interfaces, 2016, 8, 9629–9634 Search PubMed.
- J. A. Hubbell and A. Chilkoti, Science, 2012, 337, 303–305 CrossRef PubMed.
- C. Guo, M. Xu, S. Xu and L. Wang, Nanoscale, 2017, 9, 7163–7168 RSC.
- W. Luo, M. Wu, S. Li, Y. Xu, Z. Ye, L. Wei, B. Chen, Q. H. Xu and L. Xiao, Anal. Chem., 2016, 88, 6827–6835 CrossRef PubMed.
- X. Dong, J. Yang, L. Lou, Y. Zhang, C. Mao, Y. Sun, H. Lei, Y. Shen, R. C. Beier and Z. Xu, Biosens. Bioelectron., 2017, 98, 305–309 CrossRef PubMed.
- H. Yue, X. Zhou, M. Cheng and D. Xing, Nanoscale, 2018, 10, 1063–1071 RSC.
- A. C. Wong and D. W. Wright, Small, 2016, 12, 5592–5600 CrossRef PubMed.
- Z. Zhang, D. Zhang, L. Wei, X. Wang, Y. Xu, H. W. Li, M. Ma, B. Chen and L. Xiao, Colloids Surf., B, 2017, 159, 905–912 CrossRef PubMed.
- A. Rajala, Y. Wang, Y. Zhu, M. Ranjobishop, J. X. Ma, C. Mao and R. V. Raju, Nano Lett., 2014, 14, 5257–5263 CrossRef PubMed.
- S. E. A. Gratton, P. A. Ropp, P. D. Pohlhaus, J. C. Luft, V. J. Madden, M. E. Napier and J. M. Desimone, Proc. Natl. Acad. Sci. U. S. A., 2008, 105, 11613–11618 CrossRef PubMed.
- A. Albanese, P. S. Tang and W. C. W. Chan, Annu. Rev. Biomed. Eng., 2012, 14, 1–16 CrossRef PubMed.
- H. Herd, N. Daum, A. T. Jones, H. Huwer, H. Ghandehari and C. M. Lehr, ACS Nano, 2013, 7, 1961–1973 CrossRef PubMed.
- B. D. Chithrani, A. A. Ghazani and W. C. W. Chan, Nano Lett., 2006, 6, 662–668 CrossRef PubMed.
- E. C. Cho, L. Au, Q. Zhang and Y. Xia, Small, 2010, 6, 517–522 CrossRef PubMed.
- E. Oh, J. Delehanty, K. E. Sapsford, K. Susumu, R. Goswami, J. B. Blancocanosa, P. E. Dawson, J. Granek, M. Shoff and Q. Zhang, ACS Nano, 2011, 5, 6434–6448 CrossRef PubMed.
- F. Lu, S. H. Wu, Y. Hung and C. Y. Mou, Small, 2009, 5, 1408–1413 CrossRef PubMed.
- K. Y. Win and S. S. Feng, Biomaterials, 2005, 26, 2713–2722 CrossRef PubMed.
- S. A. Kulkarni and S. S. Feng, Pharm. Res., 2013, 30, 2512–2522 CrossRef PubMed.
- J. Zhou, Z. Liu and F. Li, Chem. Soc. Rev., 2012, 41, 1323–1349 RSC.
- F. Wang, D. Banerjee, Y. Liu, X. Chen and X. Liu, Analyst, 2010, 135, 1839–1854 RSC.
- G. Tian, Z. Gu, L. Zhou, W. Yin, X. Liu, L. Yan, S. Jin, W. Ren, G. Xing and S. Li, Adv. Mater., 2012, 24, 1226–1231 CrossRef PubMed.
- L. He, L. Feng, L. Cheng, Y. Liu, Z. Li, R. Peng, Y. Li, L. Guo and Z. Liu, ACS Appl. Mater. Interfaces, 2013, 5, 10381–10388 Search PubMed.
- S. Han, A. Samanta, X. Xie, L. Huang, J. Peng, S. J. Park, D. B. L. Teh, Y. Choi, Y. T. Chang, A. H. All, Y. Yang, B. Xing and X. Liu, Adv. Mater., 2017, 29, 1700244 CrossRef PubMed.
- G. Jalani, R. Naccache, D. H. Rosenzweig, L. Haglund, F. Vetrone and M. Cerruti, J. Am. Chem. Soc., 2015, 138, 1078–1083 CrossRef PubMed.
- B. Zhou, B. Shi, D. Jin and X. Liu, Nat. Nanotechnol., 2015, 10, 924–936 CrossRef PubMed.
- Z. Chen, H. Chen, H. Hu, M. Yu, F. Li, Q. Zhang, Z. Zhou, T. Yi and C. Huang, J. Am. Chem. Soc., 2008, 130, 3023–3029 CrossRef PubMed.
- L. Wang, R. Yan, Z. Huo, L. Wang, J. Zeng, J. Bao, X. Wang, Q. Peng and Y. Li, Angew. Chem., Int. Ed., 2005, 44, 6054–6057 CrossRef PubMed.
- Y. Dai, H. Xiao, J. Liu, Q. Yuan, P. Ma, D. Yang, C. Li, Z. Cheng, Z. Hou and P. Yang, J. Am. Chem. Soc., 2013, 135, 18920–18929 CrossRef PubMed.
- Q. Xing, N. Li, Y. Jiao, D. Chen, J. Xu, Q. Xu and J. Lu, RSC Adv., 2015, 5, 5269–5276 RSC.
- L. Wang, H. Dong, Y. Li, C. Xue, L. D. Sun, C. H. Yan and Q. Li, J. Am. Chem. Soc., 2014, 136, 4480–4483 CrossRef PubMed.
- L. D. Sun, Y. Wang and C. H. Yan, Acc. Chem. Res., 2014, 47, 1001–1009 CrossRef PubMed.
- L. Rao, L.-L. Bu, B. Cai, J.-H. Xu, A. Li, W.-F. Zhang, Z.-J. Sun, S.-S. Guo, W. Liu, T.-H. Wang and X.-Z. Zhao, Adv. Mater., 2016, 28, 3460–3466 CrossRef PubMed.
- F. Wang, Y. Han, C. S. Lim, Y. Lu, J. Wang, J. Xu, H. Chen, C. Zhang, M. Hong and X. Liu, Nature, 2010, 463, 1061–1065 CrossRef PubMed.
- W. Cui, S. Ni, S. Shan and X. Zhou, World J. Nano Sci. Eng., 2012, 2, 41–46 CrossRef.
- H. T. Wong, M. K. Tsang, C. F. Chan, K. L. Wong, B. Fei and J. Hao, Nanoscale, 2013, 5, 3465–3473 RSC.
- M. V. Dacosta, S. Doughan, Y. Han and U. J. Krull, Anal. Chim. Acta, 2014, 832, 1–33 CrossRef PubMed.
- G. Chen, H. Qiu, P. N. Prasad and X. Chen, Chem. Rev., 2014, 114, 5161–5214 CrossRef PubMed.
- D. Yin, K. Song, Y. Ou, C. Wang, B. Liu and M. Wu, J. Nanosci. Nanotechnol., 2013, 13, 4162–4167 CrossRef PubMed.
- L. Wang and Y. Li, Chem. Mater., 2007, 19, 727–734 CrossRef.
- Y. Huang, H. You, G. Jia, Y. Zheng, Y. Song, Y. Mei, L. Kai and L. Zhang, J. Phys. Chem. C, 2009, 113, 16962–16968 Search PubMed.
- J. Zhou, G. Chen, E. Wu, G. Bi, B. Tao, Y. Teng, S. Zhou and J. Qiu, Nano Lett., 2013, 13, 2241–2246 CrossRef PubMed.
- P. Chen, M. Song, E. Wu, B. Wu, J. Zhou, H. Zeng, X. Liu and J. Qiu, Nanoscale, 2015, 7, 6462–6466 RSC.
- M. Wang, C. C. Mi, J. L. Liu, X. L. Wu, Y. X. Zhang, W. Hou, F. Li and S. K. Xu, J. Alloys Compd., 2009, 485, L24–L27 CrossRef.
- J. Jin, Y. J. Gu, W. Y. Man, J. Cheng, Z. Xu, Y. Zhang, H. Wang, H. Y. Lee, S. H. Cheng and W. T. Wong, ACS Nano, 2011, 5, 7838–7847 CrossRef PubMed.
- C. He, Y. Hu, L. Yin, C. Tang and C. Yin, Biomaterials, 2010, 31, 3657–3666 CrossRef PubMed.
- B. D. Chithrani and W. C. Chan, Nano Lett., 2007, 7, 1542–1550 CrossRef PubMed.
Footnotes |
| † Electronic supplementary information (ESI) available. See DOI: 10.1039/c8sc01828f |
| ‡ These authors contributed equally to this work. |
| This journal is © The Royal Society of Chemistry 2018 |