
 Open Access Article
 This Open Access Article is licensed under a Creative Commons Attribution-Non Commercial 3.0 Unported Licence
Discrimination of saturated alkanes and relevant volatile compounds via the utilization of a conceptual fluorescent sensor array based on organoboron-containing polymers†
Yanyu
Qi
a,
Wenjun
Xu
a,
Rui
Kang
a,
Nannan
Ding
a,
Yelei
Wang
b,
Gang
He
c and
Yu
Fang
 *a
*a
aKey Laboratory of Applied Surface and Colloid Chemistry of Ministry of Education, School of Chemistry and Chemical Engineering, Shaanxi Normal University, Xi’an 710062, P. R. China. E-mail: yfang@snnu.edu.cn
bSchool of Physics and Information Technology, Shaanxi Normal University, Xi’an 710062, P. R. China
cCenter for Materials Chemistry, Frontier Institute of Science and Technology, Xi’an Jiaotong University, Xi’an, 710054, P. R. China
First published on 5th January 2018
Abstract
This work reports a conceptual sensor array for the highly discriminative analysis of 20 clinically and environmentally relevant volatile small organic molecules (VSOMs), including saturated alkanes and common solvents, in the air at room temperature. For the construction of the sensor array, a four coordinated, non-planar mono-boron complex and four relevant polymers are synthesized. Based on the polymers and the use of different substrates, 8 fluorescent films have been fabricated. Integration of the film-based sensors results in the sensor array, which demonstrates unprecedented discriminating capability toward the VSOMs. Moreover, for the signal molecule of lung cancer, n-pentane, the response time is less than 1 s, the experimental detection limit is lower than 3.7 ppm, and after repeating the tests over 50 times no observable degradation was observed. The superior sensing performance is partially ascribed to the tetrahedral structure of the boron centers in the polymers as it may produce molecular channels in the films, which are a necessity for fast and reversible sensing. In addition, the polarity of the micro-channels may endow the films with additional selectivity towards the analytes. The design as demonstrated provides an effective strategy to improve the sensing performance of fluorescent films to very challenging analytes, such as saturated alkanes.
Introduction
Volatile small organic molecules (VSOMs) are common chemicals that are widely found in the air.1 In recent years, VSOMs have been widely used in agriculture, industry and daily life as solvents or reactive materials, and they are deemed hazardous due to their high toxicity, and in some cases carcinogenic and explosive properties, even at low concentrations.2 Furthermore, several VSOMs present in the exhaled breath of unhealthy people can be taken as signal molecules for lung cancer or other diseases.3 Moreover, some VSOMs are also signal molecules for food mildew and rotting.4 Therefore, the development of gas sensors for such molecules is of great importance for healthy lives. In fact, considerable attention has been paid to the development of these sensors.5 For example, semiconductors in nanowire, nanotube or nanoparticle states are commonly employed for the sensing of analytes in the gas phase.6 However, their performance is generally limited because of the dense packing matter, which may impede the interaction between the analyte molecules and the sensing sites of the materials. In the case of saturated alkanes, a typical class of VSOM, the sensing is even more challenging as they show little tendency to donate or extract charges from the semiconductors, which is the basis of sensing.7 Moreover, most of the sensors have to operate at relatively high temperature, which will increase power dissipation and equipment cost.8 Clearly, the sensitive, selective and fast detection of VSOMs, especially saturated alkanes, at room temperature remains a challenge.In addition to the semiconductor-based electronic sensors, gas chromatography, resistive sensors, surface acoustic wave sensors, optical sensors etc. are also used for the detection and recognition of VSOMs.9 Among these methods, optical sensors, especially fluorescence-based ones, are more attractive as they possess multiple advantages, including great sensitivity, good selectivity, low cost, ease of operation, etc.10
An applicable fluorescent sensor is generally built with a high-performance fluorescent sensing film as its key component.11 To fabricate the film, two issues need to be considered, one of which is the selection or design of a suitable sensing unit (fluorophore), and the other is the control of the internal structure of the film. The two issues are important as the first one determines the effectiveness of the interaction between the sensing unit and the analyte, and the second dominates the mass transfer process, which is a key factor that affects response speed and sensing reversibility.10a It is because of the importance of these issues that different approaches have been developed to fabricate the films in our group over a period of more than ten years,12 which mainly include conventional physical methods,13 a self-assembled mono-layers (SAMs) method,14 and a molecular gel method, etc.15 Among these techniques, fluorescent films fabricated via a molecular gel strategy may combine the merits of conventional physical methods, such as being easier to scale up, and those of the SAMs technique, such as obtaining fast and reversible responses. But the as fabricated films still suffer from some fatal problems, such as: (1) poor stability due to the presence of large cavities; (2) poor selectivity owing to the lack of the size exclusion effect, again a result of the large pores and/or large channels within the films, despite them being beneficial for fast and reversible sensing.16 This is one of the reasons why a new strategy is needed to further improve the sensing performance of fluorescent films, especially towards the VSOMs, as mentioned previously. Accordingly, we tried to fabricate fluorescent films with porosities at the molecular level, the most crucial point of which is the design of suitable sensing fluorophores.
Organoboron compounds have received increasing attention over the last few decades because of their great applications in organic light-emitting diodes (OLEDs),17 organic field-effect transistors (OFETs),18 non-linear optics (NLOs),19 organic lasers,20 fluorescence imaging,21 photo-responsive materials,22 memory devices, etc.23 Prominent examples of these compounds are four-coordinate mono-boron complexes, such as boron 8-hydroxyquinolinate complexes,24 boron dipyrromethene (BODIPY) dyes,25 boron iminocoumarins (Boricos), etc.26 It is widely recognized that the optical properties of four-coordinate organoboron complexes are strongly dependent on the structures of the chelating ligands, and thus various chelating ligands have been explored to optimize the electronic structures and properties of target complexes.27 Moreover, the s and p orbitals of boron contained in the organoboron complexes are generally sp3 hybridized and thereby the complexes display a tetrahedral geometry, which can screen dense aggregations of the compounds and produce porous internal structures at the molecular level when they aggregate, laying the foundation for the construction of stable films with good mass transfer properties.
Condensation of boron complexes with other motifs without boron atoms would result in polymers of different structures and fluorescence properties. In fact, this idea has been employed by others to create boron-containing fluorescent polymers to evaluate their applications in electronics, luminescent materials and chemical sensors.28 For example, Jäkle et al. reported the preparation of side-chain type organoboron quinolinate polymers using poly(4-dibromoborylstyrene) as a reactive polymer.29 Chujo and co-workers reported the first main-chain type organoboron quinolinate polymers, and the polymers exhibited intense green-blue photoluminescence and efficient energy migration.30 However, their sensing properties were not explored.
Based on the considerations described above, in the present work, we constructed a conceptual sensor array for the fast discrimination of VSOMs via the construction of fluorescent micro-porous films. The films were physically fabricated using four specially designed organo-boron-containing polymers (P1, P2, P3 and P4) as the sensing fluorophores. To tune the fluorescence properties of the polymers, different non-boron motifs (M1, M2, M3 or M4) were introduced as linkers through different condensation reactions (Scheme 1). Further studies demonstrated that the as developed films can be made into devices and used collectively as a sensor array, which presented an unprecedented discriminating ability towards 20 important and commonly found VSOMs, including the very challenging saturated alkanes. This paper reports the details.
 | ||
| Scheme 1 Synthesis route for B-1 and its condensation reactions with different non-boron motifs. | ||
Experimental section
Materials
5,7-Diiodo-8-hydroxy-quinoline, CuI, Pd(PPh3)4 and Pd(PPh3)2Cl2 were purchased from Aladdin, and other chemicals were obtained from Tansoole (Shanghai, China). With exception of diiso-propylamine, which was treated with anhydrous CaH2 and then distilled under nitrogen before use, other chemicals used were of at least analytical grade and used without further purification. Solvents were all dried and degassed using the Grubbs-type solvent purification system, a product of Innovative Technology, Inc. The purified solvents were stored in an argon atmosphere before use. Unless otherwise stated, all reactions were performed under an argon atmosphere using standard Schlenk and glovebox techniques. Diisopropylaminoborane (iPr2NBH2) was prepared according to a literature method.31 Monomer B-1 was synthesized as per the reported procedure.32 2,5-Diethynyl-thiophene and 5,5′-bis(trimethylstannyl)-2,2′-bithiophene were also prepared according to literature methods.33Instrumental methods
1H NMR and 13C NMR spectra were acquired on a Bruker AV 600 NMR spectrometer at room temperature using CDCl3 as the solvent, and referenced externally to SiMe4. The multiplicities of the signals are indicated as s, d, t or m, which stand for singlet, doublet, triplet, and multiplet, respectively. Carbon atoms directly bonded to the boron atom are not always observed in the 13C NMR spectra due to quadrupolar relaxation, which leads to considerable signal broadening. To confirm the purities and characterize the structures of the compounds as synthesized, their 1H NMR and 13C NMR spectra were recorded and the results are provided in the ESI.† High-resolution mass spectra (HRMS) were collected on a Bruker maXis UHR-TOF mass spectrometer in an ESI positive mode. Elemental analyses were conducted on an Elementar Vario EL III machine (Germany). Single-crystal X-ray diffraction was obtained using a Bruker D8 Quest Single-crystal X-ray Diffraction spectrometer. GPC was performed at 35 °C using THF as the eluent at a flow rate of 1.0 mL min−1. GPC measurements were made using a GPC 270 Max instrument equipped with a Viscotek VE 2001 plus autosampler, three μ-Styragel columns, and a Viscotek VE 3580 refractive index (RI) detector. The columns were calibrated using polystyrene standards. UV-Vis spectra were recorded on a Hitachi U-3900/3900H spectrophotometer and the molar absorption coefficients for all the compounds were calculated using the Beer–Lambert law, A = εbc, where A is the absorbance, ε the molar absorption coefficient, b the length of the cell, and c the concentration of the compound under study. Steady-state fluorescence excitation and emission spectra and fluorescence lifetime measurements were performed on a time-correlated single photon counting (TCSPC) Edinburgh FLS 920 fluorescence spectrometer. The absolute fluorescence quantum yields were measured on the same machine using an integrating sphere. The optical images depicted in the paper were recorded using a Canon 70D camera.Theoretical calculations
The input files were generated from single crystal structures when available or otherwise generated in Chem3D and then pre-optimized in Spartan ’08 V 1.2.0. The ground and the lowest singlet excited state structures of monomer B-1 and the model structures of the polymers (ru-P1, ru-P2, ru-P3, ru-P4) under vacuum were optimized with the B3LYP functional at the 6-31g(d) level. Their absorption energies were investigated using time-dependent density functional theory (TD-DFT) at the same level. The frontier molecular orbitals (HOMO/LUMO) and the natural transition orbitals (particles/holes) of the compounds under investigation were obtained from the respective calculations based on the optimized structures. All computations were performed on the Gaussian 09 package.Synthesis of the monomers and polymers
The details of the synthesis of monomer B-1 and its relevant polymers P1, P2, P3 and P4 are provided in the ESI.† In addition, the syntheses of the control polymer P5 and the relevant monomer B-2 are also presented in the ESI.†Fabrication of the fluorescent films
Stock solutions (0.2 mg mL−1) of P1–P4 or P5 were prepared by dissolving 1 mg of the relevant compounds in 5 mL of chloroform. For the preparation of the films, 50 μL of the as-prepared solution was dropped onto a pre-cleaned glass substrate or silica-gel plate and air-dried at room temperature.Photochemical stability
The photochemical stabilities of the sample compounds in CHCl3 solution and the film states were tested using a Hitachi F-7000 fluorescence spectrophotometer with a time scan pattern and a 150 W Xenon lamp was employed as the light source. Typical irradiation time was 2.5 h.Results and discussion
Synthesis and characterization
Recently, Pucheault and co-workers developed a novel method to synthesize four-coordinate organoboron quinolinate derivatives by using diiso-propylamino-borane as a boron source.32 Compared to other known methods, this approach is much more efficient and convenient, and can be used for the gram-scale preparation of the compounds. Monomers B-1 and B-2 were synthesized utilizing the method, and 5,7-diiodo-8-hydroxy-quinoline was chosen as a chelating ligand (Scheme 1). Re-crystallization in CH2Cl2/hexane resulted in single crystals of B-1, and the corresponding structure is shown in Fig. S1.† As expected, the N and O of the ligand function as chelating atoms and coordinate directly to the central atom, B, the coordination number of which is four. Moreover, B-1 adopts a tetrahedral geometry, and the existence of iodo atoms was directly confirmed. Selected bond lengths and angles of the crystal are provided in Table S1,† and the relevant crystallographic data in Table S2.†As for the coupling of B-1 with other motifs, we employed the Sonogashira–Hagihara reaction, the Suzuki–Miyaura reaction and the Stille reaction to perform the polymerization (Scheme 1). The crude as obtained polymers were purified using multiple dissolution and precipitation treatments, and they were then used for molecular weight measurements. The relevant data are summarized in Table S3.† Clearly, the number-average molecular weight and the weight-average molecular weight are all greater than 10![[thin space (1/6-em)]](https://www.rsc.org/images/entities/char_2009.gif) 000 g mol−1. 1H NMR studies further confirmed the 1:1 incorporation of the monomer and the conjugated linkers in the polymers (Fig. S2†).
000 g mol−1. 1H NMR studies further confirmed the 1:1 incorporation of the monomer and the conjugated linkers in the polymers (Fig. S2†).
Photophysical behavior
The photophysical properties of B-1 and the as synthesized polymers were investigated. Their absorption spectra were recorded in dry CHCl3 at a concentration of 0.02 mg mL−1 at room temperature. The results are shown in Fig. 1 and Table S4.† In reference to the figure and the table, they demonstrate that the maximum absorption of B-1 appears at 424 nm (ε = 3320 cm−1 M−1), which could be ascribed to the transition from S0 to S1 of the diiodohydroxyquinoline ligand of the compound as revealed by theoretical calculations (Fig. 2a). In comparison to B-1, the maximum absorptions of the polymers (P1–P4) exhibited significant red shift (20, 30, 36, and 82 nm) and, at the same time, the molar absorption coefficients also increased (4480, 8010, 5680, and 5770 cm−1 M−1 per B-1 unit) (Table 1), obviously as a result of the extension of the π-structure or modification of the chelating ligand of B-1, which is due to the condensation with the other motifs, as revealed by other studies.24b,34 | ||
| Fig. 1 UV-Vis absorption and normalized fluorescence emission spectra (λex = 405 nm) of monomer B-1, polymers P1–P4 in CHCl3 at 0.02 mg mL−1. Inset: photos of the corresponding solutions under daylight and UV light (365 nm). | ||
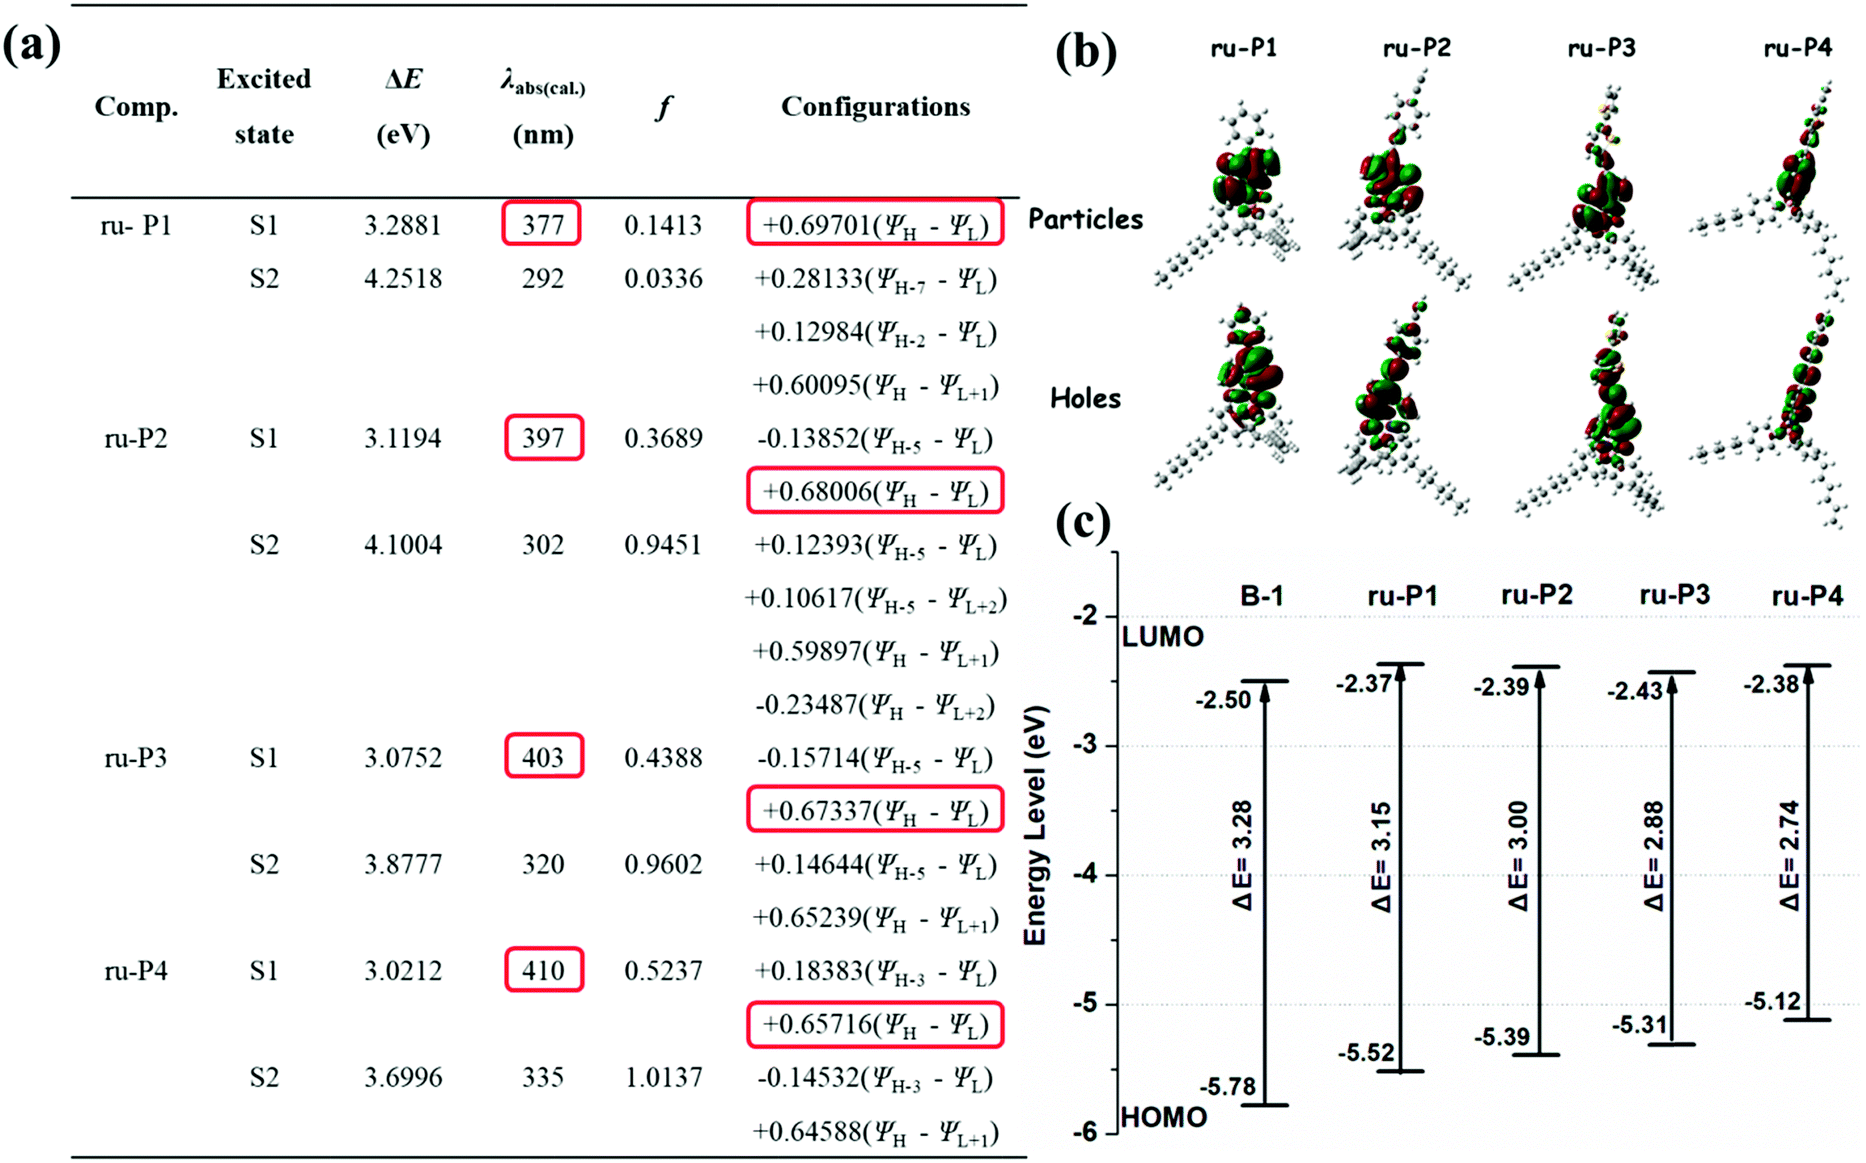 | ||
| Fig. 2 (a) TD-DFT calculated vertical transition energies (ΔE), absorption wavelengths (λabs(cal.)), oscillator strengths (f), and configurations, based on the optimized ground state structures of B-1 and the model compounds of the polymers. (b) The dominant natural transition orbital pairs for the lowest excited singlet states of the model compounds of the polymers. (c) Differences in energies between the HOMO and LUMO levels of B-1 and the model compounds of the polymers. | ||
| Comp. | Experimental Data | Theoretical Calculations | |||||||||||
|---|---|---|---|---|---|---|---|---|---|---|---|---|---|
| UV-Vis λmax (nm) | ε (M−1 cm−1) | PLsolλem (nm) | τ sol (ns) | Q.Y. Φsol (%) | Δυ (cm−1) | PLfilmλem (nm) | τ film (ns) | Q.Y. Φfilm (%) | λ exc (nm) | f | HOMO/LUMO | ΔE (eV) | |
| a Experimental data: maximum absorption wavelength (λmax) and emission wavelength (λem), molar absorption coefficient (ε), lifetimes (τ), fluorescence quantum yield (Φ) and Stokes shifts (Δυ) recorded in CHCl3 (0.02 mg mL−1) or in the film state (adopting a front face method). Fluorescence lifetimes were detected using a EPLED-405 picosecond pulsed-light-emitting diode as an excitation source. Computed photophysical data of the model compounds (B-1, ru-P1, ru-P2, ru-P3, and ru-P4) of the investigated polymers were calculated with the help of a theoretical method in the framework of time-dependent density functional theory (TD-DFT) at the level of B3LYP/6-31G in a suite of Gaussian 09 programs. | |||||||||||||
| B-1 | 424 | 3320 | 520 | 2.1 | 11.66 | 10417 |
— | — | — | 365 | 0.0981 | −5.78/−2.50 | 3.28 |
| P1 | 444 | 4480 | 550 | 3.2 | 15.09 | 9434 | 580 | 2.4 | 0.56 | 377 | 0.1413 | −5.52/−2.37 | 3.15 |
| P2 | 454 | 8010 | 560 | 5.7 | 14.77 | 9434 | 603 | 3.1 | 0.49 | 397 | 0.3689 | −5.39/−2.39 | 3.00 |
| P3 | 460 | 5680 | 575 | 1.5 | 9.98 | 8696 | 614 | 3.6 | 0.39 | 403 | 0.4388 | −5.31/−2.43 | 2.88 |
| P4 | 506 | 5770 | 615 | 1.4 | 8.41 | 9174 | 668 | 2.9 | 0.37 | 410 | 0.5237 | −5.12/−2.38 | 2.74 |
Fluorescence emission spectra of B-1 and the polymers were also recorded at room temperature in the same solvent at the same concentration. As can be seen in Fig. 1, the morphologies of the emission spectra of the polymers are similar to those of the monomer, all of which are characterized by a broad and structureless band, but their positions exhibit significant bathochromic shifts from B-1 to P4, which are ∼520, ∼550, ∼560, ∼575, and ∼615 nm, respectively, a phenomenon that was confirmed by the luminescent photos shown in the same figure. The reason behind this can also be ascribed to the increased conjugation of the chelating structures of B-1.
To disclose the electronic structures of the monomer and the polymers generated, density functional theory (DFT) calculations using the B3LYP functional at the 6-31G(d) basis set were performed, where the closely related model systems (ru-P1, ru-P2, ru-P3, and ru-P4) were used instead of the polymers, as shown in Fig. S3.† As shown in Fig. 2b, the dominant natural transition orbital pairs for the lowest singlet excited state geometry are localized in the ligand hydroxyquinoline (HQ), which is in agreement with our earlier work.34b It is also seen from the calculations that substitution on the 5,7-positions of the HQ unit with aromatic or π-structures does lead to elevated HOMO levels, but little change is seen in the LUMO levels (Fig. 2c), which leads to a decreased band gap and to a red-shifted absorption/emission, as revealed by relevant measurements (Fig. 1 and Table 1).
The absolute fluorescence quantum yield of B-1 was determined in CHCl3 and those of the polymers were determined both in solution and in the film state. The results are presented in Table 1. Compared to BPh2(Q) (Φ = 30%),35 which is a typical four-coordinated mono-boron complex with HQ as a chelating ligand and two benzenes (Ph) as the mono-dentate ligands, the quantum yield of B-1 is only 11.66%. Iodine substitution might be the main reason for this, due to the well-known ‘heavy atom’ effect.36 The polymers showed similar fluorescent quantum yields to the monomer. However, with the evaporation of the solvents, the emission efficiencies of the polymers decreased greatly owing to the aggregation-caused quenching. As expected, along with aggregation, the emissions were red shifted, as confirmed by both spectroscopy measurements and fluorescence color inspections (Fig. 3).
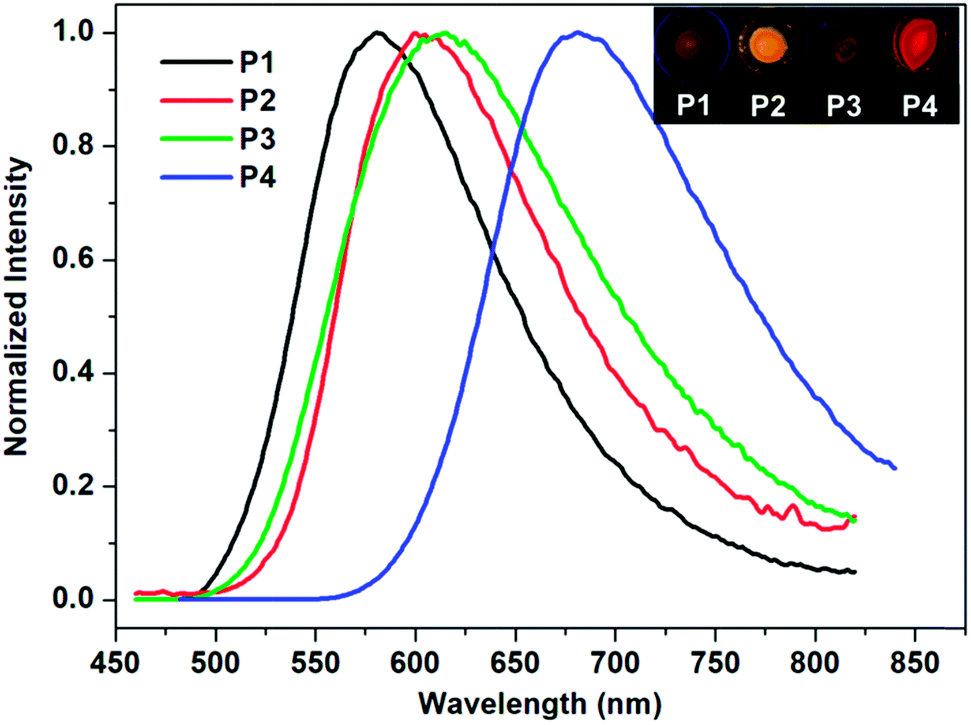 | ||
| Fig. 3 Normalized fluorescence spectra of polymers P1–P4 in the film state (λex = 405 nm). Inset: photos of the corresponding films under UV light (365 nm). | ||
Photochemical and thermo-stability
Stability, especially photochemical stability, is always a bottleneck for practical applications of organic photoelectronic devices.37 Therefore, it is necessary to check the photochemical stability of a fluorophore before any further application-related study is made. Accordingly, B-1 and the polymers under study were dissolved in CHCl3 first, and then dip-coated on glass plate surfaces to prepare relevant films. Their emissions were monitored as functions of time. The results are shown in Fig. S4 and S5,† respectively. Clearly, for the solution samples of B-1, P1, P2 and P4, 2.5 h of continuous irritation resulted in little decrease in the emission intensity. However, for P3, there is a steady decrease in its emission even though the total decrease is less than 10%. For the film samples, the emission intensities all decreased with an elongation of the illumination. The total decreases are about 8.1%, 4.5%, 8.9% and 7.5%, respectively, for the polymer-based films under concern.The thermostability of the films was also tested by exposing them in air at room temperature, but away from light. The fluorescent colors of the films under UV light (365 nm) were checked once a week. It was demonstrated that little change was observed after several months of storage (Fig. S6†). Therefore, it is safe to conclude that the monomer and the as prepared polymers possess sufficient photochemical and thermo-stability, laying the foundation for further studies.
Home-made sensing platform and making of the film device
To explore the sensing performance of the aforementioned films towards particular VSOMs, a sensing platform was constructed. The structure of the platform is schematically shown in Fig. S7.† Unlike commercially available instruments, in situ, online and continuous evaluation of sensor performance can be conducted on the platform. Moreover, response kinetics can also be recorded and could provide valuable information for discrimination. It is because of the aforementioned reasons that most of the sensing tests in this work were performed on this platform. To work with the platform, the fluorescent films to be evaluated must be made into devices. In other words, the shape and size of the film substrate must match the sample cell. A sample film device is shown in the upper left corner of Fig. S7.†Vapor sensing measurements
The gas sensing measurements were carried out using a static testing method38 at room temperature (∼293 K). To conduct a test, the film to be evaluated was placed inside the film chamber of a film device first (inset of Fig. S7†), and then the device was put into the home-made sensing platform (Fig. S7†). The humidity of the room where the sensing tests were performed was measured and it was ∼25% RH. The response intensity of the film to the vapor of a specific analyte was determined by altermatic subtracting of the fluorescence intensity of the film in the presence of the sample vapor under test from that in clean air. The sensing test was repeated at least three times for each concentration of each sample.For the vapor sensing of liquid analytes such as n-pentane, 50 mL of the liquid (analytical grade) was transferred into a 4 L amber glass bottle, and then the bottle was sealed for 1 day at the test temperature and pressure (∼293 K and ∼995 hPa, respectively) to ensure liquid–vapor equilibration.7a The vapor above the liquid inside the bottle was recognized as saturated vapor and used for further tests. For gaseous analytes such as methane or n-butane, which are commercial products, they were directly transferred into a PLT Gas Sampling Bag (1 L, a product of Dalian Pulaite Gas Packing Co., Ltd., China) before use. To conduct a test, the vapor either in the glass bottle or in the gas bag was sampled with a 100 mL glass syringe mounted with a metal needle. The only difference between the two kinds of gas sample is that the one from the glass bottle is a mixture of air and the analyte, but the one from the gas bag is pure analyte. The vapor concentration (CA) of the analyte in the syringe can be approximately calculated using eqn (1), where PA is the saturated vapor pressure of the analyte in the liquid state (Table S5†) at temperature T or the air pressure (the analyte in gaseous state) at the time of conducting the test, and Patm is the atmospheric pressure. Dilution of the vapor sample was performed in the syringe by mixing with dry air. In this way, the concentration of the sample can be adjusted. To start a test, the syringe containing a suitable concentration of the analyte in the vapor state was mounted to a pump and the needle was inserted into the sampling nozzle of the sensor connected to the sensing platform as depicted in Fig. S7.† Then, 3 mL of the vapor was pumped into the film-device chamber of the sensor from the syringe at a speed of 180 mL min−1. In this way, a fluorescence intensity against time trace was obtained, which represents the dynamic response of the film-based sensor to the presence of the analyte vapor. The second test was performed, generally, 40 s later.
 | (1) |
Sensing performance
Most VSOMs are toxic, and a few of them are even carcinogenic even at very low concentrations, and they can thereby cause serious adverse effects to human health and ecosystems.39 In particular, some short-chain saturated alkanes, such as n-pentane, n-heptane and n-decane, are frequently found in expired air from patients with lung cancer, asthma, and other respiratory diseases.3b,40 Inspection of the data shown in Table 1 reveals that the solvation of the polymers could result in enhanced fluorescence emission as their emissions in the solution state are always stronger than those in the film state. Moreover, the silica-gel plate possesses a greater absorption capability towards solvent molecules than that of routine glass plates. Fluorescent turn-on sensors for solvent-like VSOMs may be developed via a combination of the two factors. Thus, two kinds of fluorescent film were prepared with these as substrates, the first series are those with silica gel plates as substrates and P1, P2, P3 and P4 as the sensing fluorophores, and the second are the ones with glass plates as substrates. Corresponding film devices are named as S1, S3, S5, and S7 and S2, S4, S6, and S8, respectively. The photos of the sensing films as fabricated are depicted in Fig. S8.† The device S9 uses P5 as the sensing fluorophore with the silica gel plate as a substrate.As an example, Fig. S9† shows the effect of n-pentane, the signal molecule of lung cancer, upon the fluorescence emission of S7. Clearly, exposure to the alkane vapor resulted in over a 5-fold increase in the fluorescence emission, validating the aforementioned expectation. Based upon this discovery, the sensing behaviours of all film devices to commonly found and important VSOMs, including methane, ethane, propane, n-butane, n-pentane, n-hexane, n-heptane, n-octane, n-nonane, n-decane, methanol, toluene, diethyl ether, benzene, acetone, ethanol, THF, di-chloromethane (DCM), tri-chloromethane (TCM) and water, were systematically examined. Some of the results are depicted in Fig. S10.†
By inspecting the figure it can be seen that each film exhibited its own unique responses to the vapors of the tested VSOMs, the vapor concentrations of which are either the saturated vapors of the VSOMs in the liquid state (Table S5†) at the tested temperature or the pure analyte vapors with the vapor pressure of the VSOMs in the gaseous state during the test. Specifically, the response can be divided into two types, that is enhancement or quenching of the original emission. For the silica-gel plate based films only an emission enhancement was observed upon exposing them to the vapors of the VSOMs tested. For the glass plate based films the majority of the responses were quenching. The enhancement observed in the glass plate-based films is both rare and weak, and the maximum enhancement was observed in the system of S8+benzene (14), which was a result of the substrate effect.41
To compare the sensing performance of the films to the analytes at the same concentration (the saturated vapor pressure of n-octane, 1.37 × 10⁴ ppm), an additional experiment was conducted. In the test, 17 analytes, including the ones in the vapor state and those in the liquid state at room temperature were employed as typical samples, and S7 was used as an example of the film device. The results are depicted in Fig. S11.† It is to be noted that n-nonane, n-decane and water were not tested as they showed a negligible effect upon the emission of the film (Fig. S10†). Clearly, the results depicted in Fig. S11† are similar to those shown in Fig. S10.† Specifically, n-pentane and diethyl ether showed a more pronounced effect upon film emission, suggesting the importance of the molecular sizes of the analytes. This is because of saturated alkanes possessing similar chemical structures and properties, only n-pentane shows a more pronounced enhancing effect upon the fluorescence emission of the film-device. Moreover, with reference to the structure of P4, it is seen that the presence of the non-planar structure of the monomeric unit B-1 could screen the dense packing of the polymer chains, resulting in porous structures at the molecular level, which may function as molecular channels for the analytes. Without a doubt, analyte molecules that are too small or too large are not favorable to remaining or diffusing within the channels, and thereby show less of an effect upon the fluorescence emission of the film device. Moreover, the boiling point related cohesive energies and polarities could also play a role in sensing as they determine the solvation of the polymer in the film. Thus, only those with suitable sizes, suitable polarities and larger cohesive energies could accumulate within the molecular channels, resulting in the solvation of P4 and the relevant fluorescence enhancement. It is to be noted that the degree of fluorescence enhancement is not only dependent upon the physical parameters of the analytes but also on their chemical nature, as P4 emits differently in different solvents.
To support the presented rationalization, Table S6† provides the parameters of some typical analytes and the fluorescence properties of P4. In addition, the packing structure of monomer B-1 in the crystal state is also depicted (Fig. S12†). With reference to the packing, interspaces or channels are clearly observed. To further confirm the described rationalization, a control monomer B-2 and its relevant polymer P5 were designed and synthesized, in which the hexyl residual present in B1 was removed. Similar sensing tests were conducted with P5 as the sensing polymers. The results from the tests are shown in Fig. S13 and S14,† respectively. Similar results were also obtained, suggesting that the effect of the hexyl residuals in the polymers such as P4 upon sensing is negligible. A similar phenomenon was reported by Dincă and co-workers in the studies of sensor arrays of mesoporous MOFs, which is also in support of our elaborations.42,43
For each of the VSOMs tested, integration of the eight responses from the film devices (Fig. S10†) could result in a response pattern. Further integration of the individual response pattern resulted in a whole response pattern, as depicted in Fig. 4. Based on the data depicted, a pattern recognition algorithm (PCA) can be applied to verify if the sensor array could discriminate the VSOMs under test conditions.44 As is known, PCA usually estimates combinations of variables in multidimensional data sets, and then characterizes groupings of objects within the sets. This is done by calculating orthogonal eigenvectors (principal components, PCs) that lie in the direction of the maximum variance within the data.45 The first PC contains the highest degree of variance, and other PCs follow in the order of decreasing variance. Thus, PC analysis (PCA) concentrates the most significant variance of the data into a lower dimensional space. MATLAB R2012 software is generally used to conduct the PCA-based data processing.46 In the present work, the PCA score plot as generated is depicted in Fig. 5, which shows clear clustering of the data using only the first two PCs (representing 57.7% of variance), the first principle component (PC1) of which carries about 40.25% of the variance, while the second one (PC2) carries ∼17.45%. The fact that the tested VSOMs are grouped in well-separated clusters demonstrated the strong discriminating capability of the polymers-based sensor array toward the VSOMs examined.
 | ||
| Fig. 4 Recognition patterns of the saturated vapors of the tested VSOMs at 293 K obtained by collecting fluorescence intensity variations of the sensors (S1 to S8). Note: (a) the Arabic numerals in the figure stand for different chemicals: specifically, methane (1), ethane (2), propane (3), n-butane (4), n-pentane (5), n-hexane (6), n-heptane (7), n-octane (8), n-nonane (9), n-decane (10), methanol (11), toluene (12), diethyl ether (13), benzene (14), acetone (15), ethanol (16), THF (17), DCM (18), TCM (19) and water (20). (b) For each sample, there are eight results from the sensors (S1 and S2–S8), which are collectively depicted in a single column in the figures. (c) The error bars represent the calculated standard deviation from three individual replicate measurements. | ||
 | ||
| Fig. 5 Two-dimensional PCA score plot to discriminate the saturated vapors of the tested VSOMs at 293 K via the utilization of the results from a visual array shown in Fig. 4, which is composed of the individual sensors S1–S8. Note: the meaning of the Arabic numerals in this figure are the same as for those depicted in Fig. 4. | ||
Sensitivity is another crucial factor determining the applicability of a film device to its real-life uses. Therefore, as an example, the sensitivity of the film device S7 to n-pentane was determined by collecting the response intensities in the presence of different concentrations of the analyte on the home-made sensing platform. The results are shown in Fig. 6. It is found that the response intensity increased significantly upon contact with the vapor of n-pentane, and the intensity enhancement is almost linearly correlated with the concentration of the analyte vapor (inset of Fig. 6). It is also seen that 3.7 ppm of the analyte could result in a significant response of the sensing device, suggesting that the detection limit of the analyte should be lower than this value. However, it is still significantly higher than the concentrations (8–65 ppb) required to conduct breath diagnosis in a direct way,3b posing new challenges for future work.
 | ||
| Fig. 6 The net responses of different concentrations (from 3.7 ppm to 3.7 × 10⁴ ppm) of n-pentane to the fluorescence emission of S7 (λex/λem = 460 nm/678 nm) at 293 K, the measurements of which were taken on the home-made sensing platform. Inset: a plot of the differences in the response intensities against the concentrations of n-pentane. | ||
The response speed and re-usability are other key properties for practical applications of gas sensors. Relevant tests were conducted with S7 and n-pentane as a sample sensor and a sample analyte, respectively. Specifically, the tests were conducted by continuous monitoring of the fluorescence emission of S7 at a specific wavelength at room temperature. In a typical test, a known amount of n-pentane vapor was injected with the gas supply system (Fig. S7†), and the instrument produced an emission intensity change immediately, then the emission would restore within 30 s. This process was repeated 50 times. Fig. 7 shows the results of this. Clearly, the response is fast (<1 s), and the sensing process is fully reversible. Moreover, no observable degradation in the sensing performance of the sensor was noted after using it for long periods of time and, combined with the other merits previously described, this reveals its great potential for practical applications. Relevant work is in progress.
 | ||
| Fig. 7 Results from 50 repeats of a reusability test for S7 towards the n-pentane vapor measured on the home-made sensing platform at 293 K. Saturated n-pentane vapor was used as the sample analyte and the vapor was sampled (3 mL for each measurement) using the stationary gas supply system (Fig. S7†). | ||
Conclusions
In conclusion, a mono-boron quinolinate complex, B-1, with two iodine atoms at its 5 and 7 positions was synthesized, and used for the preparation of structure-containing polymers via condensation with other components. Combination of the polymers with a glass plate or silica-gel plate resulted in eight fluorescent films. The as obtained films were further made into devices, each of which could function as an individual fluorescence sensor. Integration of the devices produced a conceptual sensor array. Sensing performance studies demonstrated that the sensor array showed a powerful discriminating capability for the vapors of the tested saturated alkanes and commonly found solvents. The sensing is fast, sensitive and fully reversible as evidenced by the response times of under 1 s, the detection limit of less than 3.7 ppm, and the repeatable measurements over more than 50 repeats when S7 and n-pentane were used as a sample sensor and a sample analyte, respectively. The unprecedented sensing performance of the film-based sensor array to the tested VSOMs, especially to the very challenging saturated alkanes, is partially ascribed to the unique geometrical structure of the monomer unit, B-1, of the polymers, which may lead to the formation of micro-channels at the molecular level. We believe that the method developed in the present work has brought new hope for the diagnosis of some important diseases in a non-invasive manner. Relevant studies are in progress.Conflicts of interest
The authors declare no conflict of interest.Acknowledgements
We acknowledge the funding from the Natural Science Foundation of China (21527802 and 21673133), the 111 project (B14041), the Program for Changjiang Scholars and Innovative Research Team in University (IRT-14R33) and the Fundamental Research Funds for the Central Universities of China (2016TS050). Valuable discussions and help from Mr Xingmao Chang and Ke Liu as well as from Miss Congdi Shang are greatly acknowledged.Notes and references
- B. Pejcic, P. Eadington and A. Ross, Environ. Sci. Technol., 2007, 41, 6333 CrossRef CAS PubMed.
- Y. Zhang, Z. Li, T. Ling, A. K. Sergei and X. Du, J. Mater. Chem. A, 2016, 4, 8700 CAS.
- (a) M. Phillips, K. Gleeson, J. M. B. Hughes, J. Greenberg, R. N. Cataneo, L. Baker and W. P. McVay, Lancet, 1999, 353, 1930 CrossRef CAS PubMed; (b) N. Shehada, J. C. Cancilla, J. S. Torrecilla, E. S. Pariente, G. Brönstrup, S. Christiansen, D. W. Johnson, M. Leja, M. P. A. Davies, O. Liran, N. Peled and H. Haick, ACS Nano, 2016, 10, 7047 CrossRef CAS PubMed.
- (a) E. Tait, J. D. Perry, S. P. Stanforth and J. R. Dean, TrAC, Trends Anal. Chem., 2014, 53, 117 CrossRef CAS; (b) D. Barden, Am. Lab., 2013, 45, 12 CAS.
- Y. Yang, L. Chen, F. Jiang, X. Wan, M. Yu, Z. Cao, T. Jing and M. Hong, J. Mater. Chem. C, 2017, 5, 4511 RSC.
- (a) B. C. Yadav, K. Agrahari, S. Singh and T. P. Yadav, J. Mater. Sci.: Mater. Electron., 2016, 27, 4172 CrossRef CAS; (b) H. J. Kim and J. H. Lee, Sens. Actuators, B, 2014, 192, 607 CrossRef CAS.
- (a) C. Wang, B. R. Bunes, M. Xu, N. Wu, X. Yang, D. E. Gross and L. Zang, ACS Sens., 2016, 1, 552 CrossRef CAS; (b) J. Janata and M. Josowicz, Acc. Chem. Res., 1998, 31, 241 CrossRef CAS; (c) N. Yamazoe and K. Shimanoe, Sens. Actuators, B, 2008, 128, 566 CrossRef CAS.
- (a) A. A. Tomchenko, G. P. Harmer, B. T. Marquis and J. W. Allen, Sens. Actuators, B, 2003, 93, 126 CrossRef CAS; (b) A. K. Srivastava, Sens. Actuators, B, 2003, 96, 24 CrossRef CAS.
- (a) A. Mirzaei, S. G. Leonardi and G. Neri, Ceram. Int., 2016, 42, 15119 CrossRef CAS; (b) H. Gan, Y. C. Man, C. P. Tan, I. NorAini and S. A. H. Nazimah, Food Chem., 2005, 89, 507 CrossRef CAS; (c) C. Elosua, I. R. Matias, C. Bariain and F. J. Arregui, Sensors, 2006, 6, 1440 CrossRef CAS.
- (a) Y. Cui, Y. Yue, G. Qian and B. Chen, Chem. Rev., 2012, 112, 1126 CrossRef CAS PubMed; (b) X. Qi, R. Lin, Q. Chen, J. Lin, J. Zhang and X. Chen, Chem. Sci., 2011, 2, 2214 RSC; (c) M. Schäferling, Angew. Chem., Int. Ed., 2012, 51, 3532 CrossRef PubMed.
- R. Miao, J. Peng and Y. Fang, Mol. Syst. Des. Eng., 2016, 1, 242 CAS.
- (a) R. Miao, J. Peng and Y. Fang, Langmuir, 2017, 33, 10419 CrossRef CAS PubMed; (b) R. Miao and Y. Fang, Chin. Sci. Bull., 2017, 62, 532 CrossRef.
- (a) G. He, N. Yan, J. Yang, H. Wang, L. Ding, S. Yin and Y. Fang, Macromolecules, 2011, 44, 4759 CrossRef CAS; (b) X. Sun, Y. Qi, H. Liu, J. Peng, K. Liu and Y. Fang, ACS Appl. Mater. Interfaces, 2014, 6, 20016 CrossRef CAS PubMed.
- (a) G. He, G. Zhang, F. Lv and Y. Fang, Chem. Mater., 2009, 21, 1494 CrossRef CAS; (b) L. Ding and Y. Fang, Chem. Soc. Rev., 2010, 39, 4258 RSC; (c) G. He, N. Yan, H. Kong, S. Yin, L. Ding, S. Qu and Y. Fang, Macromolecules, 2011, 44, 703 CrossRef CAS.
- J. Fan, X. Chang, M. He, C. Shang, G. Wang, S. Yin, H. Peng and Y. Fang, ACS Appl. Mater. Interfaces, 2016, 8, 18584 CAS.
- (a) M. He, H. Peng, G. Wang, X. Chang, R. Miao, W. Wang and Y. Fang, Sens. Actuators, B, 2016, 227, 255 CrossRef CAS; (b) K. K. Kartha, S. S. Babu, S. Srinivasan and A. Ajayaghosh, J. Am. Chem. Soc., 2012, 134, 4834 CrossRef CAS PubMed; (c) E. Yue, X. Ma, Y. Zhang, Y. Zhang, R. Duan, H. Ji, J. Li, Y. Che and J. Zhao, Chem. Commun., 2014, 50, 13596 RSC.
- (a) H. W. Mo, Y. Tsuchiya, Y. Geng, T. Sagawa, C. Kikuchi, H. Nakanotani, F. Ito and C. Adachi, Adv. Funct. Mater., 2016, 26, 6703 CrossRef CAS; (b) Y. J. Shiu, Y. C. Cheng, W. L. Tsai, C. C. Wu, C. T. Chao, C. W. Lu, Y. Chi, Y. T. Chen, S. H. Liu and P. T. Chou, Angew. Chem., Int. Ed., 2016, 55, 3017 CrossRef CAS PubMed; (c) S. Wang, D. Yang, J. Lu, H. Shimogawa, S. Gong, X. Wang, S. K. Mellerup, A. Wakamiya, Y. Chang, C. Yang and Z. Lu, Angew. Chem., Int. Ed., 2015, 54, 15074 CrossRef CAS PubMed.
- (a) Y. Sun, D. Rohde, Y. Liu, L. Wan, Y. Wang, W. Wu, C. Di, G. Yu and D. Zhu, J. Mater. Chem., 2006, 16, 4499 RSC; (b) R. Hecht, J. Kade, D. Schmidt and A. Nowak-Król, Chem.–Eur. J., 2017, 23, 11620 CrossRef CAS PubMed.
- (a) C. D. Entwistle and T. B. Marder, Angew. Chem., Int. Ed., 2002, 41, 2927 CrossRef CAS; (b) J. M. Hales, S. Barlow, H. Kim, S. Mukhopadhyay, J. L. Brédas, J. W. Perry and S. R. Marder, Chem. Mater., 2014, 26, 549 CrossRef CAS; (c) L. Ji, R. M. Edkins, L. J. Sewell, A. Beeby, A. S. Batsanov, K. Fucke, M. Drafz, J. A. K. Howard, O. Moutounet, F. Ibersiene, A. Boucekkine, E. Furet, Z. Liu, J. F. Halet, C. Katan and T. B. Marder, Chem.–Eur. J., 2014, 20, 13618 CrossRef CAS PubMed.
- A. J. C. Kuehne and M. C. Gather, Chem. Rev., 2016, 116, 12823 CrossRef CAS PubMed.
- (a) S. V. Mulay, T. Yudhistira, M. Choi, Y. Kim, J. Kim, Y. J. Jang, S. Jon and D. G. Churchill, Chem.–Asian J., 2016, 11, 3598 CrossRef CAS PubMed; (b) X. Li, X. Guo, L. Cao, Z. Xun, S. Wang, S. Li, Y. Li and G. Yang, Angew. Chem., Int. Ed., 2014, 53, 7809 CrossRef CAS PubMed.
- Y. Rao, H. Amarne and S. Wang, Coord. Chem. Rev., 2012, 256, 759 CrossRef CAS.
- (a) Y. Chang, Y. Rao, S. Gong, G. L. Ingram, S. Wang and Z. Lu, Adv. Mater., 2014, 26, 6729 CrossRef CAS PubMed; (b) C. T. Poon, D. Wu and V. W. W. Yam, Angew. Chem., Int. Ed., 2016, 55, 3647 CrossRef CAS PubMed.
- (a) Q. Wu, M. Esteghamatian, N. Hu, Z. Popovic, G. Enright, Y. Tao, M. D’Iorio and S. Wang, Chem. Mater., 2000, 12, 79 CrossRef CAS; (b) Y. Qin, I. Kiburu, S. Shah and F. Jäkle, Org. Lett., 2006, 8, 5227 CrossRef CAS PubMed.
- (a) A. Loudet and K. Burgess, Chem. Rev., 2007, 107, 4891 CrossRef CAS PubMed; (b) A. Kamkaew, S. H. Lim, H. B. Lee, L. V. Kiew, L. Y. Chung and K. Burgess, Chem. Soc. Rev., 2013, 42, 77 RSC; (c) P. Batat, M. Cantuel, G. Jonusauskas, L. Scarpantonio, A. Palma, D. F. O’Shea and N. D. McClenaghan, J. Phys. Chem. A, 2011, 115, 14034 CrossRef CAS PubMed.
- D. Frath, A. Poirel, G. Ulrich, A. D. Nicola and R. Ziessel, Chem. Commun., 2013, 49, 4908 RSC.
- D. Li, H. Zhang and Y. Wang, Chem. Soc. Rev., 2013, 42, 8416 RSC.
- W. Wan, F. Cheng and F. Jäkle, Angew. Chem., Int. Ed., 2014, 53, 8934 CrossRef CAS PubMed.
- Y. Qin, C. Pagba, P. Piotrowiak and F. Jäkle, J. Am. Chem. Soc., 2004, 126, 7015 CrossRef CAS PubMed.
- Y. Nagata and Y. Chujo, Macromolecules, 2007, 40, 6 CrossRef CAS.
- L. Pasumansky, D. Haddenham, J. W. Clary, G. B. Fisher, C. T. Goralski and B. Singaram, J. Org. Chem., 2008, 73, 1898 CrossRef CAS PubMed.
- L. Marciasini, B. Cacciuttolo, M. Vaultier and M. Pucheault, Org. Lett., 2015, 17, 3532 CrossRef CAS PubMed.
- (a) S. Chemburu, E. Ji, Y. Casana, Y. Wu, T. Buranda, K. S. Schanze, G. P. Lopez and D. G. Whitten, J. Phys. Chem. B, 2008, 112, 14492 CrossRef CAS PubMed; (b) B. Kang, R. Kim, S. B. Lee, S. K. Kwon, Y. H. Kim and K. Cho, J. Am. Chem. Soc., 2016, 138, 3679 CrossRef CAS PubMed.
- (a) Y. Teng, Y. Kan, Z. Su, Y. Liao, L. Yan, Y. Yang and R. Wang, Int. J. Quantum Chem., 2005, 103, 775 CrossRef CAS; (b) Y. Qi, R. Kang, J. Huang, W. Zhang, G. He, S. Yin and Y. Fang, J. Phys. Chem. B, 2017, 121, 6189 CrossRef CAS PubMed.
- Y. Cui, Q. Liu, D. Bai, W. Jia, Y. Tao and S. Wang, Inorg. Chem., 2005, 44, 601 CrossRef CAS PubMed.
- J. Zou, Z. Yin, K. Ding, Q. Tang, J. Li, W. Si, J. Shao, Q. Zhang, W. Huang and X. Dong, ACS Appl. Mater. Interfaces, 2017, 9, 32475 CAS.
- V. Marx, Nat. Methods, 2015, 12, 187 CrossRef CAS PubMed.
- H. Liu, T. Peng, H. Sun, L. Fan and B. Guo, Adv. Mater. Res., 2010, 96, 105 CrossRef CAS.
- X. Wang, A. Ugur, H. Goktas, N. Chen, M. Wang, N. Lachman, E. Kalfon-Cohen, W. Fang, B. L. Wardle and K. K. Gleason, ACS Sens., 2016, 1, 374 CrossRef CAS.
- S. Chatterjee, M. Castro and J. F. Feller, Sens. Actuators, B, 2015, 220, 840 CrossRef CAS.
- C. Yang, T. Chen, Y. Yang, M. Meyyappan and C. Lai, Sens. Actuators, B, 2017, 253, 77 CrossRef CAS.
- M. G. Campbell, S. F. Liu, T. M. Swager and M. Dincă, J. Am. Chem. Soc., 2015, 137, 13780 CrossRef CAS PubMed.
- S. S. Park, C. H. Hendon, A. J. Fielding, A. Walsh, M. O’Keeffe and M. Dincă, J. Am. Chem. Soc., 2017, 139, 3619 CrossRef CAS PubMed.
- M. A. Palacios, Z. Wang, V. A. Montes, G. V. Zyryanov and P. Anzenbacher, J. Am. Chem. Soc., 2008, 130, 10307 CrossRef CAS PubMed.
- M. A. Palacios, R. Nishiyabu, M. Marquez and P. Anzenbacher, J. Am. Chem. Soc., 2007, 129, 7538 CrossRef CAS PubMed.
- Y. Cao, L. Zhang, X. Huang, Y. Xin and L. Ding, ACS Appl. Mater. Interfaces, 2016, 8, 35650 CAS.
Footnote |
| † Electronic supplementary information (ESI) available: Synthetic procedures, characterization data, NMR spectra, single crystal structures and crystallographic data, optical photos and some fluorescence spectra. CCDC 1581987. For ESI and crystallographic data in CIF or other electronic format see DOI: 10.1039/c7sc05243j |
| This journal is © The Royal Society of Chemistry 2018 |