 Open Access Article
Near-infrared triggered strand displacement amplification for MicroRNA quantitative detection in single living cells†
Wenhao
Dai
ab,
Haifeng
Dong
 *ab,
Keke
Guo
ab and
Xueji
Zhang
*ab
aResearch Center for Bioengineering and Sensing Technology, School of Chemistry and Bioengineering, University of Science & Technology Beijing, Beijing 100083, P. R. China. E-mail: hfdong@ustb.edu.cn; zhangxueji@ustb.edu.cn
bNational Institute of Precision Medicine & Health, Beijing, 100083, P. R. China
First published on 28th November 2017
Abstract
As an important modulator of gene expression, microRNA (miRNA) has been described as a promising biomarker for the early diagnosis of cancers. A non-invasive method for real-time sensitive imaging and monitoring of miRNA in living cells is in urgent demand. Although some amplified methods have been developed, few can be programmed to assemble single intelligent nanostructures to realize sensitive intracellular miRNA detection without extra addition of an enzyme or catalytic fuel. Herein, two programmable oligonucleotide hairpin probe functionalized gold nanorods (THP-AuNRs) were designed to develop a near-infrared (NIR) laser triggered target strand displacement amplification (SDA) approach for sensitive miRNA imaging quantitative analysis in single living cells and multicellular tumor spheroids (MCTSs). Such a NIR-triggered SDA strategy achieves facile and sensitive monitoring of a model oncogenic miRNA-373 in various cancer lines and MCTS simulated tumor tissue. Notably, using a linear regression equation derived from miRNA mimics, a quantitative method of miRNA in single living cells was realized due to the high sensitivity. This provides a new way for sensitive real-time monitoring of intracellular miRNA, and may be promising for miRNA-based biomedical applications.
Introduction
MicroRNA (miRNA) is a crucial endogenous modulator of gene expression in various physiological and pathological processes.1,2 Specifically, it has been demonstrated to play significant tumor-promoting and tumor-suppressive functions.3,4 Therefore, direct non-invasive imaging of miRNA in living cells and real-time monitoring of the intracellular miRNA levels are valuable for early diagnosis of cancer.5–7 However, intracellular miRNA detection is challenging because of its unique properties of small size, high sequence similarity among family members and especially low abundance.8–10 Moreover, current prevailing fluorescence in situ hybridization (FISH) technology for intracellular miRNA detection also suffers from low sensitivity due to a one-target-one-triggered signal model, semi-quantification and complicated operation steps.11–14 Therefore, the development of a sensitive, specific and convenient quantitative strategy is imperative for accurate intracellular miRNA analysis in the early clinical diagnosis of cancer.15,16Toehold-mediated strand displacement amplification (SDA) is a rapid isothermal process that permits exponential amplification of a target sequence in less than 15 min.17,18 The reaction is triggered by a target sequence and recycled by assistant strands through a thermodynamically driven entropy gain process in order to achieve signal amplification, which has seen increasing use in in vitro qualitative or quantitative DNA or RNA analysis.19–22 The isothermal and enzyme-free nature of SDA is possibly suitable for intracellular nucleic acid analysis, however little research has been reported to this point. Ma et al. have recently reported a toehold-initiated SDA amplification strategy to image intracellular miRNA, which was limited by its complicated two-step transfection process.23 Therefore, integrating programmable oligonucleotide probes into a single nano-vector with efficient cell transfection and controllable intracellular probe release properties is highly desired for toehold-initiated SDA-based intracellular miRNA detection.
Nanomaterials with unique optical properties have attracted great attention in the design of a wide range of plasmonic, fluorescent and Raman probes for cellular imaging.24 For example, metal nanoparticles can be used in fluorescent imaging due to their unique property of localized surface plasmon resonance (LSPR) and super-quenching ability. Anisotropic gold nanorods (AuNRs) find many applications for the precise and regioselective functionalization of different DNA strands or other biomolecules for DNA detection and other biomolecule analysis.25–27 Oligonucleotide-nanoparticle conjugates facilitate cell uptake and prevent resistance to degradation by nucleases of cargo, which make them especially suitable for cellular imaging.24,28–30 Notably, the strong surface plasmonic behavior of AuNRs makes them promising in photothermal therapy (PTT) and thermodynamically tunable release.31–34 These properties provide opportunities for toehold-initiated SDA-based intracellular miRNA detection.
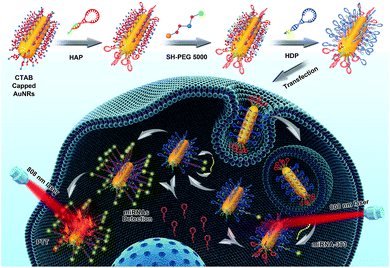
Herein, we regioselectively functionalized two types of programmable oligonucleotide hairpin probe, the hairpin assistant probe and dye-labeled hairpin detection probe (HDP) on the terminal and side surfaces of AuNRs (THP-AuNRs), to develop a sensitive and facile intracellular miRNA detection method based on a near-infrared (NIR) laser induced target SDA mechanism (Scheme 1). Photoluminescence (PL) of HDP is quenched by AuNRs in THP-AuNRs and the hybridization of HDP with the target miRNA causes the separation of the fluorescent dye from the surface of the AuNRs, leading to the recovery of PL. Under irradiation with an 808 nm NIR laser, HAP connected to the terminal surface through a DNA linker is thermodynamically released from the terminal surface of AuNRs due to the photothermal effect of AuNRs. The released HAP displaces the hybridized target miRNA on THP-AuNPs, triggering a target SDA for sensitive miRNA detection. The designed strategy provided excellent analytical performance during miRNA analysis in living cells and multicellular tumor spheroids (MCTSs). Notably, a quantitative method in single living cells was realized using a linear regression equation derived from miRNA mimics based on the NIR-triggered SDA strategy because of its high sensitivity. It provides an innovation towards intracellular miRNA detection and miRNA-based biomedical research.
Results and discussion
Feasibility of SDA for miRNA detection in vitro
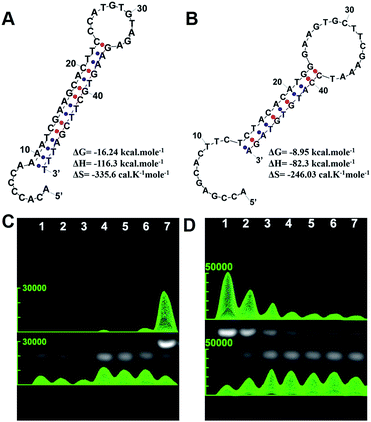
Using oncogenic miRNA-373 in breast cancer cells as a model, the programmable HAP and HDP were designed for SDA-based miRNA detection (Fig. S1†). The structures of HAP and HDP are drawn in Fig. 1A and Fig. 1B, and the relevant parameters including ΔG (Gibbs free energy), ΔH (enthalpy change) and ΔS (entropy change) were calculated by an Oligo Analyzer 3.1 under the condition of PBS buffer (pH 7.4) containing 137 mM NaCl. ΔG is employed to estimate a spontaneous or anastrophic reaction, which can characterize the feasibility of the SDA process theoretically. ΔH is used to identify an exothermic or endothermic reaction, which can evaluate the stability of the designed stem-loop structure. Gel electrophoresis experiments were performed to verify the HAP-mediated miRNA SDA process (Fig. 1C and S2†). Lanes 1–3 are HDP, HAP and miRNA-373, respectively. The obvious single electrophoresis band indicates that no secondary structure exists in the rationally designed DNA probes and target miRNA. Negligible spontaneous hybridization between HDP and HAP (lane 4) and interaction between HAP and the target miRNA (lane 5) after incubation for 1 h are observed. A new band (24.62%), related to a HDP-miRNA duplex structure, is displayed in lane 6, suggesting the recognition of HDP to target miRNA. An obvious new band (73.97%), assigned to the HDP-HAP duplex structure, is observed in the mixture containing miRNA-373, HDP and HAP incubated for 1 h (lane 7). As shown in Fig. 1D, the amount of the HDP-HAP duplex structure increased with the increase of target miRNA. This revealed that HAP could effectively trigger SDA for target miRNA detection in vitro with different concentrations.We then regioselectively functionalized HDP and HAP on the terminal and side surfaces of AuNRs following previous protocols, and detailed information can be seen in the materials and methods.26,35–38 The 3′ region of HAP (Fig. S1†) was first optimized to ensure that HAP could be controlled by thermodynamic release. HAP-D with a melting temperature (Tm) of about 42.4 °C was selected that showed good stability at physiological temperature and could be rapidly and effectively thermodynamically released by NIR-laser irradiation (Fig. S3 and 4†). Transmission electron microscopy (TEM) analysis confirmed the synthesized AuNRs with good monodispersibility, and the average length and width was 49.71 ± 2.58 nm and 11.96 ± 0.98 nm, respectively (Fig. S5†). The UV-vis spectra (Fig. S6†), dynamic light scattering (DLS) (Fig. S7†) and zeta potential (Fig. S8†) characterizations verified that HAP and HDP were successfully functionalized on the AuNRs (THP-AuNRs). The average number of HAP and HDP modified on each THP-AuNR was estimated to be 20 ± 3 and 36 ± 5, respectively (Fig. S9†), which exhibited excellent stability in physiological conditions for two weeks (Fig. S10–12†).39
Photoachievable release of THP-AuNR nanoprobes
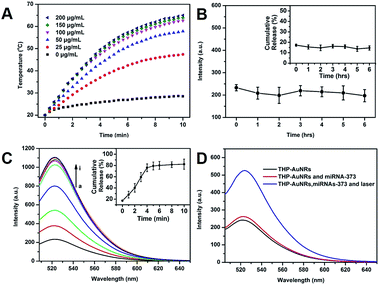
The photothermal effect of THP-AuNRs was investigated. As shown in Fig. 2A, the temperature of THP-AuNRs at different concentrations increased with the increase of time under irradiation by an 808 nm NIR laser (0.64 W cm−2). The temperature increased by 41 °C at a low concentration of 50 μg mL−1 when exposed to irradiation for 10 min at a level much higher than the PBS control group of 8.5 °C. THP-AuNRs showed high photothermal conversion efficiency (∼27.82%) (Fig. S13†) and good photothermal stability (Fig. S14–16†). These results suggested the feasibility of THP-AuNRs to produce an adequate photothermal effect for probe release. The release of HAP from the THP-AuNRs in different conditions was investigated using fluorescent dye-labeled HAP. When compared to the slight release of HAP at a physiological temperature of 37 °C in 6 h (Fig. 2B), a remarkably higher cumulative release rate of 81.8% was achieved when the THP-AuNRs solution was subjected to NIR laser irradiation for 5 min, and the higher release rate was caused by thermally-induced DNA melting or dehybridization (Fig. 2C).33,34,40 Furthermore, Fig. 2D confirmed that NIR irradiation triggered SAD for in vitro miRNA detection based on the nanostructure of the THP-AuNRs. The addition of target miRNA-373 led to fluorescence recovery since HDP partially hybridized with the target, while much stronger fluorescence was observed when the mixture was irradiated by an 808 nm NIR laser due to thermally-induced numerous HAP release for assisting target SDA recirculation.Cytotoxicity and phototoxicity of the THP-AuNRs nanoprobes
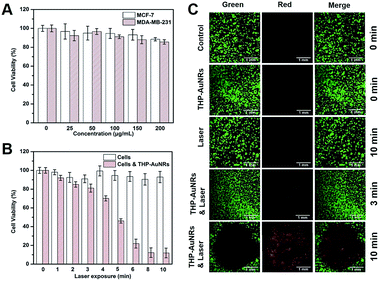
The cytotoxicity and phototoxicity of the THP-AuNR nanoprobe were studied using a 3-(4,5-dimethyl-2-thiazolyl)-2,5-diphenyltetrazolium bromide (MTT) assay and a calcein AM/propidium iodide (PI) staining assay. As shown in Fig. 3A, THP-AuNRs displayed low cytotoxicity towards both MCF-7 and MDA-MB-231 cells, and the cell viabilities were almost 90%, even when the concentration increased to 200 μg mL−1, demonstrating the good biocompatibility of THP-AuNRs. Fig. 3B shows that the NIR-laser (808 nm, 0.64 W cm−2) exposure induced slight cytotoxicity to MCF-7 cells in 10 min. The THP-AuNR-incubated MCF-7 cells displayed high cell viabilities after 3 min irradiation, but the longer irradiation time caused high photocytotoxicity due to THP-AuNRs inducing photothermal ablation. Similar results were observed for the MDA-MB-231 cells (Fig. S17†). Therefore, we chose 3 min as the irradiation time to ensure an effective thermodynamic release and low photothermal ablation. The calcein AM/PI staining assay analysis showed low cytotoxicity for both the laser exposure and THP-AuNRs on their own (Fig. 3C). Good viability can be observed for the THP-AuNR-incubated MCF-7 cells exposed to the NIR laser for 3 min, however, almost all the cells were killed and displayed red fluorescence when the exposed time increased to 10 min (Fig. 3C). It is worth mentioning that the good photothermal effect of the THP-AuNR nanoprobe made it promising in PTT.Quantitative detection of intracellular miRNA-373
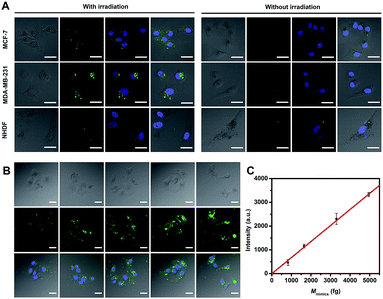
miRNA-373 imaging analysis in living cells, including in two breast cancer cell lines of MCF-7 and MDA-MB-231 (high expression of miRNA-373) and in a control cell line with normal human dermal fibroblasts (NHDF, low expression of miRNA-373), was carried out. After THP-AuNRs were incubated with cell lines for 4 h, weak fluorescence signals in MCF-7 and MDA-MB-231 cells and no fluorescence signal in NHDF cells were observed (Fig. 4A). This revealed the low sensitivity of THP-AuNR-based intracellular miRNA detection without the NIR-laser triggered target SDA process. Conversely, under irradiation of the NIR-laser, both the THP-AuNR-incubated MCF-7 and MDA-MB-231 cells displayed a strong green fluorescence signal related to the recognition of target miRNA (Fig. 4A). Notably, little green fluorescence was observed in the NHDF cells attributed to the high sensitivity of the THP-AuNR nanoprobe. These results suggested that the THP-AuNR-based NIR-laser triggered target SDA strategy could high-sensitively visualize a low-abundance of miRNA in living cells. Previously reported direct fluorescence nucleic acid imaging methods including molecular beacons,11 nanobeacons41 and nanoflares42,43 are designed on a “one-to-one” basis and are not competent for imaging low-abundance miRNA. The proposed “one-to-many” signal amplification strategy is preferably facilitated for the sensitive imaging of low-abundance miRNA in living cells.Furthermore, we used miRNA-373 mimics to quantify intracellular miRNA-373 in a single cell by transfecting cells with a different concentration of miRNA-373 mimics. The fluorescence intensity increased with an increase of transfected miRNA-373 mimic concentrations (Fig. 4B), and the average fluorescence intensity showed a linear relationship with the concentrations of the miRNA-373 mimics (Fig. 4C). The average level of miRNA-373 in a single MCF-7 cell was estimated to be 764 ± 116 fg (see detailed information in Table S1 and 2†), according to the linear regression equation. Similarly, the average level of miRNA-373 in a single MDA-MB-231 and NHDF cell was calculated to be 1532 ± 98 and 89 ± 26 fg, respectively.
Target miRNA imaging analysis in MCTS
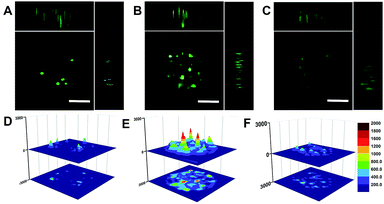
We also employed MCTS to simulate tumor tissue and evaluated the feasibility of the THP-AuNR nanoprobe for miRNA in vivo imaging detection. As expected, weak fluorescence signals were observed in MCF-7 MCTS without NIR-laser exposure after incubation of THP-AuNRs for 8 h (Fig. 5A and D). Much stronger green fluorescence intensities were presented when THP-AuNR-incubated MCF-7 MCTS was irradiated by an 808 nm NIR-laser (Fig. 5B and E). For comparison, the fluorescence intensity of MCF-7 MCTS had little change after 24 h without irradiation by an 808 nm NIR-laser (Fig. 5C and F). As shown in Fig. 5D–F the surface plots further confirmed the good penetration ability of THP-AuNRs and the high sensitivity of the target SDA process. Compared to the weak fluorescence intensity of THP-AuNR-treated MCF-7 MCTS without NIR-laser exposure (Fig. 5D and F), a much stronger fluorescence intensity was observed in MCF-7 MCTS with NIR-laser exposure due to the NIR triggered SDA process (Fig. 5E). These results indicated that the THP-AuNR nanoprobe could be effectively transfected into MCTS and triggered by an 808 nm NIR-laser for target SDA-based sensitive miRNA detection. The PTT effect on MCTS was also confirmed with the prolonging of the NIR-laser irradiation time (Fig. S18†). These data demonstrated the great hope of the THP-AuNR nanoprobe for in vivo miRNA high-sensitive detection and PTT therapeutics.Conclusions
An AuNR nanoprobe regioselectively functionalized with two programmable hairpin probes for highly sensitive miRNA imaging detection in single living cells based on an NIR-laser triggered target SDA process was developed. The dye-labeled HDP on the side surface of AuNRs could hybridize with target miRNA to form a duplex structure and produce a fluorescence signal for detection, and NIR irradiation thermodynamically induced the numerous release of HAP on the terminal surface due to the photothermal effect of AuNRs. The released HAP triggered the target SDA process to produce a strong fluorescence for miRNA detection. The proposed THP-AuNR-based and NIR-laser triggered SDA strategy could sensitively detect oncogenic miRNA-373 in various living cells and MCTS (mimics of cancer tissue). Meanwhile, single cell miRNA-373 expression levels were quantified using a linear regression equation derived from miRNA mimics. The proposed detection strategy may open a new avenue for intracellular nucleic acid detection and clinical diagnosis of early stages of cancer.Experimental
Agarose gel electrophoresis assays
Experiments were performed in 10 mM PBS buffer with 137 mM NaCl, pH 7.4. HDP (1 μM) was analyzed alone or mixed with HAP (1 μM) and target miRNA-373 (1 μM) for 1 h at 37 °C. The final volume of the solution was 50 μL. The sample was loaded onto a 4.0% agarose gel to separate the HDP-HAP complex from the substrate. 1 × tris-acetic-EDTA (TAE) buffer (90 mM tris, 90 mM acetic acid, and 10 mM EDTA, pH 8.0) was used as the running buffer. The gel was run for 1 hour at a constant current of 50 mA and the gel image was acquired with a gel-imaging system (UVItec FireReader, UK).44Optimized HAP experiments were performed in 10 mM PBS buffer with 137 mM NaCl, pH 7.4. HAP-A, B, C, D and E (1 μM) was analyzed alone or mixed with a linker (1 μM) for 1 h at 37 °C. The final volume of the solution used to separate the HDP-HAP complex from the substrate was 50 μL and the other experimental conditions were the same as in the above protocol.
Amplified experiments were performed in 10 mM PBS buffer with 137 mM NaCl, pH 7.4. HAP-D (1 μM) was analyzed mixed with HDP (1 μM) and different concentrations of target miRNA-373 (1000, 100, 10, 1, 0.1, 0.01 and 0.001 nM) for 1 h at 37 °C. The final volume of the solution used to separate the HDP-HAP complex from the substrate was 50 μL and the other experimental conditions were the same as in the above protocol.
Synthesis and characterization of DNA-modified AuNRs
Before conjugation, the thiol-functionalized oligonucleotide linkers (10 μM) and HAP (10 μM) were hybridized in 10 mM PBS (pH 7.4, 137 mM NaCl) buffer for 1 h at 37 °C. AuNRs were centrifuged at 13![[thin space (1/6-em)]](https://www.rsc.org/images/entities/char_2009.gif) 000 rpm for 15 min in order to remove excess ascorbic acid, AgNO3 and small spherical particles. The functionalization of AuNRs followed published protocols.35−38,45 Briefly, the hybridization of oligonucleotide linker-HAP (10 μM, 50 μL) was activated by 0.1 mM TCEP (1
000 rpm for 15 min in order to remove excess ascorbic acid, AgNO3 and small spherical particles. The functionalization of AuNRs followed published protocols.35−38,45 Briefly, the hybridization of oligonucleotide linker-HAP (10 μM, 50 μL) was activated by 0.1 mM TCEP (1![[thin space (1/6-em)]](https://www.rsc.org/images/entities/char_2009.gif) :
:![[thin space (1/6-em)]](https://www.rsc.org/images/entities/char_2009.gif) 100 molar ratio) for 1 hour at room temperature in order to cleave the disulfide bond, was mixed with 1000 μL of 50 μg mL−1 purified AuNR solution, and then incubated overnight at room temperature with gentle stirring. Subsequently, to stabilize and increase biocompatibility, 50 μL of 1 mM freshly prepared thiolated modified PEG-5000 (SH-PEG) solution was added to the AuNR-HAP solution. The resultant mixture solution settled for 1 h at room temperature, followed by centrifugation at 12
100 molar ratio) for 1 hour at room temperature in order to cleave the disulfide bond, was mixed with 1000 μL of 50 μg mL−1 purified AuNR solution, and then incubated overnight at room temperature with gentle stirring. Subsequently, to stabilize and increase biocompatibility, 50 μL of 1 mM freshly prepared thiolated modified PEG-5000 (SH-PEG) solution was added to the AuNR-HAP solution. The resultant mixture solution settled for 1 h at room temperature, followed by centrifugation at 12![[thin space (1/6-em)]](https://www.rsc.org/images/entities/char_2009.gif) 000 rpm for 15 min. Subsequently, 50 μL of 10 μM thiolated modified HDP solution (activated by TCEP) was added to the above mixed solution and incubated overnight at room temperature. Finally, the multi-modified AuNR solution was aged for another 12 h with 0.1 M NaCl, washed by centrifugation at 12
000 rpm for 15 min. Subsequently, 50 μL of 10 μM thiolated modified HDP solution (activated by TCEP) was added to the above mixed solution and incubated overnight at room temperature. Finally, the multi-modified AuNR solution was aged for another 12 h with 0.1 M NaCl, washed by centrifugation at 12![[thin space (1/6-em)]](https://www.rsc.org/images/entities/char_2009.gif) 000 rpm for 15 min with ultrapure water for three times and stored in 10 mM PBS (pH 7.4, 137 mM NaCl) buffer at 4 °C for the next step. UV-vis, zeta potential and DLS measurements were used to investigate changes in absorption, surface potential and size in response to modified SH-PEG and different oligonucleotides, progressively.
000 rpm for 15 min with ultrapure water for three times and stored in 10 mM PBS (pH 7.4, 137 mM NaCl) buffer at 4 °C for the next step. UV-vis, zeta potential and DLS measurements were used to investigate changes in absorption, surface potential and size in response to modified SH-PEG and different oligonucleotides, progressively.
Determination of DNA number on AuNRs
AuNRs coated with HDP-FAM were prepared and purified according to the above protocol. Then, 1000 μL HDP-FAM-AuNRs (50 μg mL−1) was mixed with 30 μL DL-dithiothreitol (DTT, 10 mM). After incubation for 1 hour at 60 °C, the solution was centrifuged at 13![[thin space (1/6-em)]](https://www.rsc.org/images/entities/char_2009.gif) 000 rpm for 15 min and the supernatant was collected for fluorescence measurement. In order to determine the number of HAP molecules on AuNRs, FAM-labeled HAP was used for the measurement.
000 rpm for 15 min and the supernatant was collected for fluorescence measurement. In order to determine the number of HAP molecules on AuNRs, FAM-labeled HAP was used for the measurement.
Photothermal performance in vitro
Photothermal performance was measured using a custom setup. A 1 cm path length quartz cuvette containing 1 mL of the sample was covered with a variety of concentrations from 0–200 μg mL−1. The bottom of the cuvette was kept about 0.5 cm above the magnetic stirrer. A fiber-coupled continuous semiconductor diode laser (808 nm, Hi-Tech Optoelectronics Co., Ltd, Beijing, China) with a power density of 0.64 W cm−2 was used as the light source. The temperature of the solution was measured by a digital thermometer with a thermocouple probe and recorded once every 2 s. An infrared thermal imaging camera (Fluke TiS65, USA) was used to monitor the temperature change.Photothermal conversion efficiency was calculated by Roper’s method. The temperature change of the THP-AuNR assembly (50 μg mL−1) was recorded under irradiation by an 808 nm laser (0.64 W cm−2). The laser was turned off after irradiation for 10 min and the dispersion solution temperature was measured until it reached room temperature.
Tunable release of TAP-D from multi-modified AuNRs
The THP-AuNR assembly (50 μg mL−1) in PBS (10 mM, pH = 7.4, with 137 mM NaCl) solution (1 mL) was transferred into a 1 cm path length quartz cuvette and was pre-heated at 37 °C for 30 min. Each solution was irradiated for a corresponding time between 0–10 min and immediately ultracentrifugated at 13![[thin space (1/6-em)]](https://www.rsc.org/images/entities/char_2009.gif) 000 rpm for 15 min at 4 °C. The supernatant was collected and diluted to measure the photoluminescence spectrum for the released HAP-D and the relevant standard curves, similar to the process for the determination of the DNA number on AuNRs. Control release experiments were performed similarly without laser exposure at 37 °C for 1–6 h incubation time.
000 rpm for 15 min at 4 °C. The supernatant was collected and diluted to measure the photoluminescence spectrum for the released HAP-D and the relevant standard curves, similar to the process for the determination of the DNA number on AuNRs. Control release experiments were performed similarly without laser exposure at 37 °C for 1–6 h incubation time.
In Vivo phototoxicity assessment
The MCF-7 cells (5 × 10⁴) were cultured for 12 h in a 3 cm dish, and then the medium was replaced with fresh Opti-MEM on its own or medium containing the AuNR nanoprobe (50 μg mL−1) and incubated for another 4 h. After washing each well twice with PBS (10 mM, pH = 7.4), fresh DMEM medium (1 mL) was added and cultured for 12 h, and then the cells were irradiated with an 808 nm laser at a power of 0.64 W cm−2.Intracellular miRNA imaging
MCF-7 cells and MDA-MB-231 cells (1.0 × 10⁴) were cultivated in a cell culture dish with a glass bottom (WHB) containing DMEM (1 mL) for 12 h. The medium was then replaced with fresh Opti-MEM (500 μL) alone as a control or with fresh Opti-MEM containing the THP-AuNR assembly (50 μg mL−1) and cultivated for 4 h. After washing each well twice with PBS (10 mM, pH = 7.4), fresh DMEM medium (1 mL) was added and cultured for 4 h. The cell culture dish with a glass bottom was exposed to an 808 nm laser (0.64 W cm−2) for 3 min and was incubated for another 8 h before detection by a laser scanning microscope.MCTS miRNA imaging
MCTSs were cultivated in a cell culture dish with a glass bottom (WHB) containing DMEM (1 mL) for 12 h. The medium was then replaced with fresh Opti-MEM containing the THP-AuNR assembly (50 μg mL−1) and cultivated for 4 h. After washing each well twice with PBS (10 mM, pH = 7.4), fresh DMEM medium (1 mL) was added and the cells cultured for 8 h. The cell culture dish with a glass bottom was exposed to an 808 nm laser (0.64 W cm−2) for 3 min and was incubated for another 16 h before detection by a laser scanning microscope.Conflicts of interest
There are no conflicts of interest to declare.Acknowledgements
We are grateful to Dr Robert Langer for his valuable advice and comments on this project. The work was supported by the Special Foundation for State Major Research Program of China (Grant No. 2016YFC0106602 and 2016YFC0106601); the National Natural Science Foundation of China (Grant No. 21645005 and 21475008); the Open Research Fund Program of Beijing Key Lab of Plant Resource Research and Development, Beijing Technology and Business University (PRRD-2016-YB2).Notes and references
- D. P. Bartel, Cell, 2004, 116, 281–297 CrossRef CAS PubMed.
- S. Volinia, G. A. Calin, C.-G. Liu, S. Ambs, A. Cimmino, F. Petrocca, R. Visone, M. Iorio, C. Roldo, M. Ferracin, R. L. Prueitt, N. Yanaihara, G. Lanza, A. Scarpa, A. Vecchione, M. Negrini, C. C. Harris and C. M. Croce, Proc. Natl. Acad. Sci. U. S. A., 2006, 103, 2257–2261 CrossRef CAS PubMed.
- G. A. Calin and C. M. Croce, Nat. Rev. Cancer, 2006, 6, 857–866 CrossRef CAS PubMed.
- N. Kosaka, H. Iguchi and T. Ochiya, Cancer Sci., 2010, 101, 2087–2092 CrossRef CAS PubMed.
- A. Esquela-Kerscher and F. J. Slack, Nat. Rev. Cancer, 2006, 6, 259–269 CrossRef CAS PubMed.
- K. Ruan, X. Fang and G. Ouyang, Cancer Lett., 2009, 285, 116–126 CrossRef CAS PubMed.
- A. Gupta, J. J. Gartner, P. Sethupathy, A. G. Hatzigeorgiou and N. W. Fraser, Nature, 2006, 442, 82–85 CrossRef CAS PubMed.
- Y. Cheng, X. Zhang, Z. Li, X. Jiao, Y. Wang and Y. Zhang, Angew. Chem., Int. Ed., 2009, 48, 3268–3272 CrossRef CAS PubMed.
- Y. Cao, R. A. DePinho, M. Ernst and K. Vousden, Nat. Rev. Cancer, 2011, 11, 749–754 CrossRef CAS PubMed.
- H. F. Dong, J. P. Lei, L. Ding, Y. Q. Wen, H. X. Ju and X. J. Zhang, Chem. Rev., 2013, 113, 6207–6233 CrossRef CAS PubMed.
- H. F. Dong, J. P. Lei, H. X. Ju, F. Zhi, H. Wang, W. J. Guo, Z. Zhu and F. Yan, Angew. Chem., Int. Ed., 2012, 51, 4607–4612 CrossRef CAS PubMed.
- Z. Zhang, Y. Wang, N. Zhang and S. Zhang, Chem. Sci., 2016, 7, 4184–4189 RSC.
- R. Deng, L. Tang, Q. Tian, Y. Wang, L. Lin and J. Li, Angew. Chem., Int. Ed., 2014, 53, 2389–2393 CrossRef CAS PubMed.
- P. Zhang, C. Wang, J. Zhao, A. Xiao, Q. Shen, L. Li, J. Li, J. Zhang, Q. Min, J. Chen, H.-Y. Chen and J.-J. Zhu, ACS Nano, 2016, 10, 3637–3647 CrossRef CAS PubMed.
- W. Ma, P. Fu, M. Sun, L. Xu, H. Kuang and C. Xu, J. Am. Chem. Soc., 2017, 129, 11752–11759 CrossRef PubMed.
- C.-P. Liang, P.-Q. Ma, H. Liu, X. Guo, B.-C. Yin and B.-C. Ye, Angew. Chem., Int. Ed., 2017, 56, 9077–9081 CrossRef CAS PubMed.
- G. T. Walker, M. C. Little, J. G. Nadeau and D. D. Shank, Proc. Natl. Acad. Sci. U. S. A., 1992, 89, 392–396 CrossRef CAS.
- G. T. Walker, C. P. Linn and J. G. Nadeau, Nucleic Acids Res., 1996, 24, 348–353 CrossRef CAS PubMed.
- G. T. Walker, M. S. Fraiser, J. L. Schram, M. C. Little, J. G. Nadeau and D. P. Malinowski, Nucleic Acids Res., 1992, 20, 1691–1696 CrossRef CAS PubMed.
- Y. S. Jiang, S. Bhadra, B. Li and A. D. Ellington, Angew. Chem., Int. Ed., 2014, 53, 1845–1848 CrossRef CAS PubMed.
- Y. Jiang, B. Li, J. N. Milligan, S. Bhadra and A. D. Ellington, J. Am. Chem. Soc., 2013, 135, 7430–7433 CrossRef CAS PubMed.
- P. Yin, H. M. T. Choi, C. R. Calvert and N. A. Pierce, Nature, 2008, 451, 318–322 CrossRef CAS PubMed.
- X. He, T. Zeng, Z. Li, G. Wang and N. Ma, Angew. Chem., Int. Ed., 2016, 55, 3073–3076 CrossRef CAS PubMed.
- H. Xu, Q. Li, L. H. Wang, Y. He, J. Y. Shi, B. Tang and C. H. Fan, Chem. Soc. Rev., 2014, 43, 2650–2661 RSC.
- W. Ma, H. Kuang, L. G. Xu, L. Ding, C. L. Xu, L. B. Wang and N. A. Kotov, Nat. Commun., 2013, 4, 8 Search PubMed.
- L. G. Xu, H. Kuang, C. L. Xu, W. Ma, L. B. Wang and N. A. Kotov, J. Am. Chem. Soc., 2012, 134, 1699–1709 CrossRef CAS PubMed.
- C. Zhou, X. Duan and N. Liu, Nat. Commun., 2015, 6, 8102 CrossRef CAS PubMed.
- N. J. Durr, T. Larson, D. K. Smith, B. A. Korgel, K. Sokolov and A. Ben-Yakar, Nano Lett., 2007, 7, 941–945 CrossRef CAS PubMed.
- L. Wang, Y. Zhu, L. Xu, W. Chen, H. Kuang, L. Liu, A. Agarwal, C. Xu and N. A. Kotov, Angew. Chem., Int. Ed., 2010, 49, 5472–5475 CrossRef CAS PubMed.
- J. Pérez-Juste, I. Pastoriza-Santos, L. M. Liz-Marzán and P. Mulvaney, Coord. Chem. Rev., 2005, 249, 1870–1901 CrossRef.
- A. Wijaya, S. B. Schaffer, I. G. Pallares and K. Hamad-Schifferli, ACS Nano, 2009, 3, 80–86 CrossRef CAS PubMed.
- D. Agudelo, P. Bourassa, G. Berube and H. A. Tajmir-Riahi, Int. J. Biol. Macromol., 2014, 66, 144–150 CrossRef CAS PubMed.
- D. Wang, Z. Xu, H. Yu, X. Chen, B. Feng, Z. Cui, B. Lin, Q. Yin, Z. Zhang, C. Chen, J. Wang, W. Zhang and Y. Li, Biomaterials, 2014, 35, 8374–8384 CrossRef CAS PubMed.
- V. Raeesi, L. Y. Chou and W. C. Chan, Adv. Mater., 2016, 28, 8511–8518 CrossRef CAS PubMed.
- L. G. Xu, H. Kuang, L. B. Wang and C. L. Xu, J. Mater. Chem., 2011, 21, 16759–16782 RSC.
- S. J. Zhen, C. Z. Huang, J. Wang and Y. F. Li, J. Phys. Chem. C, 2009, 113, 21543–21547 CAS.
- J. Wang, G. Z. Zhu, M. X. You, E. Q. Song, M. I. Shukoor, K. J. Zhang, M. B. Altman, Y. Chen, Z. Zhu, C. Z. Huang and W. H. Tan, ACS Nano, 2012, 6, 5070–5077 CrossRef CAS PubMed.
- Y. Y. Zhu, L. G. Xu, W. Ma, Z. Xu, H. Kuang, L. B. Wang and C. L. Xu, Chem. Commun., 2012, 48, 11889–11891 RSC.
- S. J. Hurst, A. K. R. Lytton-Jean and C. A. Mirkin, Anal. Chem., 2006, 78, 8313–8318 CrossRef CAS PubMed.
- M. Reismann, J. C. Bretschneider, G. von Plessen and U. Simon, Small, 2008, 4, 607–610 CrossRef CAS PubMed.
- S. P. Song, Z. Q. Liang, J. Zhang, L. H. Wang, G. X. Li and C. H. Fan, Angew. Chem., Int. Ed., 2009, 48, 8670–8674 CrossRef CAS PubMed.
- Y. J. Yang, J. Huang, X. H. Yang, K. Quan, H. Wang, L. Ying, N. L. Xie, M. Ou and K. M. Wang, J. Am. Chem. Soc., 2015, 137, 8340–8343 CrossRef CAS PubMed.
- T. L. Halo, K. M. McMahon, N. L. Angeloni, Y. L. Xu, W. Wang, A. B. Chinen, D. Malin, E. Strekalova, V. L. Cryns, C. H. Cheng, C. A. Mirkin and C. S. Thaxton, Proc. Natl. Acad. Sci. U. S. A., 2014, 111, 17104–17109 CrossRef CAS PubMed.
- H. Lee, J. E. Park and J. M. Nam, Nat. Commun., 2014, 5, 7 Search PubMed.
- L. Xu, H. Kuang, C. Xu, W. Ma, L. Wang and N. A. Kotov, J. Am. Chem. Soc., 2012, 134, 1699–1709 CrossRef CAS PubMed.
Footnote |
| † Electronic supplementary information (ESI) available: Additional documentation (18 figures and 2 tables) including the reaction scheme, hybridization efficiency, optimized HAP experiments, TEM, UV-vis, DLS, zeta potential, PL spectra, stability, photothermal conversion efficiency, photothermal stability, MTT experiments, three-dimensional confocal fluorescence reconstruction images and quantified intracellular miRNA-373 experimental data. See DOI: 10.1039/c7sc04243d |
| This journal is © The Royal Society of Chemistry 2018 |

