 Open Access Article
Dye-sensitized electron transfer from TiO2 to oxidized triphenylamines that follows first-order kinetics
Brian N.
DiMarco
 ,
Ludovic
Troian-Gautier
 ,
Renato N.
Sampaio
 and
Gerald J.
Meyer
 *
*
Department of Chemistry, University of North Carolina at Chapel Hill, Chapel Hill, North Carolina 27599-3290, USA. E-mail: gjmeyer@email.unc.edu
First published on 17th November 2017
Abstract
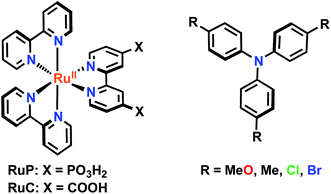
Two sensitizers, [Ru(bpy)2(dcb)]2+ (RuC) and [Ru(bpy)2(dpb)]2+ (RuP), where bpy is 2,2′-bipyridine, dcb is 4,4′-dicarboxylic acid-2,2′-bipyridine and dpb is 4,4′-diphosphonic acid-2,2′-bipyridine, were anchored to mesoporous TiO2 thin films and utilized to sensitize the reaction of TiO2 electrons with oxidized triphenylamines, TiO2(e−) + TPA+ → TiO2 + TPA, to visible light in CH3CN electrolytes. A family of four symmetrically substituted triphenylamines (TPAs) with formal Eo(TPA+/0) reduction potentials that spanned a 0.5 eV range was investigated. Surprisingly, the reaction followed first-order kinetics for two TPAs that provided the largest thermodynamic driving force. Such first-order reactivity indicates a strong Coulombic interaction between TPA+ and TiO2 that enables the injected electron to tunnel back in one concerted step. The kinetics for the other TPA derivatives were non-exponential and were modelled with the Kohlrausch–William–Watts (KWW) function. A Perrin-like reaction sphere model is proposed to rationalize the kinetic data. The activation energies were the same for all of the TPAs, within experimental error. The average rate constants were found to increase with the thermodynamic driving force, consistent with electron transfer in the Marcus normal region.
Introduction
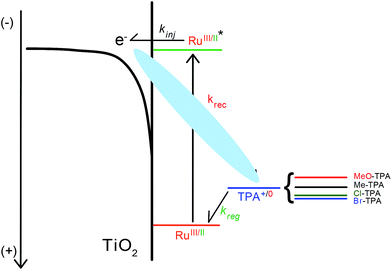
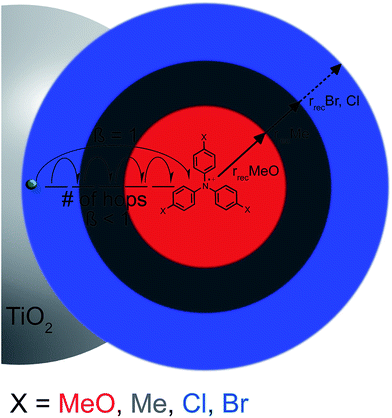
Motivation for the study of electron transfer reactions at semiconductor interfaces originates from both applications and the need to enhance fundamental knowledge.1–3 In dye-sensitized solar cells (DSSCs), mesoporous thin films of anatase TiO2 nanocrystallites are functionalized with molecular chromophores, or “sensitizers”, that extend the spectral response of these materials into the visible region. In the accepted mechanism for power generation with DSSCs, light absorption induces electron “injection” from the sensitizer's excited state to the metal oxide acceptor states.4 A donor present in the electrolyte solution then reduces the oxidized sensitizer, a process often termed “dye regeneration”.5 Competition between the collection of the injected electron and back electron transfer, or “charge recombination”, to the oxidized sensitizer or the oxidized donor often lowers the efficiency of DSSCs. This paper seeks to better understand the unwanted charge recombination reaction of the injected electrons with the oxidized donor through the use of four symmetrically substituted triphenylamines whose formal reduction potentials span a range of 0.5 eV (Scheme 1).When compared to the wealth of literature reports focused on electron transfer from TiO2 to the oxidized sensitizer, there are a remarkably small number of systematic studies that seek to understand the factors that influence charge recombination to oxidized donors present in the electrolyte.6–13 This is likely due to the dominance of I−/I3− as the prototypical redox mediator employed in DSSCs that is not easily amenable to systematic studies.14,15 However, alternative redox mediators, such as Co(III/II) polypyridyl complexes,16–23 triphenylamine or phenothiazine,24,25 have provided new opportunities to gain fundamental information on how sensitive charge recombination is to the electrolyte composition,6,26 molecular structure,12,27 or the thermodynamic driving force.7–9
The influence of the reaction driving force on recombination has been previously studied by several groups7,8,10,28 and data consistent with the Marcus normal kinetic region has been reported.29,30 Recall that in the Marcus normal region the total reorganization energy λ for electron transfer is greater than the absolute value of the Gibbs free energy change, λ > |ΔG°|. Under normal conditions, an increase in the driving force results in an increase in the rate of electron transfer. In a study of recombination to a series of substituted ferroceniums, Hupp et al. noted that normal region behavior was peculiar given the small reorganization energies and the large reaction driving forces8 that should have placed the reaction in the Marcus inverted region, λ > |ΔG°|. Hamann et al. have suggested that electron transfer from different electronic states in TiO2 may mask inverted behavior similar to the case for metallic donors.31 Further complicating the analysis is the considerable literature that indicates that the observed rate constants abstracted from transient spectroscopic and/or electrochemical data report mainly on the diffusion of the injected TiO2 electron and/or acceptor.32–38 It is possible that diffusion does rate limit interfacial electron transfer in some cases, however this does not explain the reported driving force dependencies or the recent observation of specific interfacial electron transfer pathways at sensitized TiO2 interfaces.39,40
Nevertheless, an experimental challenge is to abstract the actual interfacial electron transfer rate constant from the transient data that are usually highly non-exponential.32,33,41 A fitting function that has been phenomenally successful is the so-called Kohlrausch–Williams–Watts (KWW) function that was proposed empirically by Kohlrausch, and later popularized by Williams and Watts.42 This function was first derived by Scher and Montroll based on a random walk model and has since become a paradigm for charge transport in disordered media.43 In particular the work of Nelson and coworkers has extended the KWW model to the trapping/detrapping electron transport in dye sensitized mesoporous TiO2 thin films that are commonly used in DSSCs.32,37,44–46 It should be emphasized, however, that a quality fit to the KWW function does not necessarily indicate that an underlying transport mechanism is operative. For example, Anderson has derived the KWW function based on serially linked rate constants that are not necessarily associated with charge transport in disordered solids.47
In this study, a series of four symmetrically substituted triphenylamines (TPAs) were utilized to establish a correlation between the reaction kinetics and driving force, Fig. 1. The TPA molecules were substituted at the para-position of each phenyl ring with electron donating/withdrawing functional groups that allowed the TPA+/0 reduction potential to be varied by ∼0.5 V. A key finding was that the interfacial electron transfer became first-order when the reaction driving force was large. Such first-order behavior has not been previously reported and was maintained for the two different ruthenium sensitizers as well as the two different acetonitrile electrolytes. A Perrin-like model is proposed to rationalize this kinetic behavior. Additionally, an increase in driving force resulted in an increase in the rate of interfacial electron transfer, consistent with the reaction occurring in the Marcus normal region.
Results
Mesoporous nanocrystalline TiO2 thin films were sensitized to visible light with [Ru(bpy)2(dcb)]2+ (RuC) or [Ru(bpy)2(dpb)]2+ (RuP) (bpy = 2,2′-bipyridine, dcb = 4,4′-dicarboxylic acid-2,2′-bipyridine and dpb = 4,4′-diphosphonic acid-2,2′-bipyridine) by immersion into concentrated sensitizer CH3CN solutions. These films were soaked for a minimum of 24 hours to ensure that saturation surface coverages (∼10−8 mol cm−2) were obtained, as determined by a previously reported spectral method.48 The sensitized films, abbreviated TiO2|RuC and TiO2|RuP, immersed in neat acetonitrile displayed a broad absorption band in the visible region characteristic of a metal-to-ligand charge transfer (MLCT) feature. A bathochromic shift of the absorption spectrum was observed upon the addition of 0.1 M NaClO4 or LiClO4 to the acetonitrile that surrounded the thin film. Such spectral shifts have previously been assigned to a change in the local electric field upon cation adsorption to the TiO2 surface.6,49,50 The TPAs did not appreciably absorb visible light in their neutral forms, however the one electron oxidized forms exhibited strong absorption between 600–800 nm, Fig. 2b. The peak position and the molar absorption coefficient for these absorbances are reported in Table 1.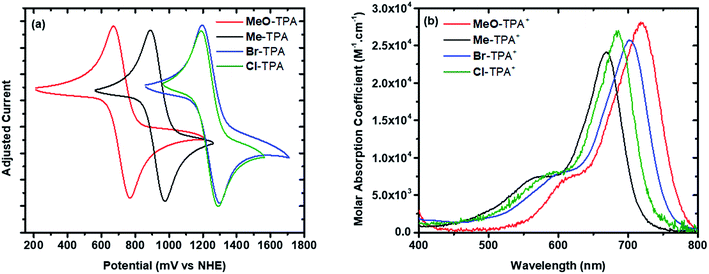 | ||
| Fig. 2 Cyclic voltammograms (a) and TPA+ absorption spectra (b) of the indicated TPA measured in 0.1 M NaClO4 acetonitrile electrolyte. | ||
| Oxidation potentiala (V vs. NHE) | TPA+ peak absorbance (nm) | TPA+ extinction coefficient (M−1 cm−1) | |
|---|---|---|---|
| a Measured in 0.1 M NaClO4 CH3CN electrolyte unless otherwise noted. b Ref. 51, measured in 0.1 M LiClO4 CH3CN electrolyte on nanoITO. c Ref 48, measured in 0.1 M LiClO4 CH3CN electrolyte on nanocrystaline TiO2. | |||
| MeO-TPA | 0.72 ± 0.01 | 717 ± 1 | 2.8 × 10⁴ ± 300 |
| Me-TPA | 0.93 ± 0.01 | 668 ± 1 | 2.4 × 10⁴ ± 300 |
| Cl-TPA | 1.24 ± 0.01 | 685 ± 1 | 2.7 × 10⁴ ± 300 |
| Br-TPA | 1.25 ± 0.01 | 702 ± 1 | 2.6 × 10⁴ ± 300 |
| RuP | 1.54b | ||
| RuC | 1.48c | ||
The TPA+/0 reduction potentials were determined by cyclic voltammetry in 0.1 M NaClO4 acetonitrile, Fig. 2a. The half-wave potentials were taken as an estimate for the formal reduction potentials that varied between 0.72 V (MeO-TPA) and 1.25 V vs. NHE (Br-TPA), Table 1.
Nanosecond transient absorption spectroscopy was used to quantify the recombination reaction. Experiments were performed in 0.1 M NaClO4 acetonitrile electrolyte for TiO2|RuC and in 0.1 M LiClO4 acetonitrile electrolyte for TiO2|RuP. The Lewis acidic Na+ or Li+ cations were present in the external electrolyte to improve the excited state injection yield.49,52,53 It is worth noting that no specific interaction between the cations and the TPA is expected based on previous literature6 but these cations have been shown to influence the rate for recombination from TiO2(e−) to Me-TPA+, with rate constants following the trend Na+ ≥ Li+ > Mg2+ > Ca2+.6 Such a trend was also observed for the recombination to I3−.26 In a typical experiment, pulsed 532 nm light excitation of the sensitized TiO2 thin films submerged in argon purged 0.1 M NaClO4 or 0.1 M LiClO4 acetonitrile electrolytes with 8 mM of a selected TPA derivative formed the initial charge separated state, TiO2(e−)|RuC+ or TiO2(e−)|RuP+. The subsequent absorption changes were monitored on a 10 ns or longer time scale. Absorption changes associated with the oxidized sensitizer were observed within the instrument response time consistent with rapid excited state injection (kinj > 108 s−1).2,4 Under all conditions studied, the transient spectra were simulated with a linear combination of standard spectra comprised of: (1) TiO2|RuC and the oxidized form of the sensitizer, abbreviated TiO2|RuC+; (2) TPA+; and/or (3) the Stark effect.49,54,55 The Stark effect results from local electric fields generated by cation adsorption and/or the injected electron which are themselves well simulated by a first derivative of the ground state sensitizer absorption. In principle, the injected electron also contributes to the transient spectra, however its weak absorption was obscured by the more intense absorption associated with TPA+.
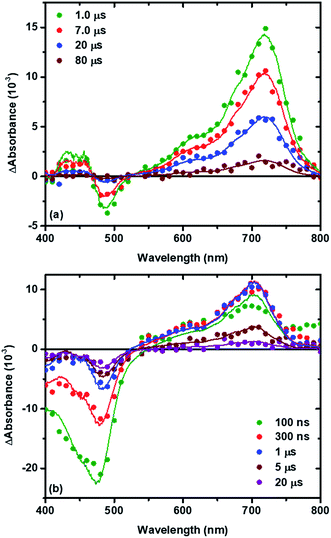
Fig. 3 shows representative absorption difference spectra measured after pulsed light excitation of TiO2|RuC immersed in 0.1 M NaClO4 acetonitrile solution with 8 mM MeO-TPA (Fig. 3a) or 8 mM Cl-TPA (Fig. 3b). Contributions to the spectra from the oxidized sensitizer were absent after 1 μs with MeO-TPA (or Me-TPA) and the relative amplitudes were consistent with quantitative regeneration of the oxidized sensitizer. This was true for either sensitizer in both electrolytes and enabled the desired reaction, TiO2(e−) + TPA+ → TiO2 + TPA, to be quantified on a microsecond or longer timescale without contributions from slow regeneration and the oxidized sensitizer. In contrast, regeneration by Cl-TPA (or Br-TPA) was not quantitative on any time scale and contributions from the oxidized sensitizer were evident on all delay times.
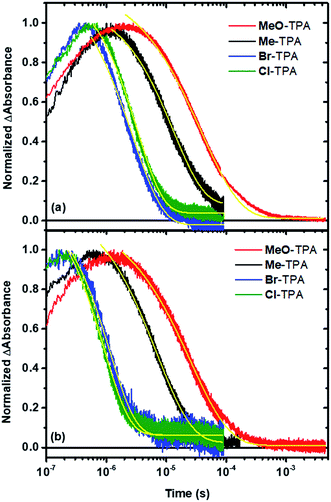
The time dependent concentration of TPA+ was biphasic, consisting of an initial rise followed by a decay, Fig. 4. For transient absorption data acquired with MeO-and Me-TPA, a sum of two Kohlrausch–William–Watts (KWW) functions adequately modelled the kinetic data, n = 2, as shown in eqn (1). The regeneration of the oxidized sensitizer was quantified independently from single wavelength absorption data monitored at 402 nm, which represented an isosbestic point for the Stark effect, that was fit to a single KWW function; the obtained values for β and k were used to constrain fits to the bi-KWW function used to model the TPA+ kinetics as β1 and k1. An “average” rate constant, kkww, was then calculated as the first moment of this distribution using eqn (2), where Γ is the Gamma function.
 | (1) |
 | (2) |
Fits of the recombination data for electron transfer from TiO2(e−) to Cl- or Br-TPA+ using a single KWW function revealed a β value of 1, while the corresponding data obtained for MeO-TPA and Me-TPA required β values ranging between 0.62 and 0.85. A β value of unity corresponds to the single exponential behavior expected for a first-order kinetic reaction. The kinetics were independent of the excitation irradiance and hence the initial concentrations, resulting in normalizable kinetics that allowed a single rate constant to model the desired reaction. A summary of the fitting parameters is given in Table 2. Note that the rate constants for recombination from TiO2(e−) to all TPA+ derivatives were larger in Na+ than in Li+ consistent with previous report.6
| k (105 s−1), bβ TiO2|RuC | k kww (105 s−1) bTiO2|RuC | k (105 s−1), cβ TiO2|RuP | k kww (105 s−1) cTiO2|RuP | |
|---|---|---|---|---|
| a Rate constants (krec) for electron transfer from TiO2(e−) to TPA+, where k represents the rate constant extracted from fits to eqn (1) and kkww represents the average rate constant calculated with eqn (2). Note that for Cl-TPA and Br-TPA, the recombination was first-order such that β = 1 and kcr and kkww are equivalent. b Measured in 0.1 M NaClO4 CH3CN electrolyte. c Measured in 0.1 M LiClO4 CH3CN electrolyte. | ||||
| MeO-TPA | 0.42 ± 0.05, 0.67 | 0.47 ± 0.04 | 0.27 ± 0.03, 0.62 | 0.19 ± 0.02 |
| Me-TPA | 1.5 ± 0.1, 0.74 | 1.7 ± 0.1 | 0.74 ± 0.07, 0.85 | 0.68 ± 0.02 |
| Cl-TPA | 12.0 ± 0.3, 1 | 12 ± 0.1 | 3.1 ± 0.1, 1 | 3.1 ± 0.1 |
| Br-TPA | 9.7 ± 0.1, 1 | 9.7 ± 0.1 | 3.3 ± 0.1, 1 | 3.3 ± 0.1 |
Kinetic data acquired as a function of temperature were modeled using the procedure described for the room temperature data, Fig. 5a. The Arrhenius plot of the first-order rate constant (Cl-TPA or Br-TPA) or the average rate constants (kkww) is shown in Fig. 5b, and revealed a common activation energy Ea = 0.13 ± 0.01 eV for all TPA+ acceptors. The Ea values obtained for the recombination to Br-TPA+ in 0.1 M MgClO4 and 0.1 M TBAClO4 CH3CN electrolytes were the same within experimental error (Fig. 5c). The recombination to Br-TPA+ in 0.1 M MgClO4 was slower than that in LiClO4 or NaClO4. Interestingly, even though the identity of the cation changed the rate of charge recombination, the activation energy remained the same.
Discussion
The intent of this study was to quantify the driving force dependence of the interfacial charge recombination reaction photogenerated electrons in dye-sensitized TiO2, TiO2(e−)s, with oxidized triphenylamines to yield ground state products, eqn (3).| TiO2(e−) + TPA+ → TiO2 + TPA | (3) |
If one assumes that the reducing power of the TiO2(e−) is insensitive to the TPA derivative used, the Gibbs free energy change was varied by over 500 meV. The reactants were produced by pulsed laser excitation of the sensitizers (RuC or RuP) that initiated rapid excited state injection, kinj > 108 s−1, into TiO2 followed by diffusional ‘regeneration’ through TPA oxidation in an acetonitrile electrolyte. The time required for regeneration of the oxidized sensitizer by TPA was about 1 microsecond and occurred quantitatively for the more easily oxidized TPA derivatives.
The data provide new insights into the origin(s) of the non-exponential kinetics that are often reported for interfacial charge recombination reactions in dye-sensitized TiO2 materials. Specifically, the observation of a first-order reaction indicates a strong coulombic attraction between TiO2(e−) and TPA+ that provides a pathway for charge recombination. Consistent with previous reports, the kinetic data indicates that eqn (3) occurs in the Marcus normal kinetic region, despite the large expected driving forces. Below we discuss in more detail a kinetic reaction sphere model for charge recombination followed by a description of the driving force dependence.
Kinetic model
The spectroscopic approach described provided equal numbers of injected electrons and oxidized TPA compounds. A rate law that is first-order in TPA+ and first-order in TiO2(e−) and hence second-order overall might be expected, eqn (4).| Rate = k[TPA+][TiO2(e−)] ∼ k[TPA+]nβ | (4) |
The order in TiO2(e−) has been quantified by many groups, through transient photovoltage spectroscopy, and is mysteriously often reported to be non-integral56,57 although under some conditions it is indeed unity.58 Since the molar concentrations asserted by the brackets in eqn (4) are ill-defined in the mesoporous TiO2 thin films, the total number of injected electrons, n, is often raised to the exponent β as an approximation to the [TiO2(e−)].2
A striking result from this study was that when charge recombination was highly exothermic, the kinetic data were most accurately modelled as a first-order kinetic model and displayed single exponential kinetics even when the initial concentration was varied by over a factor of five. Such data is inconsistent with the rate law implied by eqn (4). Instead, first-order recombination is expected for a unimolecular electron transfer like that observed in covalently linked Donor–Acceptor (D–A) compounds. Therefore, electron transfer is to the surface adsorbed TPA+ proximate to the injected electron, eqn (5).
| TiO2(e−)|TPA+ → TiO2|TPA | (5) |
Hence, diffusional regeneration of the oxidized dye yields TPA+ that adsorbs to the TiO2 surface prior to charge recombination. It is likely that the coulombic attraction between the injected electron and TPA+ stabilizes the proposed adduct. Indeed, the electric field produced by excited state injection has been estimated to be ∼2 MV cm−1 under one-sun illumination.49,50 The field is sufficiently large to electrostatically bind the cationic TPA+ and the injected electron is suitably close to afford the electronic coupling necessary for electron transfer.
In order to rationalize why the reaction becomes non-exponential at smaller driving forces, a “reaction sphere” model is proposed that shares some similarities with those of Perrin and Onsager (Scheme 2).59,60 In this model, it is assumed that the injected electrons reside in localized trap states as Ti(III) species that can either hop to a Ti(IV) site or reduce surface adsorbed TPA+. Such Ti(IV/III) hopping is conceptually equivalent to previously reported trapping/detrapping mechanisms46,61 and is expected to be independent of the TPA+ derivative. A key aspect of this model is that the TiO2(e−) reacts with any TPA+ within a sphere whose radius r increases with driving force. Recombination within the reaction sphere gives rise to first-order kinetics; recombination to TPA+ outside the sphere requires Ti(IV/III) hopping, manifested as dispersive kinetics and β < 1 in the KWW function, until the rate constant for electron transfer to TPA+ is sufficiently large to compete with transfer to another Ti(IV) site.
As first derived by Scher and Montroll,43 electron transport in disordered media naturally gives rise to dispersive kinetics that follow the Kohlrausch–Williams–Watts model, eqn (6).
A(t) = A0![[thin space (1/6-em)]](https://www.rsc.org/images/entities/char_2009.gif) exp(−kt)β exp(−kt)β | (6) |
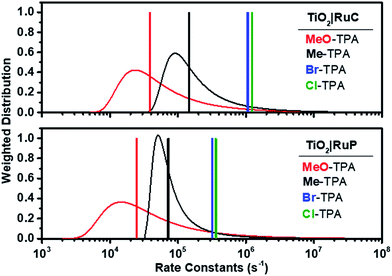 | ||
| Fig. 6 Calculated Lévy distribution of the charge recombination rate constants abstracted from transient data for electron transfer from TiO2(e−)|RuC (top) and TiO2(e−)|RuP (bottom) to MeO-TPA+ (red) or to Me-TPA+ (black). An average rate constant based on eqn (2) is shown as a vertical line. Also shown as vertical lines are the first-order rate constants for recombination to Br-TPA+ (blue) and Cl-TPA+ (green). | ||
It is interesting to note that the Ea value of 0.13 ± 0.01 eV was independent of the identity of the TPA+ acceptor. A similar activation energy of 0.13 eV was reported for electron transport within mesoporous TiO2 (ref. 45) as well as for Li+ hops in a Li10SnP2S12-based composite.62 Cation hopping was excluded since the same activation energy was measured in 0.1 M MgClO4 and 0.1 M TBAClO4 electrolytes for recombination to Br-TPA+ (Fig. 5c). Since the observed rate constant is the true rate constant for recombination to Cl- and Br-TPA+, the activation energy must reflect the barrier for the interfacial electron transfer reaction. For the other TPA+ derivatives, the same Ea value should be taken as the average of a distribution of activation energies as it was extracted from rate constants based on Lévy distributions. The fact that these average activation energies are the same within experimental error indicates that the barrier for Ti(IV/III) hopping must be very similar to that for electron transfer to the oxidized TPA+, a conclusion that is in agreement with a recent publication.45
Marcus normal electron transfer
Regardless of how the time resolved data is analyzed, the data clearly show that the recombination rate becomes larger as the Eo(TPA+/0) potential increases, consistent with Marcus normal kinetic behavior. There was no evidence for activationless or Marcus inverted kinetic behaviors even when the mediator potentials were tuned to the most positive values. Indeed, the electron transfer was clearly activated, Ea = 0.13 ± 0.01 eV. Normal kinetic behavior has also been reported for Co(III) complexes and for ferrocenium acceptors.7,8,28 While a precise value of the formal EoTi(IV/III) reduction potential is unknown, the onset for spectroscopic changes attributed to TiO2(e−) is around 0 V vs. NHE in 0.1 M LiClO4.6,49 Hence, the spectroelectrochemical studies suggest that the driving force for recombination to X-TPA+ acceptors, where X = Cl or Br, is greater than 1.2 eV. We emphasize however that the true free energy change for charge recombination is unknown and may be complicated by the time dependent electric field26,63 or the exponential density of donor states that are often invoked to model such data.49,64 Nevertheless, the data is fully consistent with Marcus normal electron transfer and suggests that either the reorganization energy must exceed this value or, as has been previously described, that recombination occurs through lower energy “trap” states with a significantly smaller driving force.10,31The total reorganization energy for this interfacial recombination reaction includes contributions from TiO2, the triphenylamine acceptors, and the electrolyte solution. Theoretical calculations indicate that λtot = 0.15–0.25 eV for TPA+/0 which is consistent with the rapid self-exchange in this class of compound.65 The reorganization energy change associated with Ti(IV/III) hopping is unknown. In molecular compounds, the d0/d1 redox chemistry is subject to a large Jahn–Teller distortion and reported reorganization energies are quite large.66–68 While molecular Ti compounds and TiO2 are quite different, the spectroscopic properties of Ti(III) in the solid state often show clear evidence of Jahn–Teller distortions.69,70 Hence, a significant inner sphere contribution to the reorganization energy is expected.66–68 The dielectric continuum theory provides outer-sphere reorganization of ∼1 eV in acetonitrile.71,72 Recently, reorganization energies near 1.2 eV for electron hopping have been calculated using the DFT + U method.73 Hence it is not unreasonable to suggest that the total reorganization energy is greater than 1.2 eV. Alternatively, and as has previously been discussed,28,31 a lower driving force for the reaction would be expected if the energetic position of the TiO2 donor states that participate in charge recombination is at much more positive potentials than the spectroelectrochemical data indicates. This would allow for the observation of normal behavior when the total reorganization energy is less than 1.2 eV.
In the present study, the first-order recombination observed for the halogenated TPAs rules out diffusion or transport of the injected electrons as being a rate limiting process. Furthermore, recent studies have shown that charge recombination to oxidized dyes is sensitive to the bridge that separates them from the surface or the orientation of the surface linker.39,40 Indeed, specific bridge mediated pathways to oxidized dyes have been identified.37 Taken together, these findings indicate that the observed rate constants do, at least partially, report upon the interfacial electron transfer rate constant(s). Even when |ΔG°| was as large as that reported here there was no evidence for first-order kinetics or rate constants that were highly sensitive to the sensitizer Eo(S+/0) reduction potentials. This very different behavior for electron transfer to oxidized sensitizers versus redox mediators is not fully understood. A working hypothesis is that the anionic phosphonate (or carboxylate) binding groups preclude close-encounters of the injected electrons with the oxidized sensitizers resulting in more dispersive kinetics with longer distance interfacial electron transfer.
Conclusion
Electron transfer from TiO2 to a series of symmetrically substituted oxidized triphenylamines was quantified over a driving force range of 0.5 eV. The rates increased with the thermodynamic driving force, consistent with the reaction occurring in the Marcus normal region. This conclusion was robust and occurred for two different CH3CN electrolytes (LiClO4 and NaClO4) and when sensitized to visible light by two different sensitizers (RuC and RuP). An unprecedented first-order electron transfer from TiO2 to Cl-or Br-TPA+ indicated a coulombic interaction that provided sufficient coupling for unimolecular-like recombination. A reaction sphere model was proposed to account for this behavior and the dispersive kinetics observed for the other TPA+ acceptors wherein the recombination radius is related to the Gibbs free energy change.Experimental
Materials
The following reagents and solvents were purchased from the listed commercial sources and used without further purification: acetonitrile (Burdick and Jackson, spectrophotometric grade), methanol (Fischer, ACS Reagent grade), sodium perchlorate (NaClO4, Sigma-Aldrich, 99%), argon gas (Airgas, >99.998%), [Ru(bpy)2(dcb)]2+(PF6)2 (Solaronix), tri-p-tolyl-amine (Me-TPA, Sigma-Aldrich, 97%), and tris(4-bromophenyl)amine (Br-TPA, Sigma-Aldrich, 98%). [Ru(bpy)2(dpb)]2+(PF6)2,77 tri-p-anisylamine (MeO-TPA)74 and tris (4-chlorophenyl)amine (Cl-TPA)75 were prepared according to previously reported methods.Materials preparation
Anatase TiO2 nanocrystallites were prepared through a previously described sol–gel method.76 The sols were cast as thin films by doctor blading onto methanol cleaned glass substrates. Scotch tape (∼10 μm) was used as a spacer and aided in achieving a uniform film thickness. The films were allowed to stand covered for 30 min before being transferred to a tube furnace. The furnace was first purged with pure O2, then heated at 450 °C for 30 min. After annealing, the films were either kept in a 70 °C oven for later use, or immediately submerged in concentrated acetonitrile solution of RuC or RuP.Electrochemistry
All electrochemical experiments were performed in acetonitrile solution containing 0.1 M NaClO4 as the supporting electrolyte. Potentials were applied against a self-contained Ag wire pseudo reference electrode containing the same electrolyte solution. The reference electrode was calibrated externally against the Fc+/0 reduction potential (0.31 V vs. SCE) where SCE is 0.241 V positive of NHE.78 Cyclic voltammetry employed Pt disk electrodes (BASi, 1.6 mm diameter) as both working and auxiliary electrodes. Spectroelectrochemical studies were performed using a gold Honeycomb Spectroelectrochemical Cell (Pine Research Instrumentation), and allowed absorption changes to be quantified after application of an electrochemical bias.Absorption spectra
Ground state absorption spectra were obtained from a Varian Cary 50 spectrophotometer. Serial dilution of stock solution was used to determine the extinction coefficient of each compound. Molar absorption coefficient for the one electron oxidized TPAs were determined by internal comparison to the ground state TPA spectra.Transient absorption
Nanosecond transient absorption measurements were performed on a previously described apparatus.79 A pulsed (1 Hz) 150 W xenon arc lamp (Applied Photophysics) was used as the probe beam. Appropriate filters were placed before the sample to prevent direct band gap excitation of TiO2. After passing through the sample, the probe beam was focused into a Spex monochromator coupled to a R928 Hamamatsu photomultiplier tube. A pulsed (1 Hz) Nd:YAG laser (Quantel USA Brilliant B; 5–6 ns full width at half-maximum, spot size ∼0.8 cm2) provided sample excitation. Excitation power was measured at the sample using a thermopile power meter (Molectron), with typical excitation powers varying between 500 μJ and 5 mJ per pulse. Typically, 30 pump-probe measurements were averaged over the range of 400–800 nm. Data generated for kinetic modeling were typically averaged between 150–210 measurements in order to improve signal to noise. Full spectra were generated at a set time after laser excitation by averaging 3–21 data points around the timepoint of interest.Data modeling
Kinetic modeling was performed with OriginPro 9, which utilizes a Levenberg–Marquardt iteration method. A custom Mathematica 9 script was used to model the spectral signatures observed in transient absorption. Fitting was achieved through standard addition of steady state absorption spectra.Conflicts of interest
There are no conflicts to declare.Acknowledgements
The authors acknowledge support by a grant from the Division of Chemical Sciences, Office of Basic Energy Sciences, Office of Energy Research, U.S. Department of Energy (Grant DE-SC0013461). L. T.-G. would like to acknowledge the Belgian American Educational Foundation (BAEF) as well as the Bourse d’Excellence Wallonie-Bruxelles (WBI World) for generous support.References
- N. S. Lewis, J. Phys. Chem. B, 1998, 102, 4843–4855 CrossRef CAS.
- S. Ardo and G. J. Meyer, Chem. Soc. Rev., 2009, 38, 115–164 RSC.
- T. Hisatomi, J. Kubota and K. Domen, Chem. Soc. Rev., 2014, 43, 7520–7535 RSC.
- D. F. Zigler, Z. A. Morseth, L. Wang, D. L. Ashford, M. K. Brennaman, E. M. Grumstrup, E. C. Brigham, M. K. Gish, R. J. Dillon, L. Alibabaei, G. J. Meyer, T. J. Meyer and J. M. Papanikolas, J. Am. Chem. Soc., 2016, 138, 4426–4438 CrossRef CAS PubMed.
- A. Listorti, B. O’Regan and J. R. Durrant, Chem. Mater., 2011, 23, 3381–3399 CrossRef CAS.
- B. N. DiMarco, R. M. O’Donnell and G. J. Meyer, J. Phys. Chem. C, 2015, 119, 21599–21604 CAS.
- T. W. Hamann, O. K. Farha and J. T. Hupp, J. Phys. Chem. C, 2008, 112, 19756–19764 CAS.
- M. J. DeVries, M. J. Pellin and J. T. Hupp, Langmuir, 2010, 26, 9082–9087 CrossRef CAS PubMed.
- S. M. Feldt, G. Wang, G. Boschloo and A. Hagfeldt, J. Phys. Chem. C, 2011, 115, 21500–21507 CAS.
- S. M. Feldt, P. W. Lohse, F. Kessler, M. K. Nazeeruddin, M. Grätzel, G. Boschloo and A. Hagfeldt, Phys. Chem. Chem. Phys., 2013, 15, 7087 RSC.
- B. M. Klahr and T. W. Hamann, J. Phys. Chem. C, 2009, 113, 14040–14045 CAS.
- Y. Xie, J. Baillargeon and T. W. Hamann, J. Phys. Chem. C, 2015, 119, 28155–28166 CAS.
- Y. Xie and T. W. Hamann, J. Phys. Chem. Lett., 2013, 4, 328–332 CrossRef CAS PubMed.
- J. G. Rowley, S. Ardo, Y. Sun, F. N. Castellano and G. J. Meyer, J. Phys. Chem. C, 2011, 115, 20316–20325 CAS.
- J. G. Rowley, B. H. Farnum, S. Ardo and G. J. Meyer, J. Phys. Chem. Lett., 2010, 1, 3132–3140 CrossRef CAS.
- J.-H. Yum, E. Baranoff, F. Kessler, T. Moehl, S. Ahmad, T. Bessho, A. Marchioro, E. Ghadiri, J.-E. Moser, C. Yi, M. K. Nazeeruddin and M. Grätzel, Nat. Commun., 2012, 3, 631 CrossRef PubMed.
- T. W. Hamann, Dalton Trans., 2012, 41, 3111 RSC.
- E. Mosconi, J.-H. Yum, F. Kessler, C. J. Gómez García, C. Zuccaccia, A. Cinti, M. K. Nazeeruddin, M. Grätzel and F. De Angelis, J. Am. Chem. Soc., 2012, 134, 19438–19453 CrossRef CAS PubMed.
- S. M. Feldt, E. a. Gibson, E. Gabrielsson, L. Sun, G. Boschloo and A. Hagfeldt, J. Am. Chem. Soc., 2010, 132, 16714–16724 CrossRef CAS PubMed.
- T. Daeneke, A. J. Mozer, T.-H. Kwon, N. W. Duffy, A. B. Holmes, U. Bach and L. Spiccia, Energy Environ. Sci., 2012, 5, 7090 CAS.
- T. Daeneke, T.-H. Kwon, A. B. Holmes, N. W. Duffy, U. Bach and L. Spiccia, Nat. Chem., 2011, 3, 211–215 CrossRef CAS PubMed.
- Y. Saygili, M. Söderberg, N. Pellet, F. Giordano, Y. Cao, A. B. Muñoz-García, S. M. Zakeeruddin, N. Vlachopoulos, M. Pavone, G. Boschloo, L. Kavan, J.-E. Moser, M. Grätzel, A. Hagfeldt and M. Freitag, J. Am. Chem. Soc., 2016, 138, 15087–15096 CrossRef CAS PubMed.
- M. Freitag, F. Giordano, W. Yang, M. Pazoki, Y. Hao, B. Zietz, M. Grätzel, A. Hagfeldt and G. Boschloo, J. Phys. Chem. C, 2016, 120, 9595–9603 CAS.
- Y. Hao, W. Yang, L. Zhang, R. Jiang, E. Mijangos, Y. Saygili, L. Hammarström, A. Hagfeldt and G. Boschloo, Nat. Commun., 2016, 7, 13934 CrossRef CAS PubMed.
- S. Cazzanti, S. Caramori, R. Argazzi, C. M. Elliott and C. A. Bignozzi, J. Am. Chem. Soc., 2006, 128, 9996–9997 CrossRef CAS PubMed.
- R. N. Sampaio, R. M. O’Donnell, T. J. Barr and G. J. Meyer, J. Phys. Chem. Lett., 2014, 5, 3265–3268 CrossRef CAS PubMed.
- S. A. Sapp, C. M. Elliott, C. Contado, S. Caramori and C. A. Bignozzi, J. Am. Chem. Soc., 2002, 124, 11215–11222 CrossRef CAS PubMed.
- S. M. Feldt, P. W. Lohse, F. Kessler, M. K. Nazeeruddin, M. Gratzel, G. Boschloo and A. Hagfeldt, Phys. Chem. Chem. Phys., 2013, 15, 7087–7097 RSC.
- N. Sutin, Acc. Chem. Res., 1982, 15, 275–282 CrossRef CAS.
- P. F. Barbara, T. J. Meyer and M. a. Ratner, J. Phys. Chem., 1996, 100, 13148–13168 CrossRef CAS.
- J. W. Ondersma and T. W. Hamann, J. Am. Chem. Soc., 2011, 133, 8264–8271 CrossRef CAS PubMed.
- M. Ansari-Rad, J. A. Anta and J. Bisquert, J. Phys. Chem. C, 2013, 117, 16275–16289 CAS.
- M. Ansari-Rad, Y. Abdi and E. Arzi, J. Phys. Chem. C, 2012, 116, 3212–3218 CAS.
- J. Bisquert, A. Zaban and P. Salvador, J. Phys. Chem. B, 2002, 106, 8774–8782 CrossRef CAS.
- S. A. Haque, Y. Tachibana, D. R. Klug and J. R. Durrant, J. Phys. Chem. B, 1998, 102, 1745–1749 CrossRef CAS.
- A. V. Barzykin and M. Tachiya, J. Phys. Chem. B, 2002, 106, 4356–4363 CrossRef CAS.
- R. Katoh, A. Furube, A. V. Barzykin, H. Arakawa and M. Tachiya, Coord. Chem. Rev., 2004, 248, 1195–1213 CrossRef CAS.
- R. Katoh and A. Furube, J. Phys. Chem. Lett., 2011, 2, 1888–1891 CrossRef CAS.
- K. Hu, A. D. Blair, E. J. Piechota, P. A. Schauer, R. N. Sampaio, F. G. L. Parlane, G. J. Meyer and C. P. Berlinguette, Nat. Chem., 2016, 8, 853–859 CrossRef CAS PubMed.
- K. E. Spettel and N. H. Damrauer, J. Phys. Chem. C, 2016, 120, 10815–10829 CAS.
- A. N. M. Green, E. Palomares, S. A. Haque, J. M. Kroon and J. R. Durrant, J. Phys. Chem. B, 2005, 109, 12525–12533 CrossRef CAS PubMed.
- G. Williams and D. C. Watts, Trans. Faraday Soc., 1970, 66, 80 RSC.
- H. Scher and E. W. Montroll, Phys. Rev. B, 1975, 12, 2455–2477 CrossRef CAS.
- J. Bisquert, F. Fabregat-Santiago, I. Mora-Seró, G. Garcia-Belmonte and S. Giménez, J. Phys. Chem. C, 2009, 113, 17278–17290 CAS.
- G. Boschloo and A. Hagfeldt, J. Phys. Chem. B, 2005, 109, 12093–12098 CrossRef CAS PubMed.
- J. Nelson, S. A. Haque, D. R. Klug and J. R. Durrant, Phys. Rev. B, 2001, 63, 205321 CrossRef.
- R. G. Palmer, D. L. Stein, E. Abrahams and P. W. Anderson, Phys. Rev. Lett., 1984, 53, 958–961 CrossRef.
- B. N. DiMarco, T. C. Motley, R. S. Balok, G. Li, M. A. Siegler, R. M. O’Donnell, K. Hu and G. J. Meyer, J. Phys. Chem. C, 2016, 120, 14226–14235 CAS.
- R. M. O’Donnell, R. N. Sampaio, T. J. Barr and G. J. Meyer, J. Phys. Chem. C, 2014, 118, 16976–16986 Search PubMed.
- C. L. Ward, R. M. O’Donnell, B. N. DiMarco and G. J. Meyer, J. Phys. Chem. C, 2015, 119, 25273–25281 CAS.
- B. H. Farnum, Z. A. Morseth, M. K. Brennaman, J. M. Papanikolas and T. J. Meyer, J. Am. Chem. Soc., 2014, 136, 15869–15872 CrossRef CAS PubMed.
- C. A. Kelly, F. Farzad, D. W. Thompson, J. M. Stipkala and G. J. Meyer, Langmuir, 1999, 15, 7047–7054 CrossRef CAS.
- D. F. Watson and G. J. Meyer, Coord. Chem. Rev., 2004, 248, 1391–1406 CrossRef CAS.
- S. Ardo, Y. Sun, A. Staniszewski, F. N. Castellano and G. J. Meyer, J. Am. Chem. Soc., 2010, 132, 6696–6709 CrossRef CAS PubMed.
- U. B. Cappel, S. M. Feldt, J. Schöneboom, A. Hagfeldt and G. Boschloo, J. Am. Chem. Soc., 2010, 132, 9096–9101 CrossRef CAS PubMed.
- E. C. Brigham and G. J. Meyer, J. Phys. Chem. C, 2014, 118, 7886–7893 CAS.
- P. R. F. Barnes, K. Miettunen, X. Li, A. Y. Anderson, T. Bessho, M. Gratzel and B. C. O’Regan, Adv. Mater., 2013, 25, 1881–1922 CrossRef CAS PubMed.
- T. J. Barr and G. J. Meyer, ACS Energy Lett., 2017, 2, 2335–2340 CrossRef CAS.
- F. Perrin, Ann. Phys., 1929, 10, 169–275 Search PubMed.
- L. Onsager, J. Am. Chem. Soc., 1936, 58, 1486–1493 CrossRef CAS.
- J. Nelson, Phys. Rev. B, 1999, 59, 15374–15380 CrossRef CAS.
- M. Kaus, H. Stöffler, M. Yavuz, T. Zinkevich, M. Knapp, H. Ehrenberg and S. Indris, J. Phys. Chem. C, 2017, 121, 23370–23376 CAS.
- R. M. O’Donnell, S. Ardo and G. J. Meyer, J. Phys. Chem. Lett., 2013, 4, 2817–2821 CrossRef.
- B. C. O’Regan and J. R. Durrant, Acc. Chem. Res., 2009, 42, 1799–1808 CrossRef PubMed.
- P. Cias, C. Slugovc and G. Gescheidt, J. Phys. Chem. A, 2011, 115, 14519–14525 CrossRef CAS PubMed.
- E. A. Robinson and J. E. Earley, Inorg. Chem., 1999, 38, 4128–4131 CrossRef CAS.
- O. Olubuyide, K. Lu, A. O. Oyetunji and J. E. Earley, Inorg. Chem., 1986, 25, 4798–4799 CrossRef CAS.
- C. Creutz and M. H. Chou, Inorg. Chem., 2008, 47, 3509–3514 CrossRef CAS PubMed.
- W. R. Entley, C. R. Treadway, S. R. Wilson and G. S. Girolami, J. Am. Chem. Soc., 1997, 119, 6251–6258 CrossRef CAS.
- R. Ameis, D. Reinen and S. Kremer, Inorg. Chem., 1985, 24, 2751–2754 CrossRef CAS.
- E. H. Yonemoto, G. B. Saupe, R. H. Schmehl, S. M. Hubig, R. L. Riley, B. L. Iverson and T. E. Mallouk, J. Am. Chem. Soc., 1994, 116, 4786–4795 CrossRef CAS.
- Y.-P. Liu and M. D. Newton, J. Phys. Chem., 1994, 98, 7162–7169 CrossRef CAS.
- N. A. Deskins and M. Dupuis, Phys. Rev. B, 2007, 75, 195212 CrossRef.
- C. Quinton, V. Alain-Rizzo, C. Dumas-Verdes, F. Miomandre, G. Clavier and P. Audebert, RSC Adv., 2014, 4, 34332 RSC.
- A. P. Davis and A. J. Fry, J. Electrochem. Soc., 2013, 160, G3091–G3096 CrossRef CAS.
- T. A. Heimer, S. T. D’Arcangelis, F. Farzad, J. M. Stipkala and G. J. Meyer, Inorg. Chem., 1996, 35, 5319–5324 CrossRef CAS.
- M. R. Norris, J. J. Concepcion, C. R. K. Glasson, Z. Fang, A. M. Lapides, D. L. Ashford, J. L. Templeton and T. J. Meyer, Inorg. Chem., 2013, 52, 12492–12501 CrossRef CAS PubMed.
- A. J. Bard and L. R. Faulkner, Electrochemical Methods: Fundementals and Applications, Wiley, New York, 2nd edn, 2001 Search PubMed.
- R. Argazzi, C. A. Bignozzi, T. A. Heimer, F. N. Castellano and G. J. Meyer, Inorg. Chem., 1994, 33, 5741–5749 CrossRef CAS.
| This journal is © The Royal Society of Chemistry 2018 |

