“Are chemistry educational apps useful?” – a quantitative study with three in-house apps
Grace Lee Yuan
Ping
,
Chang
Lok
,
Tan
Wei Yeat
,
Tan Jie Ying
Cherynn
and
Emelyn Sue Qing
Tan
 *
*
Department of Chemistry, National University of Singapore, 3 Science Drive 3, Singapore 117543, Singapore. E-mail: emelyntan@nus.edu.sg; Tel: +65 6516 2674
First published on 14th September 2017
Abstract
Three internally developed mobile apps, “3D Sym Op”, “SM2 Chem” and “ARMolVis”, available for free on both the Apple App Store and Google Play Store were evaluated in seven studies. Each study was a systematic process of Pre-Test, In-lecture App Demo, App Assisted Interactive Tutorials (AAITs) and/or Independent App Usage (IAU), followed by a Survey and Post-Test. Overall, the mobile apps were effective evident by the higher Post-Test vs. Pre-Test % increase for those who used the app more frequently compared to those who used the app rarely. Apps were most effective when used in AAITs with the Blended Learning approach. This approach requires the physical presence of both teacher and student, but with some element of student free play such as using the app to complete worksheets in pairs or groups.
Introduction
From the turn of the 21st century, the fourth industrial revolution focusing on cyber physical systems has undoubtedly encrouched on higher education practices. Blended Learning combines traditional face-to-face learning systems with computer-based distributed learning systems (Graham, 2006). It involves giving students some element of control and flexibility over time, place, path and/or pace (Center for Education Reform, 2011). Models of Blended Learning include rotation, flex, self-blending and enriched-virtual (Staker and Horn, 2012). Higher education typically adopts the rotation model in which classes who spend the majority of their time in the same physical space are given opportunities for technology-based activities. Methodologies ranging from online lectures and tutorials, to videos, the use of real-time response systems, collaborative and social tasks, forums, the use of apps, social media, virtual and augmented reality, virtual labs, electronic assessment and marking, 3D drawing and animations, 3D printing and so on, are common in university courses, and thus begets their evaluation.Connectivism has been proposed as a learning theory from the prism of Blended Learning (Vranes et al., 2015). Connectivism, a learning theory for a digital age, has these principles among others, where learning occurs by connecting specialised nodes or information sources; nurturing and maintaining connections is needed to facilitate continual learning and the ability to see connections between fields, ideas, and concepts is a core skill (Siemens, 2005). Knowledge emerges from an individual's learning network when the individual is able to perceive connections between different perspectives and concepts (Dunaway, 2011). In course design, educators should scaffold learning by providing an extensive array of resources, on top of the standard three which are lecture notes and recommended textbooks, tutorial questions and solutions, and hands-on experiments that are used in lectures, tutorials and labs, respectively. The challenge for the technology enhanced platforms is how to inextricably integrate them to fill the voids, and allow the learner to create connections and yet not duplicate what these three sets of resources already offer.
Dual Coding Theory (Paivio, 1969) postulates that nonverbal (animation using images seen by eyes) and verbal (narration using spoken words heard by ears) stimuli are processed differently and along distinct channels in the human mind, creating separate models, pictorial and verbal, and subsequently integrating both with prior knowledge if any. With the ability to code a stimulus in two different ways, the chances of retrieving and recalling it is faster and higher, compared to if the stimulus was only coded one way (Paivio, 1969). Drawing on this cognitive theory, learning using multimedia presentations has proven to aid recall, understanding and application of information especially concepts, facts, or principles that are highly imaginable (Ardac and Akaygun, 2004; Jones, 2013), improve problem solving skills (Kelly and Jones, 2008) and promote learner understanding (Mayer and Moreno, 2002). Technology enhanced platforms available presently are not only able to provide better nonverbal and verbal media resulting in more comprehensive models, but are also able to venture into the other sensory memories of touch, smell and in not too long taste, activating all five senses in immersive learning experiences.
In particular, the study of Chemistry involves thought at multiple levels – macro, symbolic and sub-micro, commonly depicted as Johnstone's Triangle (Johnstone, 1982). Macro refers to observable changes in matter such as colour changes, bubbles or smell, typically occurring in the laboratory. Sub-micro is at the molecular level where there are dynamic changes in structures or processes imperceptible to the human eye. These two levels are linked by the symbolic level and are exemplified qualitatively and/or quantitatively. Qualitatively refers to the use of symbols, notations or diagrams while quantitatively refers to the use of mathematical equations or graphs. One major advantage that technology enhanced platforms bring to Chemistry education is the ability to provide better molecular level representation of reactions and processes; and to allow learners to move seamlessly between these three thinking levels.
Blended Learning (Graham, 2006; Center for Education Reform, 2011; Staker and Horn, 2012) with technology enhanced platforms and activities are beneficial when firstly, they connect inextricably with and compliment the standard resources; secondly, they provide better options for nonverbal and verbal stimuli that tap into more senses; and thirdly, specifically for Chemistry, they are able to help learners move seamlessly between the macro, symbolic and sub-micro thinking levels.
In this paper, three internally developed mobile apps are evaluated in seven studies (Table 1), each with a systematic combination of Pre-Test, In-lecture App Demo, App Assisted Interactive Tutorials (AAITs) and/or Independent App Usage (IAU), followed by a Survey and Post-Test. The hypothesis is that if the mobile apps are indeed effective, the Post-Test vs. Pre-Test % increase for those who used the app more frequently (Very Frequently, Frequently and Occasionally) should be higher compared to those who use the app rarely (Rarely, Very Rarely and Do not use/Do not have). In the case that the hypothesis is true, the limitation to the hypothesis is those who use the app more frequently have a higher % increase because these students are more engaged, self-driven higher performers, as determined by their summative assessment results. The limitation was addressed using the largest set of data, for the “SM2 Chem” app (Table 1), which showed that the summative assessment result mean of those who used the app more frequently compared to those who used it rarely, were similar (p-value of 0.19), indicating that the more frequent app users were not made up by higher performers.
| Mobile app | Academic year | N | Year of study | Pre-Test | In-lecture app demo | Email blast with app details | App Assisted Interactive Tutorials (AAITs) | Independent App Usage (IAU) | Survey | Post-Test | ||
|---|---|---|---|---|---|---|---|---|---|---|---|---|
| 1 | “3D Sym Op” | Sem 2 AY15/16 | 29 | 76 | Year 2 UG | ✓ | ✓ | ✓ | ✓ (2 AAITs) | ✓ | ✓ | ✓ |
| 2 | “3D Sym Op” | Sem 1 AY16/17 | 28 | ✓ | ✓ | ✓ | ✓ (2 AAITs) | ✓ | ✓ | ✓ | ||
| 3 | “3D Sym Op” | Sem 2 AY16/17 | 19 | ✓ | ✓ | ✓ (2 AAITs) | ✓ | ✓ | ✓ | |||
| 4 | “SM2 Chem” | Sem 2 AY14/15 | 88 | 269 | Pre-U | ✓ | ✓ | ✓ | ✓ | ✓ | ✓ | |
| 5 | “SM2 Chem” | Sem 2 AY15/16 | 89 | ✓ | ✓ | ✓ | ✓ | ✓ | ✓ | |||
| 6 | “SM2 Chem” | Sem 2 AY16/17 | 92 | ✓ | ✓ | ✓ | ✓ | ✓ | ✓ | |||
| 7 | “ARMolVis” | 2016 | 137 | Pre-U | ✓ | ✓ (1 AAIT) | ✓ | |||||
In our literature review, there are several journal papers and online articles with descriptions of Chemistry related apps and their advantages to solve a particular problem (Libman and Huang, 2013). However, the uniqueness of this work is the systematic app evaluations using Pre-Tests and Post-Tests, to conclusively show that apps are useful, rather than taking it as an assumption. Additionally, the seven app evaluation studies use three internally developed, customised module-specific mobile apps, which cannot be said of other studies which report on third party apps.
Methods
The three internally developed mobile apps (Tan and Soo, 2017) are available for free on both the Apple App Store and Google Play Store. Download counts are healthy and above the number of students enrolled in the module for which the app was developed for (Table 2).| Mobile app | Earliest publish date on Apple App and Google Play Stores | Total downloads (at 21 April 2017) | Downloads per year |
|---|---|---|---|
| “3D Sym Op” | 18 December 2015 | 14![[thin space (1/6-em)]](https://www.rsc.org/images/entities/char_2009.gif) 476 476 |
10![[thin space (1/6-em)]](https://www.rsc.org/images/entities/char_2009.gif) 783 783 |
| “SM2 Chem” | 12 December 2013 | 2465 | 734 |
| “ARMolVis” | 20 March 2016 | 1387 | 1275 |
“3D Sym Op” – symmetry elements and operations
“3D Sym Op” (3D Sym Op, 2016) is an educational app designed to visualise the symmetry elements and operations on molecules of various point groups. The 3D molecule is searchable via four ways: name, formula; 2D structure; point group and image recognition. Symmetry elements – rotation axis (C); reflection plane (σ); inversion point (i) and improper rotation (S) can be selectively displayed on the scalable 3D molecule. On touch a symmetry operation, e.g. C6 – 60° rotation, is performed and the user can pause/resume movement at any time. The corresponding 2D image with the symmetry element can also be shown. Tapping the point group would display the Character Table. A quiz mode is available for which each time has 7 symmetry element questions followed by 3 point group questions, for self-assessment.Visualisation of symmetry operations, movement according to symmetry, within a molecule and in one's mind, is a challenge for certain students (Raiyn and Rayan, 2015). Hence, this app was developed that has movable, scalable 3D models together with symmetry operations that are performed on touch. Once the symmetry elements are identified, the point group is determined via a flow chart, and for each point group, a Character Table is available within the app. Details in the Character Table are required in Molecular Orbital Theory and interpretation of Infrared and Raman Spectra, which are taught in undergraduate modules such as CM2111 – Inorganic Chemistry 2.
The effectiveness of the “3D Sym Op” was assessed systematically using the timeline in Fig. 1(a). The registration email that was sent to the CM2111 – Inorganic Chemistry 2 class had no indication that this educational study is technology enhanced or app related to avoid recruiting participants with such bias. Instead, the email invited opt-in volunteers to participate in an educational study on Molecular Symmetry, with the incentive of $15 vouchers, and withdrawal was possible at any stage. Details in this email followed the university's requirements for an ethics review exemption. The 30 minute Pre-Test and Post-Test (Fig. 2) were identical with 12 questions extracted from past year examinations of CM2111, in order to constructively align this app evaluation study with their eventual final assessment. The Point Group Flowchart and Character Tables were included in both tests. At the first of two 45 minute App Assisted Interactive Tutorials (AAITs), which were by registration and additional to the standard CM2111 lectures and tutorials, participants working in groups of 2–3 used the app to visualise the symmetry elements and operations (movements) in 3D and drew in 2D all the symmetry elements on the four molecules (Fig. 2). The next AAIT had 2–3 grouped participants visualising the symmetry elements and operations within the app, together with the provided Point Group Flowchart, assigning the point group to four molecules (Fig. 2). The task was also reversed, given the point group Oh, all symmetry elements had to be visualised using the app and listed on the worksheet. Prior to the Post-Test, a survey collecting self-professed frequency of app use, perception of app's usefulness and preferences compared to physical models was completed. The survey crafted with nine convergent and divergent questions to test consistency and reduce survey fatigue (National Research Center Inc., 2016) had the format of multiple choice, Likert scale and open text.
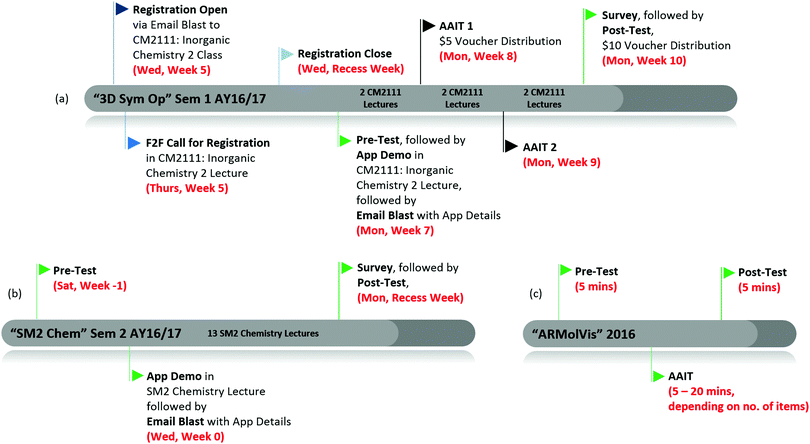 | ||
| Fig. 1 Typical timelines for the (a) three “3D Sym Op” app evaluation studies, (b) three “SM2 Chem” app evaluation studies and (c) “ARMolVis” app evaluation study. | ||
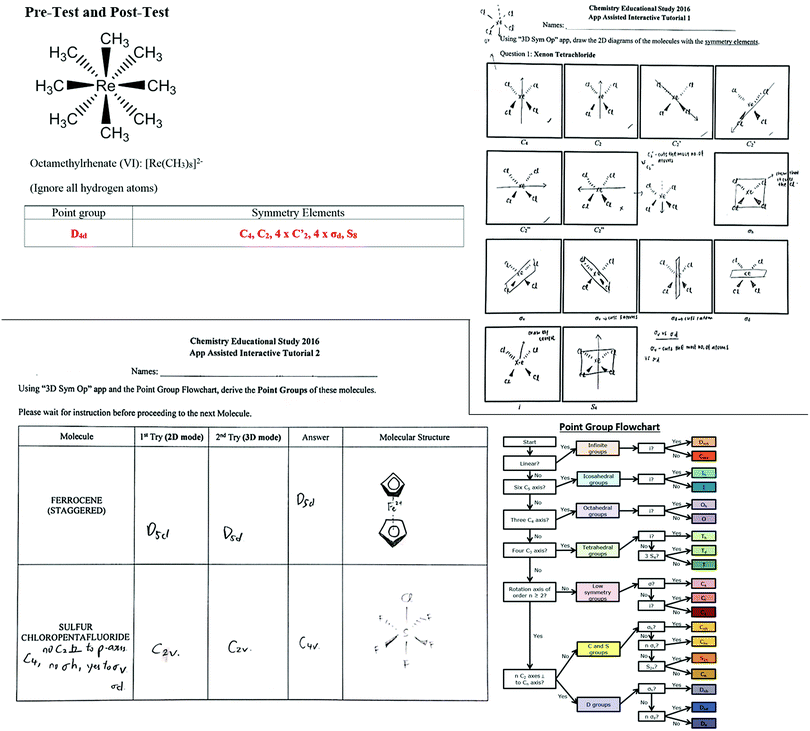 | ||
| Fig. 2 Selected questions and tasks extracted from the Pre-Test and Post-Test, and AAIT 1 and 2 worksheets of the “3D Sym Op” app evaluations. | ||
The hypothesis for the app evaluations is that if the mobile apps are indeed effective, the Post-Test vs. Pre-Test % increase for those who used the app more frequently (Very Frequently, Frequently and Occasionally) should be higher compared to those who use the app rarely (Rarely, Very Rarely and Do not use/Do not have). The Post-Test vs. Pre-Test % increase was calculated as [(Post-Test − Pre-Test)/Pre-Test] × 100%, where 100% equates to doubling and 200% is for tripling of the score. Dixon Q test at 95% confidence level was performed on % increase values to exclude outliers. The mean % increase for those who responded in the survey that they used the app more frequently (Very Frequently, Frequently and Occasionally) and mean % increase for those who responded that they used the app rarely (Rarely, Very Rarely and Do not use/Do not have) were then calculated. Subsequently,  was reported. The number of respondents in each frequency category varied and to deduce each category's contribution to the % increase, a weighted % increase for each and then grand average was calculated as
  .
.
For statistical analysis, initially, a two-sample F-test for variances was carried out to determine if the variance of the % increase for those who responded that they used the app more frequently and variance of the % increase for those who responded that they used the app rarely, differed. Following that, the corresponding two-sample t-test was carried out using the same data with the alternative hypothesis that Post-Test vs. Pre-Test % increase for those who used the app more frequently is higher compared to those who use the app rarely, μfrequently > μrare. The p-value and Cohen's D for effect size were reported. These statistical tests were performed on the moderately normal distributed data, which was determined by calculating the skew of the Pre-Tests and Post-Test scores, giving skew values between 0.5 and 0.7.
“SM2 Chem” – English–Chinese dictionary app for chemistry terms
“SM2 Chem” (SM2 Chem, 2013) is a Dictionary app designed as a learning tool with detailed information for SM2 Chemistry students. It contains 1160 Chemistry terms in both English and Chinese, along with definitions and audio pronunciations. It also includes a Periodic Table with data such as relative atomic mass, melting point and boiling point, density and additional properties for each element. Finally, it offers a practice quiz mode for students to facilitate their self-learning.Knowledge and understanding of scientific language is a necessary factor for understanding Chemistry as a subject. For most students, scientific language represents a new, foreign-seeming language (Markic, 2015). This difficulty is essentially doubled for English as a Second Language (ESL) speakers who are learning Chemistry terms in English. Having learnt Chemistry in Mandarin throughout all previous school years, now having to learn it in English is not an easy feat, particularly because of the vast number of unfamiliar Chemistry terms. Hence, the “SM2 Chem” app was created using recommended approaches to teaching Chemistry to ESL speakers, including using vocabulary and technology, where vocabulary lists are accompanied with pronunciation and images, and incorporated into conversations and writing (Kimbrough and Cooper, 2009).
The 20 minute Pre-Test consisted of 30 multiple choice questions – 10 questions gave the Chinese word and definition and the student had to choose the corresponding English word from four choices, the next 10 were reversed, giving the English word and definition and asking the student to choose the corresponding Chinese word from four choices and the last 10 were to match 10 Chinese words and definitions by selecting from a list of 20 English terms. After establishing this proficiency baseline, an App Demo was performed prior to the first lecture and students were shown and instructed to use the Syllabus option within the app, which presents the terms by the 17 Chapters in chronological teaching order of the course. Prior to any lecture, they were instructed to read the lecture notes and extract the Chinese terms and/or definitions from that Chapter within the app and write them in their lecture notes. Eight weeks later, a survey collecting their self-professed frequency of app usage and perceptions, followed by the identical 20 minute Post-Test was carried out (Fig. 1(b)). The Pre-Test and Post-Test were done together with the continual assessment tests for the entire SM2 Chemistry class.
Data processing and statistical analysis was identical to “3D Sym Op” as discussed in the previous section. The skew of the Pre-Tests and Post-Test scores were between −0.1 and 0.1 indicating symmetric normal distributions.
“ARMolVis” – augmented reality molecular visualiser
“ARMolVis” (ARMolVis, 2016) is an Augmented Reality Molecular Visualiser for everyday products. Users can hover over 2D photos of several everyday products and the corresponding molecule that is predominant in that product appears in 3D on the device. Chemistry is all around. The app will allow users to identify the chemical name, formula and 3D structure of several everyday products including food, household items, stationery, hardware and health products. The 2D photos are available at http://tinyurl.com/armolvis and can be manipulated so that the 3D molecule can be viewed from various angles.The mobile app “ARMolVis” was used in a 30 minute activity within the department's outreach programmes, such as Junior College (JC) Afternoons (Fig. 1(c)). The goal of the AAITs was for participants to appreciate that Chemistry is everywhere and using trendy technology like augmented reality enhanced the learning experience. The activity begun with a 5 minute Pre-Test, during which the participants, individually or in pairs, filled in a table with the Major Chemical/s, or the most distinctive chemical, in each of 6, 10 or 20 Everyday Products, to the best of their knowledge (Fig. 3). On the AAIT Worksheet that was subsequently handed out, 5–20 minutes, depending on the number of everyday products, was allocated for participants to use the app to scan the 2D photos and Common Name, printed on their AAIT worksheet, and use the information that appears on their device (chemical name, formula and 3D molecule) to complete the worksheet with chemical name, formula and 3D structure. For the Post-Test, without referring to their AAIT worksheet, participants, individually or in pairs, filled in the Post-Test which is identical to the Pre-Test.
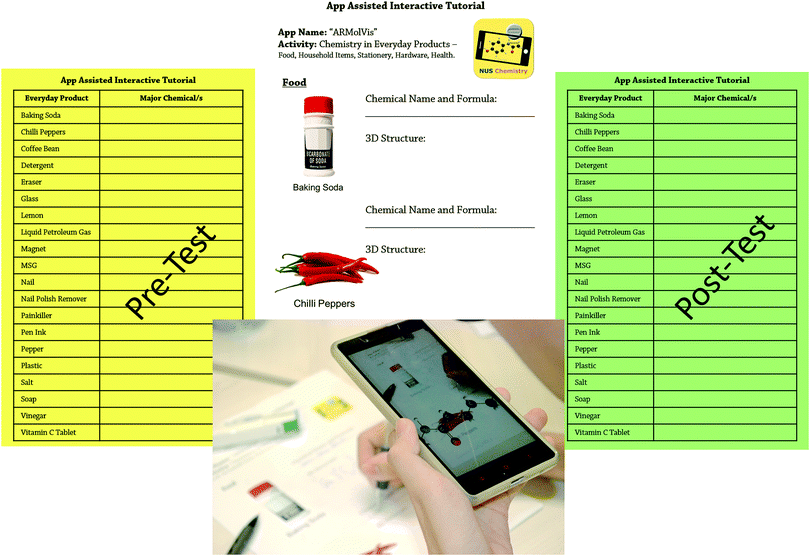 | ||
| Fig. 3 Pre-Test for 20 everyday products, selected questions extracted from AAIT worksheet and Post-Test for 20 everyday products of the “ARMolVis” app evaluation. | ||
After all the Pre-Tests and Post-Tests were marked and scored, the Pre-Tests and Post-Tests for 6, 10 and 20 everyday products were separated. The mean and standard deviation for the Pre-Test for 6 everyday products and that for the identical Post-Test were deduced and plotted. The difference between the Post-Test mean and Pre-Test mean was calculated. These data processing steps were repeated for the tests with 10 and 20 everyday products.
Results and discussion
“3D Sym Op” – symmetry elements and operations
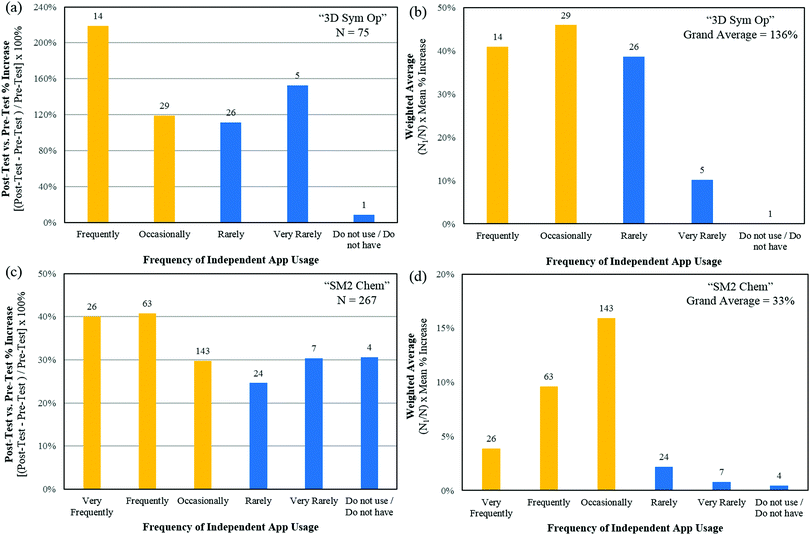
A Dixon Q test at 95% confidence level was performed on % increase values and one outlier was excluded from the 76 participants. The Post-Test vs. Pre-Test % increase for those who used the app more frequently (Very Frequently, Frequently and Occasionally) was 1.86 times compared to those who used the app rarely (Rarely, Very Rarely and Do not use/Do not have). Comparison was between those who had frequent independent app usage for which mean % increase was 169% and those who had rare independent app usage with their mean % increase at 91% (Fig. 4(a)). Of the 75 participants, only two (3%) showed Post-Test vs. Pre-Test % decrease. The weighted average graph (Fig. 4(b)) shows the major contributors to the grand average of 136% increase, calculated as , as the respondents who use the app with high frequency at 87% out of 136% (64%). However, statistical analysis using a one-tail t-test for two-samples for unequal variances yielded a p-value of 0.098, indicating that mean % increase μfrequently and μrare were statistically similar. The effect size using Cohen's D had a value of 0.3 signifying a medium difference between means.
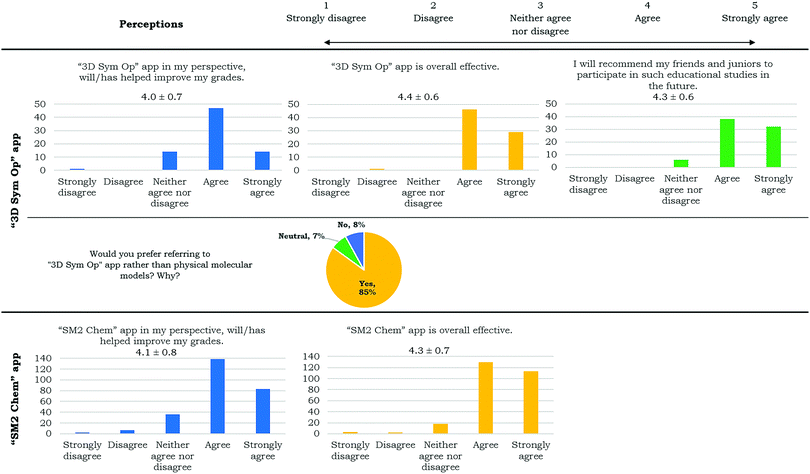
Positive perceptions of the “3D Sym Op” app were quantified in a series of questions including a 4.4 out of 5 score agreeing that the app was overall effective and 85% preferring the app over physical molecular models (Table 3). Most quoted reasons for the preference were that the app showed the symmetry elements for molecules (27%), was convenient and easily accessible (24%) and the user was able to watch the movement (symmetry operation) (16%).
“SM2 Chem” – English–Chinese dictionary app for chemistry terms
Two participants were excluded from the 269 as one did not use a phone and the other did not complete the survey. The Post-Test vs. Pre-Test % increase for those who used the app more frequently (Very Frequently, Frequently and Occasionally) was 1.28 times compared to those who use the app rarely (Rarely, Very Rarely and Do not use/Do not have). Those who had frequent independent app usage had a mean % increase of 34% compared to those who had rare independent app usage for which their mean % increase was 26% (Fig. 4(c)). Of the 267 participants, only eight (3%) showed Post-Test vs. Pre-Test % decrease. The weighted average graph (Fig. 4(d)) shows the major contributors to the grand average of 33% increase, calculated as , as the respondents who use the app with high frequency (29% out of 33% (88%)). Statistical analysis using a one-tail t-test for two-samples for unequal variances yielded a p-value of 0.037 and the effect size using Cohen's D had a value of 0.3, both indicating that mean % increase μfrequently > μrare. Users perceived that the “SM2 Chem” app helped improve their grades and was overall effective (Table 3).
“ARMolVis” – augmented reality molecular visualiser
Comparing the Pre-Test and Post-Test Scores before and after the AAIT, participants were able to recall up to seven more major chemicals in everyday products, newly introduced within the “ARMolVis” app (Fig. 5). According to Cognitive Load Theory, this value of seven is the average number of bits of information that a working memory is able to hold at one time (Jong, 2009). It also supports that using the app in the 30 minute AAIT as an experiential learning activity, is beneficial in converting information from working, short-term (<30 s) to long-term memory (relatively permanent) (Barringer et al., 2010; Huffman et al., 2013).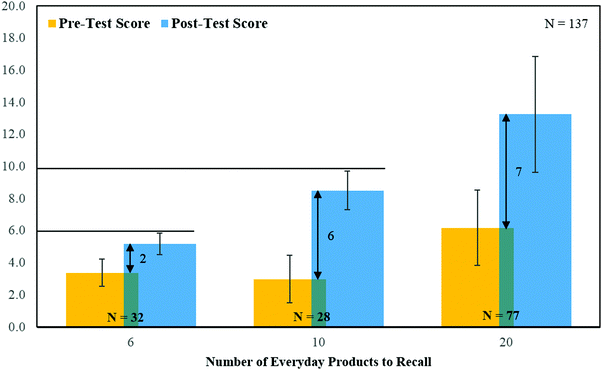 | ||
| Fig. 5 Pre-Test and Post-Test Scores before and after the AAIT using the Worksheet with 6, 10 or 20 Everyday Products and the “ARMolVis” App. | ||
Of the 137 participants, only two (1%) showed lower Post-Test vs. Pre-Test scores. Apart from good recall, the advantages of learning in an AAIT rather than a traditional lecture, where participants hear content and view images, chemical names and structures on slides, are that the “teachers” role is minimal and “students” self-drive and self-pace their learning.
The activity, AAIT, in which the app was used and its goal, which was for participants to appreciate that Chemistry is everywhere and using trendy technology like augmented reality enhanced the learning experience, directed the capabilities of the app. If it was used in a class where the teacher would teach these students again, rather than this one-off outreach activity, one could go deeper into the chemical and physical properties of each of the molecules and then link it to why it is used in the everyday product, for deeper chemical intuition and representational competence.
Conclusions
Three internally developed mobile apps were evaluated in seven studies, each with a systematic combination of Pre-Test, In-lecture App Demo, App Assisted Interactive Tutorials (AAITs) and/or Independent App Usage (IAU), followed by a Survey and Post-Test. For both “3D Sym Op” and “SM2 Chem” apps, the Post-Test vs. Pre-Test % increase for those who used the app more frequently was higher by 1.86 and 1.28 times than for those who used the app rarely. However, for “3D Sym Op”, at 95% confidence level, the μfrequently and μrare were statistically similar. For the third app “ARMolVis”, besides augmented reality being one of the more recent technology trends and hence captivating, participants were able to recall up to seven more major chemicals in everyday products, newly introduced within the app. In conclusion, overall, higher frequency of app usage supports increased student performance.In our opinion and shown with this work, apps are most effective when used in AAITs with the Blended Learning approach. This approach requires the physical presence of both teacher and students, but with some element of student free play such as using the app to complete worksheets in pairs or groups.
Conflicts of interest
There are no conflicts to declare.Acknowledgements
The authors would like to thank the developers who contributed to the apps including Soo Yuen Jien from the School of Computing and Giam Kok Leng from the Computer Centre. Financial support from the Learning Innovation Fund-Technology (LIFT) which aims to enhance education through technology and administered by the Office of the Provost at NUS is deeply appreciated.References
- 3D Sym Op [Mobile Application], (2016), retrieved 7 August 2017, from http://https://itunes.apple.com/sg/app/3d-sym-op/id1067556681?mt=8 Apple App Store and http://https://play.google.com/store/apps/details?id=com.nus.symmo&hl=en Google Play Store.
- Ardac D. and Akaygun S., (2004), Effectiveness of Multimedia-Based Instruction that Emphasizes Molecular Representations on Students' Understanding of Chemical Change, J. Res. Sci. Teach., 41(4), 317–337, DOI: http://10.1002/tea.20005.
- ARMolVis [Mobile Application], (2016), retrieved 7 August 2017, from http://https://itunes.apple.com/sg/app/armolvis/id1095181960?mt=8 Apple App Store and http://https://play.google.com/store/apps/details?id=nus.cc.mobile.armolvis&hl=en Google Play Store.
- Barringer M-D., Pohlman C. and Robinson M., (2010), Schools for All Kinds of Minds: Boosting Student Success by Embracing Learning Variation, 1st edn, San Francisco: Jossey-Bass.
- Center for Education Reform, (2011), Digital Learning Now! – Roadmap To Reform, retrieved 7 August 2017, from http://digitallearningnow.com/site/uploads/2014/03/Roadmap-for-Reform.pdf.
- Dunaway K. M., (2011), Connectivism, Ref. Serv. Rev., 39(4), 675–685, DOI: http://10.1108/00907321111186686.
- Graham C. R., (2006), Blended Learning Systems: Definition, Current Trends, and Future Directions, in Bonk C. J. and Graham C. R. (ed.), The Handbook of Blended Learning: Global Perspectives, Local Designs, San Francisco: Pfeiffer, pp. 3–21.
- Huffman K., Younger A. and Vanston C., (2013), Visualising Psychology, 2nd Canadian Edition, Wiley.
- Johnstone A. H., (1982), Macro- and Micro-Chemistry, Sch. Sci. Rev., 64, 377–379.
- Jones L. L., (2013), How Multimedia-Based Learning and Molecular Visualization Change the Landscape of Chemical Education Research, J. Chem. Educ., 90(12), 1571–1576, DOI: http://10.1021/ed4001206.
- Jong T., (2009), Cognitive Load Theory, Educational Research, and Instructional Design: Some Food for Thought, Instr. Sci., 38(2), 105–134, DOI: http://10.1007/s11251-009-9110-0.
- Kelly R. M. and Jones, L. L., (2008), Investigating Students' Ability to Transfer Ideas Learned from Molecular Animations of the Dissolution Process, J. Chem. Educ., 85(2), 303–309, DOI: http://10.1021/ed085p303.
- Kimbrough D. and Cooper S., (2009), Embracing Diverse and English Language Learners inChemistry, in Bretz S. L. (ed.), Chemistry in the National Science Education Standards: Models for Meaningful Learning in the High School Chemistry Classroom, 2nd edn, American Chemical Society, pp. 119–128.
- Libman D. and Huang L., (2013), Chemistry on the Go: Review of Chemistry Apps on Smartphones, J. Chem. Educ., 90(3), 320–325, DOI: http://10.1021/ed300329e.
- Markic S., (2015), Chemistry Teachers' Attitudes and Needs When Dealing With Linguistic Heterogeneity in the Classroom, in Kahveci M. and Orgill, M. (ed.), Affective Dimensions in Chemistry Education, Germany: Springer, pp. 279–296.
- Mayer R. E. and Moreno R., (2002), Animations as an Aid to Multimedia Learning, Educ. Psychol. Rev., 14(1), 87–99, DOI: http://10.1023/A:1013184611077.
- National Research Center Inc., (2016), How to Avoid Survey Fatigue, retrieved 7 August 2017, from http://www.n-r-c.com/how-to-avoid-survey-fatigue/.
- Paivio A., (1969), Mental Imagery in Associative Learning and Memory, Psychol. Rev., 76(3), 241–263.
- Raiyn J. and Rayan A., (2015), How Chemicals' Drawing and Modelling Improve Chemistry Teaching in Colleges of Education, World J. Chem. Educ., 3(1), 1–4, DOI: http://10.12691/wjce-3-1-1.
- Siemens G., (2005), Connectivism: A Learning Theory for the Digital Age, Int. J. Instruct. Tech. Dist. Learn., 2(1), 3–10.
- SM2 Chem [Mobile Application], (2013), retrieved 7 August 2017, from http://https://itunes.apple.com/sg/app/sm2-chem/id775658884?mt=8 (2013) Apple App Store and http://https://play.google.com/store/apps/details?id=com.nus.sm2chem&hl=en (2014) Google Play Store.
- Staker H. and Horn M. B., (2012), Classifying K-12 Blended Learning, Clayton Christensen Institute, retrieved 7 August 2017, from http://https://www.christenseninstitute.org/wp-content/uploads/2013/04/Classifying-K-12-blended-learning.pdf.
- Tan E. S. Q. and Soo Y. J., (2017), Creating Apps: A Non-IT Educator's Journey Within a Higher Education Landscape, in Murphy A., Farley H., Dyson L. E. and Jones H. (ed.), Mobile Learning in Higher Education in the Asia Pacific Region, Singapore: Springer, pp. 213–238.
- Vranes A., Marković L. and Mariokov M. J., (2015), The Connectivism as a Learning Theory from the Prism of Blended Learning, in 8th International Conference of Education, Research and Innovation 2015 Proceedings, Spain, pp. 424–430.
| This journal is © The Royal Society of Chemistry 2018 |

