Mass transfer considerations for monitoring catalytic solid–liquid interfaces under operating conditions
Laura
Rodríguez-García
a,
Roland
Walker
a,
Eyal
Spier
b,
Konrad
Hungerbühler
a and
Fabian
Meemken
 *a
*a
aInstitute for Chemical and Bioengineering, Department of Chemistry and Applied Biosciences, ETH Zürich, Hönggerberg, HCI, CH-8093 Zürich, Switzerland. E-mail: fabian.meemken@chem.ethz.ch
bCOMSOL Multiphysics GmbH, Technoparkstrasse 1, 8005 Zürich, Switzerland
First published on 18th December 2017
Abstract
Correlating catalytic performance and molecular-level information from the same catalyst sample is a promising approach to cope with the complexity of multiphase catalytic systems and to provide detailed mechanistic insight. To obtain information about the intrinsic reaction kinetics, the development of operando spectroscopy requires operation as well as surface-sensitive detection of the catalytic process in the absence of mass transfer limitations. In the present work, we investigated the effect of mass transfer on the detection of active species at the catalytic solid–liquid interface using attenuated total reflection-infrared (ATR-IR) spectroscopy. To gain a profound understanding of the mass transport within typical flow-through cells we have assessed the hydrodynamics as well as the transport of solutes within the liquid phase and the porous catalyst sample using a convection–diffusion model. The combination of computational and experimental data revealed four sensitive design parameters controlling the mass transfer within the ATR-IR spectroscopy cells. Using the asymmetric hydrogenation of phenyl cinnamic acid on a chirally modified Pd catalyst as a model reaction, we demonstrate the effects of mass transfer within the catalyst sample on the activity and selectivity.
1. Introduction
Understanding molecular processes at solid–liquid interfaces is fundamental to many technological applications.1,2 In heterogeneous catalysis, the interface formed between the catalytic solid and a liquid phase plays a central role in biomass conversion,3,4 fine chemical production,5 waste water treatment6 and fuel cell technology.7 The presence of the liquid often imparts unique properties to solids8 and the choice of the solvent may even change the surface chemistry in heterogeneous catalysis.9,10 In addition, the mass transport of reactant(s) and product(s) not only can alter reaction rates but also can change selectivity and even reaction mechanisms.11 Monitoring catalysis at solid–liquid interfaces under working conditions is therefore crucial to gain a better mechanistic understanding of the underlying surface processes and to obtain structure–activity–selectivity relationships.12–17While a spectroscopic characterization of the catalyst in the same reaction environment but often under simplified operational conditions is termed in situ, an operando spectroscopy study also embraces simultaneous acquisition of catalytic data of the same catalyst sample. Accordingly, the challenge in the development of operando spectroscopy is to achieve conditions which are suitable for both a surface-sensitive detection of the probed catalyst sample and the operation of the catalytic reaction. The design of the spectroscopy reactor cell has to ensure proper external heat and mass transport, particularly at the probed catalyst sample,18 to allow for an evaluation of reaction kinetics and adsorption processes pertinent to catalytic heterogeneous reaction systems.11
Rapid mass transport as well as low absorption of electromagnetic radiation by a gaseous reaction medium facilitates the spectroscopic investigation of catalytic solid–gas interfaces.16,19 In contrast, the presence of the liquid solvent poses a more challenging reaction environment and the progress in operando spectroscopy of catalytic solid–liquid interfaces has been lagging behind.20–22 Attenuated total reflection-infrared (ATR-IR) spectroscopy is currently one of the most suitable techniques to monitor surface processes on technical catalysts such as supported metal oxides in the presence of a solvent.23,24 In the past, flow-through ATR-IR spectroscopy cells have been employed in mechanistic studies including heterogeneous hydrogenation25,26 and oxidation,27,28 H-transfer reactions29 and aqueous phase reforming.30–32 Because of the small penetration depth of this spectroscopy technique, strong absorption of the ubiquitous liquid phase is largely avoided. The evanescent wave formed by the incident IR light probes only a few micrometers into the catalyst sample, which has to be deposited directly onto the internal reflection element (IRE) to provide surface-sensitive information. To improve the signal-to-noise ratio of ATR-IR surface spectra, most spectroscopy cells are designed to probe a larger section of the catalyst sample across the IRE by multiple reflections of the propagating IR light.12,20,30,33,34 However, the size of the probing area, which is generally on the order of 200–400 mm2 for trapezoidal ZnSe IRE,12,27,35,36 is reflected in the sample average data and the quality of the recorded surface information can be compromised by concentration gradients within the flow-through reactor. Particularly for ATR-IR spectroscopy measurements, the probe section at the catalyst-covered IRE is susceptible to mass transport limitations (Fig. 1). Insufficient mass transfer within the catalyst sample, which will be most prominent in close vicinity to the IRE, may lead to a non-uniform distribution of surface species and important information about active surface species and adsorption kinetics might be lost.
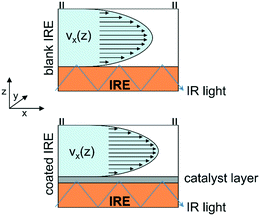 | ||
| Fig. 1 Schematic representation of flow profiles within the reactor on a blank and a catalyst-coated IRE. | ||
Insufficient fluid exchange within the spectroscopy cell may especially limit an experimental design that requires a fast exchange of the liquid phase, e.g. for concentration modulation excitation spectroscopy (MES). The application of MES in combination with phase-sensitive detection (PSD) has become increasingly popular as a means to reduce noise, extract kinetic information and distinguish between active and spectator species.37 Despite other important requirements such as the reversibility of the system,38 the advantages connected to MES and PSD are only fully exploited with state-of-the art spectrometers using short modulation frequencies,39e.g. a few tens of seconds (<30 s). However, the mass transfer within conventional ATR-IR spectroscopy cells might be too limited for such a rapid exchange when deposited powder catalyst samples are studied. In the past, the operational limits were investigated on the basis of dimensionless Péclet and Sherwood numbers and Thiele modulus.27 Other reported studies have addressed reaction engineering aspects connected to flow-through spectroscopy cells,34 the design of a two-inlet port cell for MES measurements,35 the optimization of spectroscopy reactor cells for in situ studies at elevated temperatures and pressures,30,40 the extraction of relative adsorption and desorption rates from experimental data using convection–diffusion models41 and the design for simultaneous detection of bulk liquid and the catalytic solid–liquid interface.20
In general, reaction engineering studies employing computer-assisted simulations provide an alternative cost- and time-saving procedure to the experimental evaluation of contacting patterns for multi-phase systems. Furthermore, the analysis and validation of experimental data by computational simulations can provide valuable information on the influence of operational parameters of microreactors.42 The influence of the properties of the catalyst sample, in particular the implications of the sample preparation and the layer thickness, in combination with the operated liquid flow rate on the operando ATR-IR spectroscopy detection has not been addressed in the literature. In the context of concentration gradients within reactor cells (z-direction) the thickness of the deposited powder catalyst sample plays a critical role regarding the external mass transport at the solid catalyst and, more importantly, regarding the spectroscopic detection in close vicinity to the IRE. As the penetration depth is often below 5.0 μm,36 great care must be taken to avoid external mass transport limitations that could hamper the detection of active species. Generally, the spectroscopic detection is expected to be free of severe mass transfer limitations if thin catalyst layers of a few μm thickness are used and the reactor is operated at flow rates of a few mL per minute (≥2 mL min−1). The use of powder catalysts not only provides good mass transport and catalytic properties, characterization studies involving such technical catalysts also provide relevant information for future development and scale-up. However, they also add to the complexity of the investigated system and the detection of active species might be hampered by additional adsorption of spectator species on the support material.43
To evaluate various in situ ATR-IR spectroscopy cell designs for operando spectroscopy studies, we investigated the mass transfer computationally and experimentally considering different cell designs. We implemented a convection–diffusion model in COMSOL Multiphysics® and compared the simulated mass transfer to the experimentally observed mass transfer employing methylene blue as a tracer. Using the asymmetric hydrogenation of phenyl cinnamic acid (PCA) on a 5 wt% Pd/TiO2 catalyst modified with the chiral modifier cinchonidine (CD),44 we investigated experimentally the catalytic performance of various cells as well as the spectroscopic detection of active species. Our study focuses on design aspects such as the inlet geometry of the reactor cell, the ratio of solid catalyst to liquid phase volume and the operated volumetric flow rate. Based on our computational and experimental investigation we present an improved ATR-IR spectroscopy reactor cell design and identify operational conditions which allow improvement of the overall mass transport within the reactor cell and elimination of external mass transport limitations over the catalyst layer.
2. Experimental
2.1 Materials
Ethanol (Merck, EMSURE®, absolute for analysis), isopropanol (Sigma Aldrich, puriss., ≥99.5%), 1,4-dioxane (Fisher Chemical, 99.99%), TiO2 (Aldrich, nanopowder, 21 nm particle size, ≥99.5% trace metal basis), methylene blue (Acros, pure, certified) and cinchonidine (Aldrich, 96%) were used as received. The olefin α-phenyl cinnamic acid (Aldrich, 97%) was purified by sublimation and recrystallization from acetone (Fisher Chemical, 99.8%). The preparation of a 5 wt% Pd/TiO2 catalyst has been described elsewhere.45 The catalyst was reduced in a fixed-bed tubular reactor under flowing hydrogen for 30 min at room temperature prior to use.2.2 Computational modelling
The Navier–Stokes equations, which govern the fluid dynamics in the reactor cell, were solved numerically using finite element analysis in COMSOL Multiphysics software (version 5.3). The simulations of the hydrodynamics in the reactor cell were modelled by using the physics module “free and porous media flow” using the following conditions: incompressible liquid, “no slip” boundary conditions at the walls, the velocity field at the inlet pointing in the z-direction and a pressure drop of 2000 Pa at the outlet of the reactor (at 1 ml min−1) with suppressed backflow. The pressure drop over the reactor cell was calculated using an empirical formula for rectangular micro channels and flow in the laminar regime.46 The simulations were performed for ethanol solutions at room temperature, and a porous 50 μm titanium oxide layer (porosity 0.3) was added at the bottom of the modeled reactor cell for simulations involving a catalyst-coated IRE. The model was solved by the stationary solver (hydrodynamics in the steady state) with its default termination criteria.In the second step, the transport of diluted species was simulated with the physics module “transport of diluted species in porous media”. The velocity field obtained from the steady state flow simulation was used to mimic the transient transport of the solute within the reactor cell. The following boundary conditions were included: no adsorption in porous media, no flux boundary condition at the walls, zero initial concentration, in-flow concentration in the form of a step function from 0 to 1 mM. The diffusion coefficient for methylene blue was assumed to be equal in ethanol solution and in methanol solution (DMB = 7.9 × 10⁻⁶ cm2 s−1).47 No values for the diffusion coefficients of CD were found in alcohol solution, but it can be roughly approximated by a comparison of the diffusion coefficient of a closely related cinchonine-based squaramide (4.9 × 10⁻⁶ cm2 s−1).48 The effective diffusion coefficient in the porous media was calculated using the Millington and Quirk model (Deff,i = Dfluid,i·ε4/3, where ε is the porosity).49
2.3 Experimental validation of the mass transport
Two designs of home-built ATR-IR spectroscopy reactor lids were evaluated: the reactor design with a round perpendicular inlet (67.9 × 5.8 × 0.2 mm) and a new, slightly larger reactor design (69.2 × 7.1 × 0.1 mm) with a slit inlet at an angle of 45°. The reactor lids were attached to a transparent polycarbonate plate as the bottom part and used in this set-up for all visual measurements. A methylene blue solution (ca. 50 mM in ethanol) and pure ethanol were filled in separate glass tanks under a normal atmosphere. The tanks were connected to the reactor cell by Teflon tubing and a three-way valve. The solutions were introduced by using a peristaltic pump installed behind the reactor cell. Photos and videos were recorded on a digital single-lens reflex camera (Canon EOS 550D) placed below a home-built stand for the reactor cell. The IR validation was performed under the same conditions, but using a ZnSe internal reflection element (IRE) as described in section 2.4.2.4. ATR-IR spectroscopy
Catalyst layers for the ATR-IR spectroscopy experiments were prepared according to the following procedure: a slurry was prepared with the reduced Pd/TiO2 catalyst and 1,4-dioxane (2 mL), which was ultrasonicated for 15 min to obtain a well-mixed suspension. Subsequently, the entire amount of the slurry was placed on a ZnSe IRE (bevel of 45°, 72.0 mm × 10.0 mm × 6.0 mm, Specac Ltd.), and 1,4-dioxane was evaporated at 353 K for 1 h. This procedure yielded a catalyst layer of 3.0 ± 0.1 mg when starting with 4 mg Pd/TiO2 catalyst. For layers of different thicknesses the amount of catalyst used to prepare the suspension was adjusted. For SEM analysis, the catalyst layers were deposited onto glass plates that mimicked the IRE and were broken before the measurements.ATR-IR spectra were recorded on a Bruker vertex 70 spectrometer equipped with a liquid nitrogen cooled MCT detector. The standard home-built stainless steel flow-through cells have a height of either 200 μm with a round inlet port, or 20, 100 or 200 μm with a tilted inlet slit design. The reactor cells were mounted on an ATR-IR attachment (OPTISPEC) for all measurements. The measurement temperature (298 K) was regulated by a thermostat (Haake N3 with an external water cooling connection). The implementation of the ATR-IR spectroscopy reactor cell into a recycle reactor has been described in detail elsewhere.20 The set-up can be operated either in recycle or in flow-through mode. The experimental procedure was as follows: in situ reduction by subjecting the catalyst layer to a flowing solvent saturated with hydrogen at 298 K for 1 h prior to use at a flow rate of 1 ml min−1 in flow-through mode. Then, the liquid flow velocity was adjusted to the stated flow rate for the modification and reaction runs. The recycling operation was performed either in a closed-loop or in a flow-through mode (specified in the text). The IR spectra were acquired in rapid scan mode by co-adding 32 scans into one spectrum at a scanner velocity of 80 kHz, which resulted in a time resolution of 4.09 s per spectrum. The chiral modification was initiated by exchanging the liquid phase of the recycle reactor with the CD solution (with the stated concentration) and recycling it for the stated time.20 The reaction was initiated after flushing out the modifier solution for 1 min with pure solvent in the flow-through mode. The recycler was filled with reactant solution (with the stated concentration) and recycled for a given time.
2.5 HPLC analysis
Chiral high performance liquid chromatography (HPLC) was performed using an Agilent Technologies 1200 series system equipped with a Reprosil Chiral-NR (8 μm, Dr. Maisch, Germany) column. As eluent, a 98![[thin space (1/6-em)]](https://www.rsc.org/images/entities/char_2009.gif) :
:![[thin space (1/6-em)]](https://www.rsc.org/images/entities/char_2009.gif) 2
2![[thin space (1/6-em)]](https://www.rsc.org/images/entities/char_2009.gif) :
:![[thin space (1/6-em)]](https://www.rsc.org/images/entities/char_2009.gif) 1 n-hexane/2-propanol/acetic acid mixture was used, which allowed separation of the PCA as well as the two enantiomers of the product diphenyl propanoic acid. For quantitative analysis, the response factors of the UV detection were determined at three wave lengths (254 nm, 260 nm and 265 nm) using calibration solutions of known concentration.
1 n-hexane/2-propanol/acetic acid mixture was used, which allowed separation of the PCA as well as the two enantiomers of the product diphenyl propanoic acid. For quantitative analysis, the response factors of the UV detection were determined at three wave lengths (254 nm, 260 nm and 265 nm) using calibration solutions of known concentration.
3. Results and discussion
3.1 Mass transport simulation of bare reactor cells
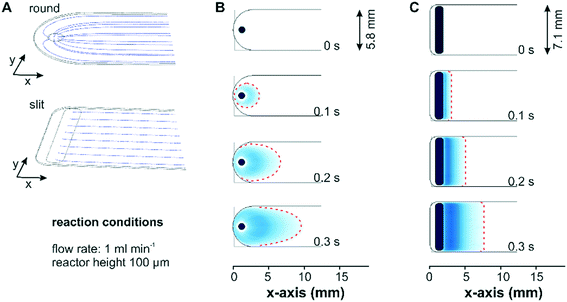
Two different designs for the fluid inlet and outlet ports of the flow-through reactor cell were investigated with respect to the mass transport: a conventional reactor design with a round inlet port, which can be simply drilled into the reactor lid, and a more advanced reactor design with a slit inlet port along the cell width, which was manufactured by wire-cut electrical discharge machining into the stainless steel lid. Fig. 2 shows the simulated fluid flow streamlines and concentration profiles for two bare reactor cells with a reactor height of 100 μm. For a better comparison, the reactor inlets were defined as a flat area in the model to exclude concentration effects associated to different inlet volumes. In Fig. 2A the streamlines of the entering fluid expanded in a radial direction around the circular inlet port and were partially directed backwards. This reversed flow pattern allows for a complete exchange of the liquid phase by advection and a parabolic velocity profile formed gradually across the width of the reactor. In contrast to the round inlet, the slit inlet reactor design displayed parallel streamlines over the entire reactor width, which developed right after the inlet port. For both reactors a parabolic flow profile was created along the reactor height in the z-direction.Simulation of a concentration step from 0 to 1 mM methylene blue at a flow rate of 1 ml min−1 displayed in Fig. 2B visualized the formation of the parabolic flow profile across the x–y-plane for the conventional reactor design. As seen in Fig. 2C the same concentration step led to a uniform concentration front across the entire reactor width for the slit inlet reactor starting shortly after the inlet. Nevertheless, the concentration simulation revealed the presence of a dead volume in the new reactor design, which was not exchanged by convection. Contrary to the design proposed by Aguirre et al. with a perpendicularly oriented slit inlet port,34 we designed the cell with a 45° tilted inlet port to reduce the viscous stress exerted by the entering fluid on the catalyst layer at higher flow rates (see below). Following this design approach, the dead volumes at the extremities of the reactor cell cannot be avoided due to manufacturing constraints related to the presence of the O-ring in the reactor lid. Although the experiments were performed with the constructed cell with a 45° tilted ports, for the sake of comparison the simulations of both reactor designs considered the liquid phase entering the reactor vertically.
3.2 Mass transport simulation of catalyst loaded reactor cells
The presence of a deposited catalyst layer fundamentally alters the fluid dynamics of the reactor cell and the mass transport of solutes to the probe section, where the catalyst bed is located. Introducing the catalyst layer will reduce the liquid phase volume (with equal reactor height), and therefore increase the fluid flow velocity. The resulting faster fluid phase exchange will decrease concentration gradients at the solid–liquid interface, which is beneficial for the diffusion of solutes to the catalyst particles. However, the catalyst sample will also severely increase the mass transfer resistance to the IR probe section depending on the diffusion coefficient of the reactant(s) and the properties of the catalyst layer.First, we investigated the influence of the liquid volume on the mass transport within the catalyst layer by modelling reactor cells of different heights. The reactor heights of ATR-IR spectroscopy cells have been reported to be on the order of 250–2600 μm,12,27,35,36 while standard commercial reactor cells have spacers of approximately 1000 μm thickness (Pike Technologies® and Specac Ltd.®). Generally, the studied catalyst layers have a thickness ranging from 5 to 100 μm to ensure full coverage of the probe section,12,26,31,36,50 even though the penetration depth usually amounts to only a few micrometers (<5 μm).36 For the sake of clarity, a sample layer thickness of 50 μm and no solute adsorption on the catalyst were considered in all simulations.
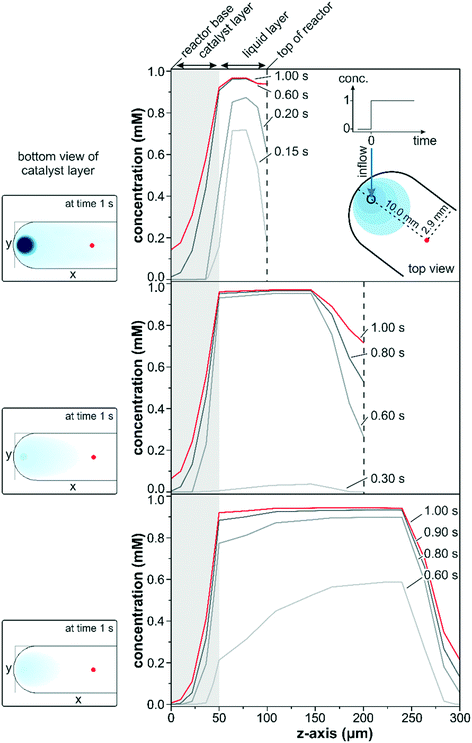
The transient data in Fig. 3 show a simulated concentration change from 0 to 1 mM at a flow rate of 1 ml min−1 for a conventional reactor with a varying reactor height ranging from 100 to 300 μm. The concentration changes within the three different reactors along the z-axis were compared in close vicinity to the entrance port (x = 10.0 mm; y = 2.9 mm) at various times after the start of the concentration step.
A steep increase in the liquid phase concentration was observed for the 100 μm reactor within the first 0.2 s of the concentration step. The liquid phase was rapidly exchanged within the first 0.6 s and remained almost constant at 0.95 mM thereafter. Due to back mixing, the fluid phase concentration was slightly lower than 1 mM within the first second but eventually reached the inlet concentration for longer simulation times. Simultaneously, the concentration at the catalyst boundary increased steadily within the first 0.2 s driving solute diffusion into the first few micrometers of the catalyst layer (gray marked area). At 0.2 s the interfacial concentration reached approximately 50% of the maximum value and increased to 90% after 0.6 s. Despite the high interfacial concentration reached at 0.6 s, the detected concentration within the penetration depth of the IR light (z = 5 μm) was only 16% after 1.0 s as a result of the thick catalyst layer.
Similar trends were also observed for the simulations which considered reactor heights of 200 and 300 μm. Nevertheless, the continuous replenishment of the liquid phase was more sluggish due to the larger fluid reservoir increasing the space-time. The space-time, which describes the required time to process one reactor volume of feed measured at specific conditions,51 was three and five times larger for the reactors of 200 and 300 μm height compared to the 100 μm reactor. While the liquid phase concentration reached over 70% of the maximum concentration within the first 0.15 s for the 100 μm reactor model, barely 5% were reached after 0.3 s for the 200 μm reactor model. For the 300 μm reactor model the liquid phase concentration approached 60% of the maximum after 0.6 s, but the interfacial concentration was only 20% and even 0% at the IRE–catalyst boundary. Within the same time frame, the 100 μm reactor model displayed 2% of the maximum concentration at the IRE–catalyst boundary. Note that these large differences in interfacial concentration were observed close to the inlet port and the discrepancy will be more pronounced along the length of the reactor.
The slower response times and the deviating concentration profiles can be rationalized by the reactor configuration. The concentration pulse entering through the reactor lid mounted from the top is spread into the liquid reservoir, where dilution and back-mixing reduce the liquid phase concentration. Accordingly, a lower liquid phase concentration was reflected in only a moderate increase of the interfacial concentration, forming a smaller concentration gradient for the diffusion through the catalyst layer. As a result the concentrations within the IR penetration depth for the 200 and 300 μm reactor models at 1.0 s amounted to 0.08 and 0.01 mM, respectively. The concentration patterns at the bottom of the catalyst layer after 1.0 s are shown as insets on the left side in Fig. 3. The smaller liquid reservoir for the 100 μm reactor allowed a significantly faster exchange of the liquid phase. The higher interfacial concentration drove the diffusion through the catalyst layer more rapidly, and at 1.0 s the solute concentration at the bottom of the catalyst layer was more than 2 and 20 times higher compared to the 200 μm and the 300 μm reactors, respectively. The insets also clearly show large concentration gradients around the inlet and along the x-axis and, obviously, the parabolic concentration profiles in the liquid phase induced severe concentration gradients along the y-axis. These two effects would be reflected in the recorded sample average data leading to a reduced detection of adsorbed species, which would be particularly pronounced upon rapid concentration changes on the 10 s scale.
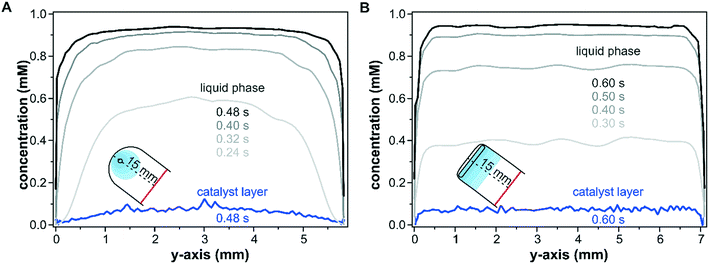
The effect of the inlet port geometry on the concentration gradient along the y-axis of the reactor with a height of 100 μm was also modelled. The concentration profiles shown in Fig. 4 illustrate the gradients along the y-axis close to the inlet port (x = 15.0 mm) within the catalyst layer and in the liquid phase at z-coordinates of 25 μm and 75 μm, respectively. For the sake of comparison, the selected time steps take the different reactor dimensions into account according to the cell volumes of 39 μL and 49 μL for the round inlet and slit inlet reactors, respectively. As seen in Fig. 4A for the conventional reactor design with a round inlet port, a parabolic fluid flow profile formed at the beginning of the pulse (0.24 s) in the liquid phase and was flattened by advection and diffusion with increasing times (0.40 s and 0.48 s). In particular, during the first 0.32 s, the concentration close to the reactor walls (y = 0.0 mm and 5.8 mm) remained nearly unchanged due to the wall boundary constraints. While these profiles correspond to the liquid phase in the center of the fluid phase (z = 75 μm), similar profiles were also found at the catalyst–fluid interface at z = 25 μm. The diffusion into the solid sample responded to the interfacial concentration and the non-uniform liquid phase concentration mapped a similar profile onto the porous catalyst layer. While the liquid phase reached a uniform concentration over the entire y-axis after 0.48 s, the parabolic shape observed at in the beginning of the concentration pulse was retained within the catalyst layer and propagated further in time.
In contrast to the round inlet port, the reactor model with a slit inlet displayed a plug-flow type concentration profile in the liquid phase over the y-axis from the beginning of the concentration step (see Fig. 4B at 0.30 s). With ongoing time the liquid phase concentration continued to increase while retaining its plug-flow type profile. The shape of the concentration pulse was mapped onto the catalyst layer as seen at 0.6 s. The solutes within the catalyst layer were distributed uniformly over the entire reactor width, except at the reactor walls close to 0.0 mm and 7.1 mm. The concentration averaged over the y-axis was 40% higher for the slit inlet reactor compared to the old reactor design (0.05 mM).
The simulations with different reactor heights but constant catalyst layer thickness as well as the simulations for the different inlet types reveal severe concentration gradients in the presence of a catalyst layer due to the slow solute exchange in the porous matrix. Such concentration gradients pose critical limitations, especially for concentration modulation experiments, which require a rapid replacement of the solutes within seconds.
3.3 Experimental validation of the simulated mass transport
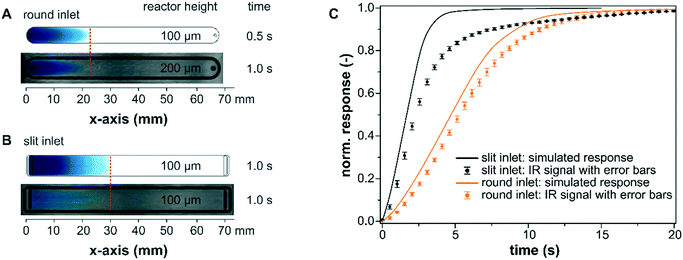
The experimental characterization of the mass transport within the bare reactor cells was performed using methylene blue as a tracer substance. As seen by the visual comparison of the modelled profiles and the tracer experiments using a polycarbonate plate instead of the IRE in Fig. 5A and B, the simulations are suitable to map realistic fluid velocities and concentration profiles in the liquid phase with sufficient accuracy for both reactor designs. The simulated mass transfer appeared to propagate slightly faster through the reactor for both models and they also displayed a perfectly symmetric form. These minor deviations probably originate from the selected diffusion coefficient for methylene blue (DMB = 7.9 × 10⁻⁶ cm2 s−1) at 35 °C in methanol.47 The experiment, however, was performed at 25 °C in ethanol. In addition, the experimental results showed small inhomogeneities in the flow profiles that can be traced back to the manufacturing of the reactor cell, particularly for the wire-cut electrical discharge machining of the stainless steel reactor lid with a slit inlet.The simulated concentration at the IRE was validated for longer simulation times until full exchange by comparing it with the IR signal detected during a methylene blue step using an empty reactor cell (slit and round). The experiments were reproduced three times for each reactor design and the averaged data are presented in Fig. 5C. The simulated concentration response was obtained by averaging the methylene blue concentration at the bottom of the reactor over the entire x–y plane (z = 0 mm). For the slit inlet reactor, the nearly linear increase of the measured concentration profile is well described by the simulation until approximately 70% of the maximum was reached. Towards full exchange of the cell the response of the IR signal deviated from the simulated response and was delayed by a few seconds compared to the ideal plug-flow type behavior. For the round inlet reactor, the modelled exchange was in good agreement with the detected IR response.
3.4 Influence of the catalyst layer on the operando spectroscopy characterization
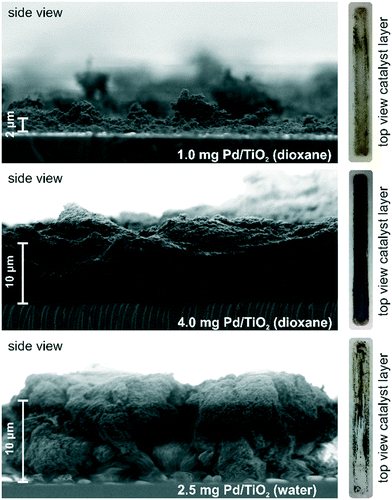
A slurry-drop deposition technique was used to prepare the powder catalyst layer on the IRE. Depending on the properties of the slurry solvent and the solid sample, this technique is suitable to create thin layers of supported powder catalyst in the μm range. The properties of the catalyst layer have to be optimal with respect to the spectroscopic detection and the mass transport. While the probed area of the IRE is ideally fully covered with a dense and homogeneous catalyst layer for full signal sensitivity, in particular, the density and thickness of the layer will compromise the mass transport and ultimately the formation of active species within the probe window. The quantity of deposited catalyst was used as a simple means to rank various differently prepared layers and to compare the quality of a layer with respect to diffusion resistance and spectroscopic detection.Using scanning electron microscopy (SEM) we investigated the thickness and microstructure of some catalyst layers for the new reactor design with a rectangular shape and a probing area of 490 mm2. For the SEM measurements, the catalyst samples were deposited onto a glass plate instead of the ZnSe IRE. In Fig. 6, the micrographs display Pd/TiO2 catalyst layers of 1.0 mg and 4.0 mg prepared from a 1,4-dioxane slurry and of 2.5 mg prepared from a deionized water slurry. Based on visual inspection, the 1,4-dioxane layer of 0.2 mg cm−2 (1.0 mg catalyst) appeared to be inhomogeneous and of insufficient thickness. While the majority of the glass plate was covered with a thin catalyst layer, there were also isolated thicker sections at the edges and corners. The SEM analysis provided an estimated catalyst layer thickness of about 2 μm without considering the isolated thicker spots. An increase of the area density to 0.8 mg cm−2 (4.0 mg catalyst) yielded a thicker catalyst layer, which appeared to be complete and uniform. The thickness of the catalyst layer varied between 10 ± 5 μm over the entire examined area, thereby ensuring the coverage of the effective penetration depth of approximately 0.6 μm at 2000 cm−1.
While both 1,4-dioxane layers displayed a heterogeneous macrostructure without a perfectly uniform catalyst layer thickness, catalyst layers prepared from a deionized water slurry resulted in a rather inhomogeneous coverage with areas of high thickness (10–30 μm) and nearly blank spots (see image of catalyst layer on the right side of Fig. 6). At an area density of 0.5 mg cm−2 (2.5 mg catalyst) the layer displayed a very broad distribution of thickness. In our experience, deionized water slurries using a supported noble metal catalyst with low noble metal loading such as 5 wt% Pd/TiO2 or 5 wt% Pt/Al2O3 catalyst are more susceptible to perturbations during the evaporation of the slurry solvent. Note that Pd catalyst layers prepared from alcohol or acetone slurries resulted in catalyst samples which were almost completely deactivated in hydrogenation reactions. While we did not investigate the origin of the deactivation in more detail, to extract meaningful information, an a priori evaluation of the catalytic performance of the prepared catalyst sample is indispensable not only for operando but also for in situ characterization. In this study and also in our previous study,52 we have opted for 1,4-dioxane as the solvent of choice for the catalyst layer preparation.
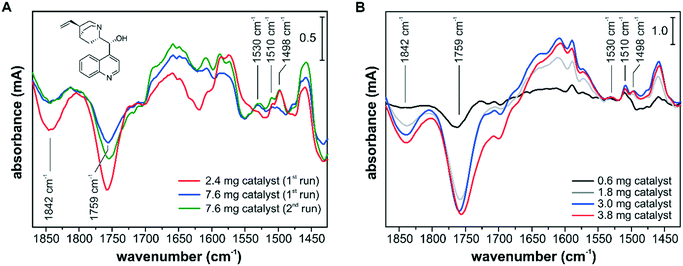
The influence of the catalyst sample preparation on the ATR-IR spectroscopic detection is illustrated in Fig. 7. In several experiments, the adsorption of the chiral modifier cinchonidine (CD) from a 150 μM iPrOH solution onto different Pd/TiO2 layers was monitored. The adsorption of CD can be best followed by the signals at 1498 cm−1, 1510 cm−1 and 1530 cm−1, which belong to the CC stretch vibrations of the quinoline ring of differently bound species. The signals at 1498 cm−1 and 1510 cm−1 originate from chemisorbed CD and weakly bound CD accumulating in the multilayer, respectively.43 The signal at 1530 cm−1 was assigned to a CD species with an abstracted H in α-position to the quinoline N and the formation of such an α-quinolyl species is favored in the absence of hydrogen.53 Adsorption of CD at the Pd–iPrOH interface was also accompanied by the removal of surface species and competitive adsorption to oxo propyl surface species and to 3-fold bound CO species on Pd(111) and can be followed by the signals at 1759 cm−1 and at 1842 cm−1, respectively.54,55
The spectra in Fig. 7A were recorded using the cell with a round inlet and catalyst layers prepared from a water slurry. At a flow rate of 7 mL min−1 the CD-containing solution was recycled and the spectra reflect the changes after 5 min. Using the thinner catalyst layer of 2.4 mg corresponding to an area density of 0.6 mg cm−2, the CD adsorption reached a steady state within the first 5 min. Using the thick catalyst layer of 7.6 mg (2.0 mg cm−2), different adsorption kinetics and surface coverage were monitored and after the first run the catalyst sample was exposed to fresh 150 μM CD solution for an additional 5 min (2nd run). Still, a lower CD surface coverage was observed by ATR-IR spectroscopy, which is clearly seen by the varying amounts of removed oxo propyl and CO species. The spectra in Fig. 7A show not only different band intensities but also different absorption features, e.g. at around 1650 cm−1, 1610 cm−1, 1530 cm−1 and 1498 cm−1, and it appears that different surface processes were detected depending on the chosen conditions. Using a catalyst sample loading of 2.0 mg cm−2, we detected a higher fraction of α-quinolyl CD species and a lower fraction of chemisorbed intact CD. In a recent operando ATR-IR spectroscopy study, we have shown that the signal at 1498 cm−1 correlates well with the observed enantioselectivity.52
The spectra in Fig. 7B were recorded using the cell with a slit inlet and catalyst layers prepared from a dioxane slurry. The catalyst samples of 0.6 mg, 1.8 mg, 3.0 mg and 3.8 mg correspond to area densities of 0.1 mg cm−2, 0.4 mg cm−2, 0.6 mg cm−2, and 0.8 mg cm−2, respectively. With increasing sample loading the signal intensity improved, but all spectra seem to reflect very similar surface processes based on the detected band positions and relative intensities. The optimum in terms of signal intensity and mass transport limitations was achieved at a sample loading of 0.6–0.8 mg cm−2. Comparing the spectra in Fig. 7A and B, the new ATR-IR spectroscopy design, particularly in combination with dioxane-based catalyst layers, provided improved surface sensitivity at the studied catalytic solid–liquid interface. It appears that the ATR-IR spectra can strongly differ depending on the experimental design, and deceiving information about active species might be extracted. For a quantitative comparison between consecutive experiments, the reproducibility of the catalyst samples is critical, which can be challenging if slurry-drop deposition techniques have to be employed. If the effect of varying surface coverage on the catalytic performance is investigated as part of a quantitative operando spectroscopy study,52 the level of reproducibility of the deposited catalyst sample will be reflected in the measured correlation between signal intensity and catalytic performance. As an incomplete coverage of the IRE diminishes the signal intensity and excessive sample loadings lead to detection of surface processes under mass transfer limited conditions, the catalyst sample preparation has to be optimized for an operando ATR-IR spectroscopy characterization. However, other factors such as competitive adsorption on the catalytically inactive support material have to be also taken into account for identifying active surface species.43
To illustrate the effect of catalyst sample loading and mass transport on the operando spectroscopy characterization, the catalytic performance in the asymmetric hydrogenation of PCA on CD-modified Pd/TiO2 catalyst44 was also assessed. Table 1 presents the normalized activity in terms of turnover frequencies (TOFs) for five different catalytic experiments with the slit inlet reactor of 100 μm height and two additional experiments with similar catalyst amounts in a slit inlet reactor of 200 μm height. The TOFs were highly sensitive to the catalyst layer thickness. The effect was particularly reflected in the threefold increase of activity in the transition from a 0.6 mg to a 3.0 mg catalyst layer, that is, for area densities going from 0.1 to 0.6 mg cm−2. Note that the enantiomeric excess (ee) obtained in the PCA hydrogenation displayed a similar trend and tripled upon the five-fold increase of catalyst sample, approaching the literature value obtained with methanol as the solvent.44 Interestingly, the 200 μm reactor with twice the space velocity of the 100 μm reactor displayed a three times smaller activity using a similar catalyst coverage, which again shows the advantage of minimizing the fluid volume.
| Mass catalyst [mg] | 100 μm reactor | 200 μm reactor |
|---|---|---|
| TOF [molproduct molcatalyst-surface−1 h−1] | ||
| 0.6 | 170 (13% ee) | — |
| 1.8 | 350 (34% ee) | — |
| 2.4 | 370 (40% ee) | 111 (41% ee) |
| 3.0–3.3 | 440 (3.0 mg) (45% ee) | 145 (3.3 mg) (45% ee) |
| 3.8 | 430 (43% ee) | — |
Based on the gathered insight into the role of mass transport on the operando spectroscopy characterization, we attempted to further improve the cell design and manufactured a reactor lid of 20 μm height with a slit inlet geometry. The reactor achieved a TOF of only 220 h−1 at a medium catalyst loading of 1.8 mg Pd/TiO2 (area density 0.4 mg cm−2). Contrary to the expectations that a minimal fluid fraction would lead to higher activities, the activity deteriorated rapidly for higher catalyst loadings (TOF of 54 h−1 with 2.8 mg catalyst, area density 0.6 mg cm−2). Abrasion of the catalyst sample was ruled out, but the visual evaluation of the fluid flow with methylene blue provided an important insight into the fluid dynamics of this low-height manufactured cell, revealing severe catalyst-bed bypassing along the O-ring.
3.5. Influence of the flow rate on the operando spectroscopy characterization
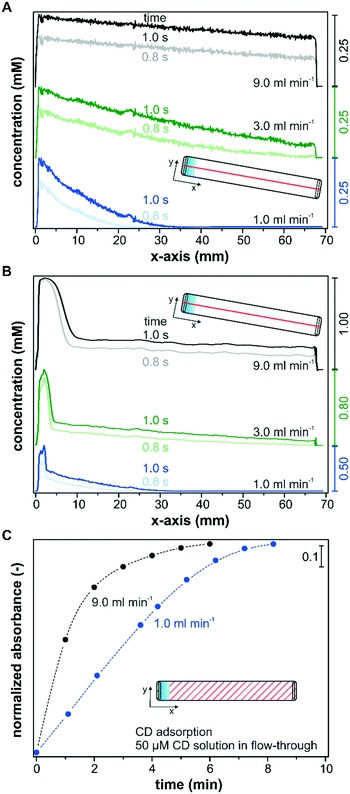
Besides the reactor height and the catalyst layer thickness, advective mass transfer in flow-through reactors can be directly controlled by the set flow rate. Therefore, the fluid velocity is a sensitive operational parameter for controlling the mass transfer and the operando spectroscopy detection. Its influence on the transport of solutes within the catalyst layer is shown in two separate simulation sets that consider only diffusion (Fig. 8A), and advection and diffusion (Fig. 8B) within the catalyst layer. In order to simulate only the diffusion component within the catalyst layer, the velocity profile was set to zero in the porous layer. Fig. 8A and B show the simulated concentration profiles after a concentration step from 0 to 1 mM along the x-axis in a reactor with the slit inlet geometry for flow rates of 1.0, 3.0 and 9.0 ml min−1, respectively. The concentration profiles were taken at the center of the reactor (y = 3.6 mm) within the catalyst layer (z = 5 μm) and are plotted over the entire x-axis. The transient behavior of the concentration profiles depending on the chosen flow rate is illustrated by the profiles at 0.8 s and 1.0 s.For all three flow rates, a decreasing concentration profile along the catalyst bed was found, considering only diffusion in the layer (Fig. 8A). The concentration within the sampling region reached 0.25 mM close to the inlet ports (x = 0.0–5.0 mm) in all three models after 1.0 s, which indicates that the flow rate and the corresponding pressure increase at the inlet had no influence on the detected concentration within the catalyst layer. Nevertheless, these simulations displayed a large influence of the flow rate on the concentration profile within the remaining catalyst layer. The concentration profile simulated for a flow rate of 1 ml min−1 decayed rapidly until x = 35.0 mm, and over roughly half of the reactor length the concentration in the x-direction remained unaffected after 1.0 s. The decrease in concentration when operating at a flow rate of 3 ml min−1 was significantly less pronounced and a concentration of 0.04 mM was reached close to the outlet. For a simulated flow rate of 9 ml min−1 only a small linear decrease in concentration was observed along the reactor and the concentration at the outlet amounted to 0.18 mM. For the modelled system, an average concentration of 0.04 mM, 0.13 mM and 0.21 mM was detected along the x-axis within the IR penetration depth (y = 3.6 mm; z = 5 μm) after 1.0 s at 1 ml min−1, 3 ml min−1 and 9 ml min−1, respectively. These strong deviations can be explained by the larger concentration gradients at the catalyst–liquid interface that drive the transport through the catalyst layer more rapidly.
In Fig. 8B the simulations considering advective transport also within the layer display a sharp increase in the concentration close to the inlet port (x = 0.0–10.0 mm). The reason for this behavior is the pressure exerted on the porous layer by the incoming liquid flow entering a 100 μm reactor with a narrow liquid channel of only 50 μm. Accordingly, this observed effect was more pronounced at increasing fluid flows. After the perturbation in the inlet area the concentration profile was similar to those displayed in Fig. 8A. Therefore, higher volumetric flow rates leading to a fast exchange of the liquid phase decrease concentration gradients along the x-axis, which is beneficial for the detection of active species during operando spectroscopy characterization, but might also lead to higher concentration spikes in the entrance area.
The beneficial effect of higher flow rates on the detection of active species was corroborated experimentally by monitoring the adsorption of CD on Pd/TiO2 at two different flow rates using the slit inlet reactor and thin catalyst layers of area densities between 0.5 and 0.6 mg cm−2. Note that all models assumed no solute adsorption on the porous media, while CD will adsorb on the catalyst during the modification runs. The liquid phase CD concentration within the catalyst layer is therefore reduced at the beginning of the experiment, when the chiral modifier starts adsorbing in the top catalyst layers, and the detection of adsorbed CD within the penetration depth is delayed. Fig. 8C depicts the time-dependent adsorption of CD from a 50 μM solution in continuous operation until saturation of the surface using a flow rate of 1.0 mL min−1 and 9.0 mL min−1. The saturation of the surface was followed by the signal at 1759 cm−1 (compare Fig. 7). For the sake of comparison, the beginning of the monitored CD adsorption was set to zero upon the first spectroscopic detection to exclude the time delays connected to the different transport rates through the tubing into the reactor cell. At a flow rate of 9.0 ml min−1 a rapid increase in CD adsorption was monitored, which reached over 80% of the maximum coverage within 2 minutes. In contrast, the detected kinetics of adsorption were delayed at a flow rate of 1.0 ml min−1, and despite the thin nature of the catalyst layer, accumulation of 80% CD species required 2 additional minutes. Considering the small reactor volume of 49 μL, the delay cannot originate from the difference in space-time, which was 2.9 s and 0.3 s at a flow rate of 1.0 ml min−1 and 9.0 ml min−1, respectively. Instead, the concentration gradients connected to the operated flow rate have to contribute to the observed differences at the solid–liquid interface.
3.6. Influence of porosity and diffusivity on transport phenomena
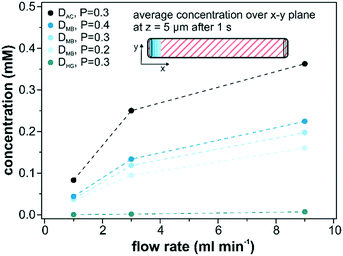
The influence of the diffusion coefficient on the mass transport through the catalyst layer was assessed by repeating the computational simulations with the values for acetonitrile (DAC = 1.26 × 10⁻⁵ cm2 s−1)56 and for hemoglobin (DHG = 6.7 × 10⁻⁷ cm2 s−1)57 in water as high and low diffusing solutes, respectively. In addition, we also evaluated the average detected surface concentration depending on the employed porosity (0.2, 0.3 and 0.4) of the catalyst layer as shown in Fig. 9. These simulations consider only diffusion within the catalyst layer. The most crucial parameter to achieve higher average concentrations is an increase in volumetric flow rate. Adjusting the flow rate from 1 ml min−1 to 9 ml min−1 resulted in a 4 times higher average catalyst layer concentration. A further rise in the flow rate leads to even higher concentrations and would ultimately approach 1 for extremely high flow rates. However, these values are not feasible under experimental conditions as catalyst abrasion will occur at higher flow rates and the onset of catalyst abrasion has to be evaluated beforehand. When increasing the diffusion coefficient of hemoglobin to acetonitrile (factor of 20), an increase of the surface concentration within the catalyst layer (z = 5 μm) by a factor of 53 was observed. The influence of the porosity on the detected concentration was smaller than for the diffusivity factor. It increased by 40% as the porosity was doubled from 0.2 to 0.4.4. Conclusions
The experimental and computational investigation of various flow-through reactor cells and operational parameters unveiled sensitive design aspects for achieving a uniform and fast mass transport within flow-through spectroscopy reactors. In particular, it was shown that a slit inlet port provides a uniform flow profile across the x–y plane, which is mapped onto the sample layer, providing improved sample-average data. In the context of operando spectroscopy characterization, the properties of the catalyst sample were discussed and the sample-dependent surface-sensitive detection was linked to the observed catalytic performance. Mass transport considerations are particularly critical if the catalytic systems can suffer from side reactions. It was demonstrated that insufficient mass transfer within the catalyst layer can lead to misleading adsorption kinetics and is reflected in the detected surface processes. The selective detection of active species in ATR-IR spectroscopy cells is therefore dependent on sufficient mass transfer, which can be adjusted by tuning several parameters. These findings are of general validity for monitoring the catalytic solid–liquid interface using flow-through spectroscopy cells, but specific reaction systems should be assessed regarding those parameters independently. Our presented design principles are particularly important for concentration modulation experiments. As exemplified for ATR-IR spectroscopy flow-through reactors in this study, mass transport simulations can provide a valuable and inexpensive insight, which is not easily accessible with experimental techniques and may help to overcome current limitations concerning the acquisition of sample-average data.Conflicts of interest
The authors declare no competing financial interests.Acknowledgements
We kindly acknowledge the support from Dr. Frank Krumeich (ETH Zürich) with the SEM measurements.References
- M. Lämmerhofer, J. Chromatogr. A, 2010, 1217, 814–856 CrossRef PubMed.
- A. Rimola, D. Costa, M. Sodupe, J.-F. Lambert and P. Ugliengo, Chem. Rev., 2013, 113, 4216–4313 CrossRef CAS PubMed.
- A. Corma, S. Iborra and A. Velty, Chem. Rev., 2007, 107, 2411–2502 CrossRef CAS PubMed.
- P. Gallezot, Chem. Soc. Rev., 2012, 41, 1538–1558 RSC.
- H.-U. Blaser, C. Malan, B. Pugin, F. Spindler, H. Steiner and M. Studer, Adv. Synth. Catal., 2003, 345, 103–151 CrossRef CAS.
- J. J. Pignatello, E. Oliveros and A. MacKay, Crit. Rev. Environ. Sci. Technol., 2006, 36, 1–84 CrossRef CAS.
- B. C. H. Steele and A. Heinzel, Nature, 2001, 414, 345–352 CrossRef CAS PubMed.
- M. R. Brindza and R. A. Walker, J. Am. Chem. Soc., 2009, 131, 6207–6214 CrossRef CAS PubMed.
- U. K. Singh and M. A. Vannice, Appl. Catal., A, 2001, 213, 1–24 CrossRef CAS.
- D. Y. Murzin, P. Mäki-Arvela, E. Toukoniitty and T. Salmi, Catal. Rev.: Sci. Eng., 2005, 47, 175–256 CAS.
- C. Sievers, Y. Noda, L. Qi, E. M. Albuquerque, R. M. Rioux and S. L. Scott, ACS Catal., 2016, 6, 8286–8307 CrossRef CAS.
- I. Ortiz-Hernandez and C. T. Williams, Langmuir, 2003, 19, 2956–2962 CrossRef CAS.
- A. J. Foster and R. F. Lobo, Chem. Soc. Rev., 2010, 39, 4783–4793 RSC.
- J.-M. Andanson and A. Baiker, Chem. Soc. Rev., 2010, 39, 4571–4584 RSC.
- A. Urakawa, Curr. Opin. Chem. Eng., 2016, 12, 31–36 CrossRef.
- A. Chakrabarti, M. E. Ford, D. Gregory, R. Hu, C. J. Keturakis, S. Lwin, Y. Tang, Z. Yang, M. Zhu, M. A. Bañares and I. E. Wachs, Catal. Today, 2017, 283, 27–53 CrossRef CAS.
- F. Zaera, Chem. Rev., 2012, 112, 2920–2986 CrossRef CAS PubMed.
- F. C. Meunier, Chem. Soc. Rev., 2010, 39, 4602–4614 RSC.
- B. M. Weckhuysen, Chem. Commun., 2002, 97–110 RSC.
- F. Meemken, P. Müller, K. Hungerbühler and A. Baiker, Rev. Sci. Instrum., 2014, 85, 17 Search PubMed.
- H. L. Wang, A. Sapi, C. M. Thompson, F. D. Liu, D. Zherebetskyy, J. M. Krier, L. M. Carl, X. J. Cai, L. W. Wang and G. A. Somorjai, J. Am. Chem. Soc., 2014, 136, 10515–10520 CrossRef CAS PubMed.
- S. L. Guan, O. Donovan-Sheppard, C. Reece, D. J. Willock, A. J. Wain and G. A. Attard, ACS Catal., 2016, 6, 1822–1832 CrossRef CAS.
- N. J. Harrick, Internal Reflection Spectroscopy, Interscience Publishers, 1967 Search PubMed.
- N. E. Tsakoumis, A. P. E. York, D. Chen and M. Ronning, Catal. Sci. Technol., 2015, 5, 4859–4883 CAS.
- F. Meemken and A. Baiker, Chem. Rev., 2017, 117, 11522–11569 CrossRef CAS PubMed.
- H. Daly, H. G. Manyar, R. Morgan, J. M. Thompson, J. J. Delgado, R. Burch and C. Hardacre, ACS Catal., 2014, 4, 2470–2478 CrossRef CAS.
- A. Aguirre, C. L. A. Berli and S. E. Collins, Catal. Today, 2017, 283, 127–133 CrossRef CAS.
- M. Zhang, M. de Respinis and H. Frei, Nat. Chem., 2014, 6, 362–367 CrossRef CAS PubMed.
- M. Kennema, I. B. D. de Castro, F. Meemken and R. Rinaldi, ACS Catal., 2017, 7, 2437–2445 CrossRef CAS.
- K. Koichumanova, A. Visan, B. Geerdink, R. G. H. Lammertink, B. L. Mojet, K. Seshan and L. Lefferts, Catal. Today, 2017, 283, 185–194 CrossRef CAS.
- J. R. Copeland, G. S. Foo, L. A. Harrison and C. Sievers, Catal. Today, 2013, 205, 49–59 CrossRef CAS.
- R. He, R. R. Davda and J. A. Dumesic, J. Phys. Chem. B, 2005, 109, 2810–2820 CrossRef CAS PubMed.
- T. Bürgi and A. Baiker, in Advances in Catalysis, ed. B. C. Gates and H. Knozinger, Elsevier Academic Press Inc, San Diego, 2006, vol. 50, pp. 227–283 Search PubMed.
- A. Aguirre, P. A. Kler, C. L. A. Berli and S. E. Collins, Chem. Eng. J., 2014, 243, 197–206 CrossRef CAS.
- A. Urakawa, R. Wirz, T. Bürgi and A. Baiker, J. Phys. Chem. B, 2003, 107, 13061–13068 CrossRef CAS.
- B. L. Mojet, S. D. Ebbesen and L. Lefferts, Chem. Soc. Rev., 2010, 39, 4643–4655 RSC.
- P. Müller and L. Hermans, Ind. Eng. Chem. Res., 2017, 56, 1123–1136 CrossRef.
- A. Urakawa, T. Bürgi and A. Baiker, Chem. Eng. Sci., 2008, 63, 4902–4909 CrossRef CAS.
- V. Marchionni, D. Ferri, O. Kröcher and A. Wokaun, Anal. Chem., 2017, 89, 5801–5809 CrossRef CAS PubMed.
- S. A. Tromp, G. Mul, Y. Zhang-Steenwinkel, M. T. Kreutzer and J. A. Moulijn, Catal. Today, 2007, 126, 184–190 CrossRef CAS.
- M. Bieri and T. Bürgi, J. Phys. Chem. B, 2005, 109, 10243–10250 CrossRef CAS PubMed.
- K. F. Jensen, Chem. Eng. Sci., 2001, 56, 293–303 CrossRef CAS.
- L. Rodríguez-García, K. Hungerbühler, A. Baiker and F. Meemken, Catal. Today, 2017, 283, 66–73 CrossRef.
- Y. Nitta, Chem. Lett., 1999, 635–636 CrossRef CAS.
- W. R. Huck, T. Mallat and A. Baiker, Catal. Lett., 2002, 80, 87–92 CrossRef CAS.
- A. Perro, G. Lebourdon, S. Henry, S. Lecomte, L. Servant and S. Marre, React. Chem. Eng., 2016, 1, 577–594 CAS.
- K. L. Kostka, M. D. Radcliffe and E. Von Meerwall, J. Phys. Chem., 1992, 96, 2289–2292 CrossRef CAS.
- H. B. Jang, H. S. Rho, J. S. Oh, E. H. Nam, S. E. Park, H. Y. Bae and C. E. Song, Org. Biomol. Chem., 2010, 8, 3918–3922 CAS.
- R. J. Millington and J. P. Quirk, Trans. Faraday Soc., 1961, 57, 1200–1207 RSC.
- C. Keresszegi, D. Ferri, T. Mallat and A. Baiker, J. Catal., 2005, 234, 64–75 CrossRef CAS.
- O. Levenspiel, Chemical Reaction Engineering, Wiley, 3rd edn, 1999 Search PubMed.
- L. Rodríguez-García, K. Hungerbühler, A. Baiker and F. Meemken, ACS Catal., 2017, 7, 3799–3809 CrossRef.
- D. Ferri and T. Bürgi, J. Am. Chem. Soc., 2001, 123, 12074–12084 CrossRef CAS PubMed.
- K. H. Dostert, C. P. O'Brien, F. Ivars-Barcelo, S. Schauermann and H. J. Freund, J. Am. Chem. Soc., 2015, 137, 13496–13502 CrossRef CAS PubMed.
- A. M. Bradshaw and F. M. Hoffmann, Surf. Sci., 1978, 72, 513–535 CrossRef CAS.
- J. R. Rumble, CRC Handbook of Chemistry and Physics, CRC Press/Taylor & Francis, Boca Raton, FL, 98th Edition (Internet Version 2018), 2018 Search PubMed.
- W. Moll and H. Voss, Respir. Physiol., 1966, 1, 357–365 CrossRef CAS PubMed.
| This journal is © The Royal Society of Chemistry 2018 |

