 Open Access Article
A urinary metabolomics (GC-MS) strategy to evaluate the antidepressant-like effect of chlorogenic acid in adrenocorticotropic hormone-treated rats†
Le Zhao‡
 a,
Zixu Zhang‡ad,
Mingmei Zhou
 *af,
Xiaojun Gou*b,
Yang Zengef,
Jing Songa,
Weini Maa and
Ying Xu
 c
c
aCenter for Chinese Medicine Therapy and Systems Biology, Shanghai University of Traditional Chinese Medicine, 1200 Cailun Road, Pudong District, Shanghai 201203, China. E-mail: zhoumm368@163.com; Fax: +86 21 51322642; Tel: +86 21 51322642
bCentral Laboratory, Baoshan District Hospital of Integrated Traditional Chinese and Western Medicine of Shanghai, Shanghai University of Traditional Chinese Medicine, Shanghai 201999, China. E-mail: gouxiaojun1975@163.com; Fax: +86 21 36072150; Tel: +86 21 56601100
cDepartment of Physiology, Shanghai University of Traditional Chinese Medicine, Shanghai 201203, China
dCollege of Chinese Pharmacy, Shanghai University of Traditional Chinese Medicine, Shanghai 201203, China
eCollege of Life Science, Qinghai Normal University, Xining, Qinghai 810008, China
fKey Laboratory of Medicinal Animal and Plant Resources in Qinghai-Tibet Plateau, Xining, Qinghai 810008, China
First published on 1st March 2018
Abstract
Major depressive disorder (MDD) is a chronic recurring illness that seriously affects human health. Chlorogenic acid (CGA), an important polyphenol extracted from Eucommia ulmoides Oliver bark, has been reported to have anti-depression, neuroprotection, memory improvement and other pharmacological effects. However, little is known about the underlying mechanisms of CGA on the treatment of depression. Here, we investigated the antidepressant-like effects of CGA on an adrenocorticotropic hormone (ACTH)-treated rat model. Thirty-two male Wistar rats were randomly divided into four groups: normal diet group (N), ACTH-treated model group (M), memantine positive control group (M + Mem) and CGA intervened group (M + CGA). Sucrose preference tests (SPTs) and open-field tests (OFTs) were performed to evaluate depressive-like behaviors. Memantine (30 mg kg−1) and CGA (500 mg kg−1) administration dramatically increased hedonic behaviors of the rats in SPT. The scores of crossing and rearing were significantly increased in the M + Mem group and M + CGA group. These results of the behaviour tests might be suggestive of antidepressant-like effects. Moreover, memantine and CGA reversed the levels of serum 5-hydroxytryptamine (5-HT), ACTH, corticotropin-releasing hormone (CRH), and dopamine (DA) that were altered in ACTH-treated rats. Based on a GC-MS metabolomic approach, significant differences in the metabolic profile were observed in ACTH-treated rats compared with the control group, as well as the M + CGA group and M + Mem group compared with the ACTH-treated group. A total of 19 metabolites were identified for the discrimination of normal rats and ACTH-treated rats, and 12 out of 19 differential metabolites were reversed with CGA intervention. Combined with pattern recognition and bioinformatics, nine perturbed metabolic pathways, including energy metabolism, neurotransmitter metabolism, and amino acid metabolism, were identified based on these metabolites. These integrative studies might give a holistic insight into the pathophysiological mechanism of the ACTH-treated depressive rat model, and also showed that CGA has antidepressant-like activities in ACTH-treated rats, providing an important drug candidate for the prevention and treatment of tricyclic anti-depressant treatment-resistant depression.
Introduction
Depression is a severe psychiatric and mental illness with a rapid growth rate. Up to 30–40% of depressive patients do not respond to treatment with the existing antidepressants,1 and people undergoing antidepressant treatment may confront a delayed onset of therapeutic effects, high recurrence, and side effects.2,3 Therefore the demand space for new effective antidepressants is very impressive. Chinese medicine is thought to be an effective way to find new antidepressants.4 Chlorogenic acid (3-O-caffeoylquinic acid, CGA) is not only a key constituent of coffee, which is considered as a beneficial substance for depression as its properties of anti-inflammatory and antioxidant,5–7 but also an important active ingredient of many traditional Chinese medicines, like Eucommiae cortex (Duzhong), honeysuckle flower (Jinyinhua), etc. Studies have shown that CGA could reduce the production of a variety of pro-inflammatory cytokines, which is consistent with the neuroinflammatory hypotheses of depression and the effects of current antidepressant therapies.5–8 It was reported that CGA could promote 5-HT release through enhancing synapsin I expression, and orally administration of CGA-enriched extract of Eucommia ulmoides Oliver (200, 400 mg per kg per day) on mice for 7 days showed antidepressant-like effects in tail suspension test (TST).9,10 Furthermore, according to a report of Park,11 CGA isolated from Artemisia capillaris Thunb was showed antidepressant-like activity in mice with chronically restraint stress in forced swimming test (FST) and TST. It was indicated that CGA could cross the blood-cerebrospinal fluid barrier to display its neuron protection,10 and even so, the anti-depressant efficacy of CGA is not certain.The hypothalamic-pituitary-adrenal (HPA) axis is a major integrated system that maintains body homeostasis, which controls the stress responses of an individual.12 Stress triggers the release of corticotropin-releasing hormone (CRH), accompanied by that of adrenocorticotropic hormone (ACTH), and causes serotonergic system changes, such as increasing of the expression of 5-hydroxytryptamine (5-HT)2A receptors.13,14 Chronically administrated ACTH increased the expression of 5-HT2A receptor mRNA in the frontal cortex of rats,15 as well as blocked the antidepressant effects of the tricyclic anti-depressants (imipramine), the noradrenaline reuptake inhibitor (desipramine), and the serotonin and noradrenaline reuptake inhibitor on the immobility time of FST (milnacipran).16,17 Therefore, ACTH-treated rats might serve as an animal model of tricyclic anti-depressant treatment-resistant depression. Chronic ACTH-treatment (100 μg per rat per day, s.c., for 14 days) induced depressive-like behaviors in FST and open field test (OFT), which could be blocked by memantine (3,5-dimethyladamantan-1-amine, 10 mg kg−1, i.p.),18 a non-competitive NMDA receptor antagonist. Therefore, memantine was chose as positive control in this study.
Nowadays, metabolomics approach is a widely used tool for the discovery of biomarkers for disease diagnosis or prognosis. As to depression studies, metabolomics offers mechanistic insights into the potential pathophysiological features and assessments of the therapeutic effects of antidepressants.19–26 Gas chromatography-mass spectrometry (GC-MS) has been widely applied in metabolomics studies as for its high sensitivity, high resolution and high reproducibility.22,23,25,26
In the present study, we firstly investigated whether CGA has antidepressant-like effects on chronic ACTH-treated rats using sucrose preference test (SPT) and OFT. Secondly, non-target urinary metabolomic strategy based on GC-MS detection was applied on the profiling of global metabolomic character of ACTH-treated rats as well as ACTH-treated rats administrated with memantine and CGA. Finally, combined with pattern recognition and bioinformatics analysis methods, differential metabolites among each group and related possible metabolic pathways or biomarkers were illustrated. Our studies would provide new insights in the biology and pathology of depression disease, and also assess the antidepressant-like effects of CGA on tricyclic anti-depressant treatment-resistant rat model as well as obtain its potential therapeutic targets for future studies of the underlying biological mechanisms.
Experimental procedures
Animal model and behavioral tests
32 male Wistar rats (Shanghai Sippr-BK laboratory animal Co. Ltd., China) of 10 weeks weighs 230–250 g were randomly divided into control (Normal diet, N, n = 8) group and ACTH-treated group (n = 24) after one-week's adaption. The rats were kept in a standard laboratory environment with free access to food and water (23 °C, 12 h daylight cycles, and 55 ± 15% humidity). All the procedures dealing with the animals in this study were performed in accordance with the Guidelines for Care and Use of Laboratory Animals of Shanghai University of Traditional Chinese Medicine and approved by the Animal Ethics Committee of Shanghai.ACTH-treated rats were assigned randomly into 3 groups (n = 8), ACTH-treated model group (M), positive control group (memantine, M + Mem) and CGA intervened group (M + CGA). Each rat in these three groups received s.c. injection of ACTH (Chengdu Kaijie Peptide Co., Chengdu, China) at a dose of 100 μg per rat for 14 days, and saline control group (N) received saline injection of same volume for 14 days. CGA intervened rats received CGA (cas: 327-97-9, purity ≥ 98%, HPLC method, extracted from Eucommia ulmoides Oliver bark, Sichuan Weikeqi Bio-tech Co. Ltd., Sichuan, China) i.g. at dose of 500 mg kg−1, and memantine positive control group rats received memantine (Mem, Sigma, USA) i.g. at dose of 30 mg kg−1, saline control group and ACTH-treated model group received saline i.g. in same volume. For SPT,27,28 rats were first trained to adapt 1% (v/v) sucrose solution kept in two bottles in each cage for 72 h on day 15th–17th. Then rats were deprived of water and food for a further 24 h. Finally, rats were housed in individual cages with free access to two bottles containing 100 mL of sucrose solution (1% w/v) and water, and the volume of sucrose solution and water consumed within 1 hour was recorded. Sucrose preference was calculated as follows: sucrose consumption (%) = sucrose consumption/(water + sucrose consumption) × 100. OFT as employed previously was used to define locomotor activity and evaluate the exploratory activity of animal on day 14th.27 Open field arena used was an acrylic box (77 cm × 77 cm × 40 cm) with the floor divided into 49 equal squares. Scores of crossing, rearing, and grooming were counted in a 6 min session. The box was cleaned with 10% ethanol between trials. After the last test, all rats were put into metabolic cages for 12 h urine sample collection, and then sacrificed by chloral hydrate (300 mg kg−1 bodyweight, i.p.) anaesthesia for abdominal aorta blood collection. Blood samples were centrifuged at 3000 × g and 4 °C for 15 min, and the urine samples were centrifuged at 1500 × g for 5 min. The supernatant was collected and stored at −80 °C for later analysis.
Serum biochemical analysis
Serum samples obtained from rats of four groups were measured for 5-HT, ACTH, CRH, dopamine (DA). These parameters were quantified using the corresponding commercial kits according to manufacturer's protocols (Cusabio Biotechnology Co., Ltd, Wuhan, China).Metabolomics analysis
Urine samples were prepared for GC-MS analysis and relevant spectral acquisitions were performed according to our previously published methods with minor modifications.29,30 After being centrifuged at 12![[thin space (1/6-em)]](https://www.rsc.org/images/entities/char_2009.gif) 000 rpm for 10 min, 100 μL supernatant was extracted from urine sample. The degradation of urea was carried out by adding 70 IU urease (37 °C, 15 min). The sample was derivatized with ethyl chloroformate, and L-2-chlorophenylalanine was used as an internal standard to maintain batch reproducibility. The sample analysis was carried out with GC-TOFMS (Pegasus HT, Leco Corp., St. Joseph, MI; electron ionization mode). One QC sample and one blank vial were run after each 10 samples. One-μL aliquot of analyte was injected with a splitless mode into DB-5MS capillary column coated with 5% diphenyl cross-linked 95% dimethylpolysiloxane (30 m × 250 μm i.d., 0.25 m film; Agilent J&W Scientific, Folsom, CA) for sample separation with helium as the carrier gas at constant flow rate of 1.0 mL min−1. The temperature of injection, transfer interface, and ion source was maintained at 270, 260, and 200 °C, respectively. Temperature programming for GC was set to 2 min isothermal heating at 80 °C, followed by 10 °C min−1 oven temperature ramp to 180 °C, 5 °C min−1 to 240 °C, and 25 °C min−1 to 290 °C, and a final 9 min maintained temperature at 290 °C. Electron impact ionization (70 eV) at full scan mode (m/z 30–600) was used, with an acquisition rate of 20 spectra per s in TOFMS setting.
000 rpm for 10 min, 100 μL supernatant was extracted from urine sample. The degradation of urea was carried out by adding 70 IU urease (37 °C, 15 min). The sample was derivatized with ethyl chloroformate, and L-2-chlorophenylalanine was used as an internal standard to maintain batch reproducibility. The sample analysis was carried out with GC-TOFMS (Pegasus HT, Leco Corp., St. Joseph, MI; electron ionization mode). One QC sample and one blank vial were run after each 10 samples. One-μL aliquot of analyte was injected with a splitless mode into DB-5MS capillary column coated with 5% diphenyl cross-linked 95% dimethylpolysiloxane (30 m × 250 μm i.d., 0.25 m film; Agilent J&W Scientific, Folsom, CA) for sample separation with helium as the carrier gas at constant flow rate of 1.0 mL min−1. The temperature of injection, transfer interface, and ion source was maintained at 270, 260, and 200 °C, respectively. Temperature programming for GC was set to 2 min isothermal heating at 80 °C, followed by 10 °C min−1 oven temperature ramp to 180 °C, 5 °C min−1 to 240 °C, and 25 °C min−1 to 290 °C, and a final 9 min maintained temperature at 290 °C. Electron impact ionization (70 eV) at full scan mode (m/z 30–600) was used, with an acquisition rate of 20 spectra per s in TOFMS setting.
The peak information acquired from GC-TOFMS analysis was exported in NetCDF format by ChromaTOF software (v4.44, Leco Co., Los Angeles, CA), and further pretreated by R-2.13.2 (Lucent Technologies). The final data matrix was constructed with normalized peak areas with two vectors: sample names as observations in the first column, and retention times/peaks as the response variables in the first row.31 Principal component analysis (PCA)32 and partial least squares projection to latent structures and discriminant analysis (PLS-DA)33 were employed to process the acquired three-dimensional matrix for multivariate analysis with SIMCA-P 11 software (Umetrics, Umeå, Sweden). Samples from the same groups were classified into one for PLS-DA modeling. The results of PCA and PLS-DA were displayed as scores plots that visualized the clustering of the samples and indicated the similarity of samples. The closer clustering of the samples represented higher compositional similarity, whereas the further clustering represented diverse metabolomic composition. The purpose of PLS-DA was to calculate models differentiating groups and identify the response variables contributing most to the model and further identify potential markers. Orthogonal projection to latent structure with discriminant analysis (OPLS-DA) was used for predicting or evaluating variations in frame areas between groups. The corresponding V-plot has been established and the Variable Importance Parameter (VIP) values summarized the overall contribution of each X-variable to the model.34,35
Statistical analysis
SPSS 16.0 was used to analysis the data from behavioral tests. All values are expressed as the mean ± standard errors of the mean (SEM). Statistical significance among the groups was conducted by one-way analysis of variance (ANOVA). In all cases, probability values of less than 0.05 were considered to show a statistical significance. Statistical analyses were performed using Graphpad Prism 6.0 (GraphPad Software Inc., USA).Results
Behavioral analysis
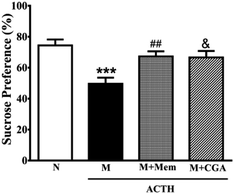
To investigate the effects of CGA on ACTH-treated rats, we performed SPT (Fig. 1) and OFT (Fig. 2). In general, SPT has been used to evaluate stress-induced anhedonia.36 A lower percentage of sucrose preference was observed in M group when compared with N group (Fig. 1, P < 0.001). After drug treatments, sucrose preference dramatically increased in M + Mem (P < 0.01) and M + CGA group (Fig. 1, P < 0.05). The scores of crossing, rearing, and grooming were presented in Fig. 2. As expected, M group significantly decreased the scores of crossing (P < 0.01), rearing (P < 0.001), and grooming (P < 0.001), when compared with N group. M + Mem group enhanced the scores of crossing (P < 0.05), rearing (P < 0.01), and grooming (P < 0.05). The administration of CGA 500 mg kg−1 for 14 days increased the scores of crossing (P < 0.05), rearing (P < 0.05), but showed no effect on the scores of grooming (Fig. 2).The effect of CGA on serum biochemical parameters
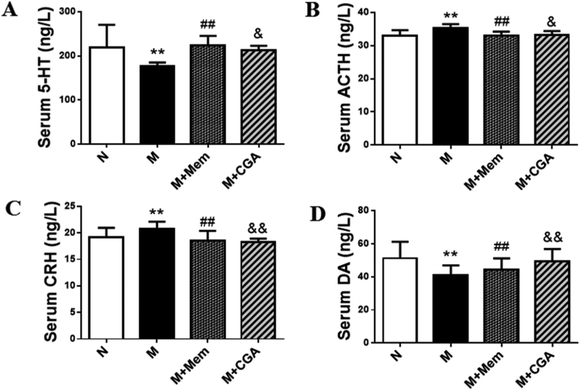
Serum biochemical parameters of 5-HT, ACTH, CRH, DA were presented in Fig. 3. The serum concentrations of 5-HT and DA were significantly decreased (P < 0.01), while the levels of ACTH and CRH were elevated in M group as compared to N group (P < 0.01). After the treatment of CGA, the levels of 5-HT (P < 0.05) and DA (P < 0.01) were dramatically increased, along with the inhibited levels of ACTH (P < 0.05) and CRH (P < 0.01) in ACTH-treated rats.Multivariate statistical analysis
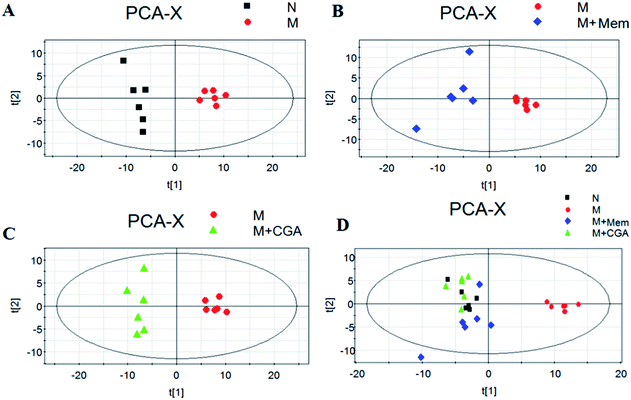
In order to evaluate the effects of CGA on ACTH-induced depressant rat model, PCA and PLS-DA models were constructed to analyze the data obtained from GC-MS detection (Fig. 4 and S1†). The PCA score plots demonstrated significant differences between N and M groups (R2X = 0.667, Q2 (cum) = 0.466; Fig. 4A and Table S1†), M and M + Mem groups (R2X = 0.645, Q2 (cum) = 0.347; Fig. 4B), M and M + CGA groups (R2X = 0.68, Q2 (cum) = 0.466; Fig. 4C). Comparisons among the four groups were also performed using PCA and shown in Fig. 4D. N group was completely separated from M group, while M + Mem and M + CGA groups were all settled around N group. Then, PLS-DA was carried out to maximize the difference of metabolic profiles among the four groups (Fig. S1†). The scores plot from PLS-DA model showed a clear separation between N and M groups (R2X = 0.646, R2Y = 0.988, Q2 (cum) = 0.955; Fig. S1A and Table S1†), M and M + Mem groups (R2X = 0.705, R2Y = 0.998, Q2 (cum) = 0.998; Fig. S1B and Table S1†), M and M + CGA groups (R2X = 0.622, R2Y = 0.995, Q2 (cum) = 0.967; Fig. S1C and Table S1†), indicating that CGA exerts effect on metabolism of ACTH-induced depressant rats. The parameters of R2X and Q2 were employed for evaluation of PCA model, as well as R2X, R2Y and Q2 (cum) were used for evaluation of PLS-DA model. R2X and R2Y were usually used to quantify the goodness-of-fit of model and Q2Y was employed to assess model predictability.37 Generally, the values of R2Y and Q2 above 0.8 were considered as excellent models. According to the parameters (R2X, R2Y and Q2) shown in ESI Table S1,† the PLS-DA model was positive and valid.Key metabolites analysis
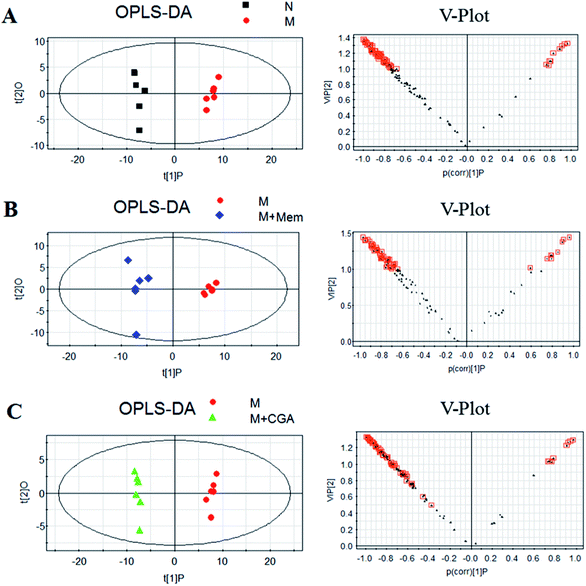
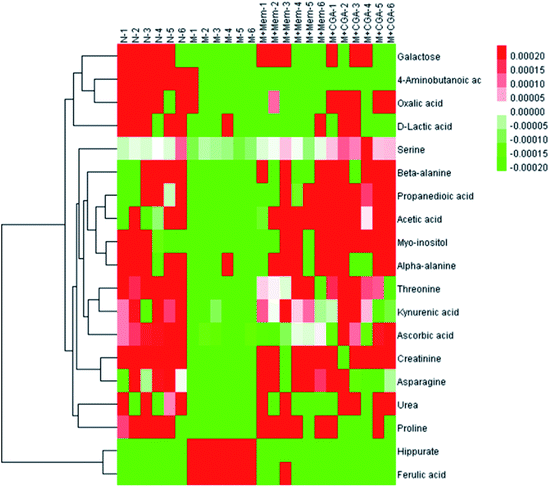
In order to find the changed metabolites in urine samples between N and M groups, M and M + Mem groups, M and M + CGA groups, the supervised OPLS-DA and corresponding V-plot were constructed (Fig. 5). Variable importance for the projection (VIP) values exceeding 1.0 were calculated and subsequently analyzed by paired t-test analysis (Table S2†). The metabolites in the level of significance difference (P < 0.05) were considered as potential biomarkers, which were responsible for the difference between N and M group. A total of nineteen metabolites were identified as potential biomarkers for chronically ACTH-induced depression. The heat map of differential metabolites was showed in Fig. 7, in which the relative changes of these metabolites might be readily observed. The results showed that the decreased levels of alanine (beta-alanine), propanedioic acid, threonine, serine, galactose, myo-inositol, D-lactic acid, acetic acid, urea, creatinine, proline, asparagine, kynurenic acid, along with the increased levels of hippurate and ferulic acid in M group compared with N group (Table S2;† Fig. 7). The levels of beta-alanine, propanedioic acid, threonine, serine, myo-inositol, acetic acid, creatinine, alanine, kynurenic acid were increased while hippurate and ferulic acid were decreased after Mem or CGA treatment, and these altered metabolites could be associated with the antidepressant effect of CGA (Table S2;† Fig. 7).Metabolic pathway analysis
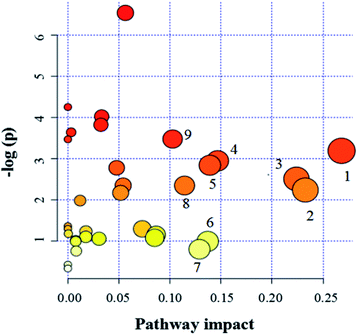
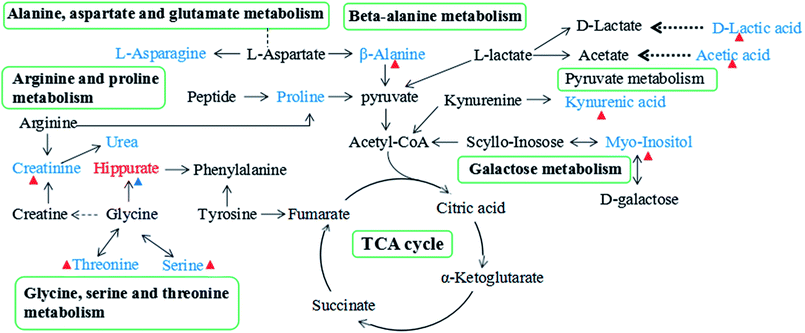
Since enzymes or metabolites involved in the same biological processes are often changed together,38 Pathway-based metabolomics features are analogues of metabolomics biomarkers that provide more information on biological functions.39 Based on the overall 19 biomarkers identified from M versus N groups, MetaboAnalyst 3.0 was used to identify perturbed metabolic pathways (Table 1 and Fig. 6).40 Kyoto Encyclopedia of Genes and Genomes (KEGG; http://www.genome.jp/kegg/) and Human Metabolome Database (HMDB; http://www.hmdb.ca/) were used for confirmation. The results showed that there were nine dramatically affected metabolic pathways (impact value > 0.10), including beta-alanine metabolism, glycine, serine and threonine metabolism, galactose metabolism, pyruvate metabolism, arginine and proline metabolism, inositol phosphate metabolism, glyoxylate and dicarboxylate metabolism, ascorbate and aldarate metabolism, alanine, aspartate and glutamate metabolism and other metabolic pathways (Nod color and size are indicative of P-value significance and pathway impact, respectively, Fig. 6). Based on the relationships among the metabolic biomarkers, we summarized the pathways into a brief plot that contained most of the altered metabolites (Fig. 8).| Metabolic pathways | Metabolites | M vs. N | M + Mem vs. M | M + CGA vs. M |
|---|---|---|---|---|
| a These metabolites are verified by reference compounds available. The short dash line (–) indicates no significant variation. The arrow denotes the VIP value greater than 1.0 and the up- (or down-) regulation of the arrow represents the relative increased (or decreased) concentration. | ||||
| Beta-alanine metabolism | Beta-alanine | ↓ | ↑ | ↑ |
| Beta-alanine metabolism | Propanedioic acid | ↓ | ↑ | ↑ |
| Glycine, serine and threonine metabolism | Threonine | ↓ | ↑ | ↑ |
| Glycine, serine and threonine metabolism | Serine | ↓ | ↑ | ↑ |
| Galactose metabolism | Galactose | ↓ | – | – |
| Galactose metabolism | Myo-inositol | ↓ | ↑ | ↑ |
| Pyruvate metabolism | D-Lactic acid | ↓ | – | – |
| Pyruvate metabolism | Acetic acid | ↓ | ↑ | ↑ |
| Arginine and proline metabolism | Urea | ↓ | – | – |
| Arginine and proline metabolism | Creatinine | ↓ | ↑ | ↑ |
| Arginine and proline metabolism | Proline | ↓ | ↑ | – |
| Inositol phosphate metabolism | Myo-inositol | ↓ | ↑ | ↑ |
| Ascorbate and aldarate metabolism | Myo-inositol | ↓ | ↑ | ↑ |
| Alanine, aspartate and glutamate metabolism | Asparagine | ↓ | ↑ | – |
| Alanine, aspartate and glutamate metabolism | Alanine | ↓ | ↑ | ↑ |
| Other | Kynurenic acid | ↓ | ↑ | ↑ |
| Other | Hippurate | ↑ | ↓ | ↓ |
Discussion
Several previous studies have confirmed that chronic treatment of ACTH could induce depression-like behaviour.17,41 In the present study, the OFT and SPT were measured during the experimental period to evaluate the antidepressant-like effect of CGA in the ACTH-induced depression model. The results showed that Mem and CGA exerted antidepressant-like effects on SPT and OFT in ACTH-treated rats. In addition, ACTH-induced depressive rats showed a lower level of 5-HT and DA, as well as a higher level of ACTH and CRH. As a consequence of CGA treatment, changes in the levels of 5-HT, ACTH, CRH, and DA indicated alterations in the HPA axis function.42 Urinary samples are more convenient for collecting when compared with blood samples, especially for small animals. Furthermore, noninvasive sampling could avoid interference in the neuropsychological activities of animals. Most important of all, they present the combination of metabolites in a period of time (e.g. 24 h), while the biomarkers in blood have a relatively shorter window period.43 So far, urine has been widely used in animal or human metabolomics studies to diagnose disease and serve as an early warning in preclinical stages.44–47 Therefore, our study employed GC-MS-based metabolomics to study the urinary metabolic phenotypes between normal and depressed rats and identify the potential biomarkers. The concentrations of the endogenous metabolites, alanine, propanedioic acid, threonine, serine, myoinositol, acetic acid, creatinine, hippurate, ferulic acid, and kynurenic acid were dramatically changed after the treatment of CGA in ACTH-induced depressant rats' urine. These metabolites might be the biomarkers related to the efficacy of CGA.Serum biochemical parameters analysis
Serotonin (5-HT) has been reported to play a vital role in the pathogenesis of depression.48 5-HT, monoamine neurotransmitter metabolites existed in the hippocampus, showed a significant lower level in M group compared with N group. Decreased 5-HT level is associated with the development of depression. Furthermore, our study also found that CGA could significantly improve 5-HT level in serum. The serum ACTH level was markedly increased in M group. It was reported that rats treated with ACTH could be served as an animal model of depression.16 After the treatment of Mem and CGA, the level of ACTH was significantly decreased. CRH has been reported to be related to increase depressive symptoms.49 The lower levels of CRH in M + Mem and M + CGA group might be related to the alleviation of depression. The interaction of DA with the limbic system is likely to be associated with stress and depression.50 The monoamine theory assumes that depression is related to low levels of monoamine neurotransmitters, especially 5-HT and dopamine.51 Compared with M group, our results showed that DA content was higher in M + Mem and M + CGA group. In conclusion, these results suggest that the changes in the ACTH-induced depressive rats might play a specific role in the development of depression. Mem and CGA treatments could reverse the changes in ACTH-treated rats and exert antidepressant-like effects.Changes in energy metabolism
Beta-alanine metabolism might be one of the most affected metabolic pathways. Compared with N group, levels of beta-alanine and propanedioic acid were all decreased in M group. Asparagine and alanine involved in the pathway of alanine, aspartate and glutamate metabolism might be tightly related with the depression. Aspartate and alpha-alanine were significantly decreased in urine samples from depressive rats compared with N group, while only alanine was significantly reversed after CGA treatment.Alanine, a nonessential amino acid, is one of the most crucial amino acids released by muscle.52 Meanwhile, it is an inhibitory neurotransmitter in the brain and an important participant and regulator in glucose metabolism.53 As a major energy source, alanine might enter tricarboxylic acid (TCA) cycle and glucose in gluconeogenesis.54 β-alanine, probably as a neuromodulator, occurs naturally in the human central nervous system (CNS).55 β-alanine plays an essential role in β-alanine metabolism pathway, which are tightly associated with the genes of hormones, cytokines and neurotransmitters.56 Aspartate, derived from the TCA cycle, is involved in energy production. Alanine and aspartate have a great impact on alanine, aspartate and glutamate metabolism pathway. The relatively higher level of alanine in the urine of CGA-treated ACTH-induced depressive rats might be related to the promotion of alanine metabolism for energy supply.
Amino acid metabolism
Proline, a precursor of pyruvate, is widely distributed in the CNS.60 The higher level of proline in M + Mem group than in M group indicated that Mem might activate the biosynthesis of pyruvate. The lower level of proline in M group might be involved in the pathogenesis of ACTH-induced depression. Creatinine, a nonenzymatic breakdown product creatine phosphate, is crucial for cellular energy transportation.61 The decreased level of creatinine in M group might indicate altered energy metabolism. Energy deficiency is one of the most commonly represented depressive symptoms in major depressive disorder.62 The content of creatinine was dramatically increased after the treatment of CGA and it would be helpful in evaluating the efficacy of CGA on the treatment of depression.
Our work found that serine and threonine played vital roles in the pathway of glycine, serine and threonine metabolism and were markedly decreased in M group compared with N group. Serine and threonine, belonging to the amino acids, were closely related to potential anti-oxidation. Additionally, compared to M group, the contents of serine and threonine were elevated in M + Mem and M + CGA, which might be a factor associated with the treatment of depression.
Hippurate, a common component of urine and an acyl glycine, is the metabolite of phenylalanine produced by combinatorial metabolism between the host and the gut microbiome.66 The significantly changed hippurate level after CGA treatment suggested that CGA might affect depression through the combinatorial metabolism between the host and the gut microbiome.
In all, CGA produces an antidepressant-like effect in chronic ACTH-treated rats by regulating nine perturbed metabolic pathways and their related metabolites.
Conclusion
As a brain disorder formed by the interaction of diversely heterogeneous pathogenic mechanisms, depression is now recognized as a systemic disease. Metabolomics is a powerful tool to study the mechanism of disease from a holistic perspective. In this study, differences between normal and chronic ACTH-treated rats were observed in behavioural and metabolic patterns. With global urinary metabolomics analysis method as our previously studies,29,30 19 differential metabolites were identified in ACTH-treated rats. Meanwhile, 12 out of 19 differential metabolites were reversed with CGA intervention. Furthermore, combined with pattern recognition and bioinformatics analysis, nine metabolic pathways were identified as perturbed metabolic pathways. These results would be helpful in understanding the pathophysiological mechanism of chronic ACTH-induced rat depressant model, and evaluating the efficacy of CGA on the treatment of depression. In conclusion, our work shows that metabolomics method combined with pattern recognition and network analysis is a promising strategy to explore the pathophysiological mechanism of depression, and evaluate the intervention of xenobiotics.Conflicts of interest
The authors declare that they have no competing interests.Abbreviations
| ACTH: | Adrenocorticotropic hormone |
| CGA: | Chlorogenic acid |
| CRH: | Corticotropin-releasing hormone |
| DA: | Dopamine |
| FST: | Forced swimming test |
| GC/MS: | Gas chromatography coupled to mass spectrometry |
| HPA: | Hypothalamic-pituitary-adrenal |
| MDD: | Major depressive disorder |
| OFT: | Open field test |
| OPLS-DA: | Orthogonal projections to latent structures discriminant analysis |
| PCA: | Principal component analysis |
| PLS-DA: | Partial least squares discriminate analysis |
| SPT: | Sucrose preference test |
| TCA: | Tricarboxylic acid |
| TST: | Tail suspension test |
| 5-HT: | 5-Hydroxytryptamine |
Acknowledgements
This study was financially supported by National Natural Science Foundation of China (No. 81473475), the innovation project of Shanghai University of TCM (No. ZYX-CXYJ-018), Shanghai Municipal Education Committee (No. 2013JW17), Key Laboratory of Medicinal Animal and Plant Resources in Qinghai-Tibet Plateau, Xining, Qinghai, China (No. 2017-z-y25), and further accelerating the development of Chinese medicine three-year action plan of Shanghai (2014–2016) (No: ZY3-RCPY-3-1013).References
- H. A. Sackeim, J. Clin. Psychiatry, 2001, 62(suppl. 16), 10–17 CAS.
- H. Jick, J. A. Kaye and S. S. Jick, J. Am. Med. Assoc, 2004, 292(3), 338–343 CrossRef CAS PubMed.
- S. Maeng and C. A. Jr Zarate, Curr. Psychiatry Rep., 2007, 9(6), 467–474 CrossRef PubMed.
- J. Gong, F. Yin, Y. Hou and Y. Yin, Can. J. Anim. Sci., 2014, 94, 223–241 CrossRef.
- S. Hall, B. Desbrow, S. Anoopkumar-Dukie, A. K. Davey, D. Arora, C. McDermott, M. M. Schubert, A. V. Perkins, M. J. Kiefel and G. D. Grant, Food Res. Int., 2015, 76, 626–636 CrossRef CAS PubMed.
- Z. Ruan, S. M. Mi, L. L. Zhou, Y. Zhou, J. Li, W. H. Liu and Z. Y. Deng, J. Funct. Foods, 2016, 26, 698–708 CrossRef CAS.
- Y. Zhou, Z. Ruan, L. Zhou, X. Shu, X. Sun, S. Mi, Y. Yang and Y. Yin, Biochem. Biophys. Res. Commun., 2016, 469(4), 1083–1089 CrossRef CAS PubMed.
- W. Shen, R. Qi, J. Zhang, Z. Wang, H. Wang, C. Hu, Y. Zhao, M. Bie, Y. Wang, Y. Fu, M. Chen and D. Lu, Brain Res. Bull., 2012, 88(5), 487–494 CrossRef CAS PubMed.
- Y. Zhou, Z. Ruan, X. L. Li, S. M. Mi, M. Jiang, W. H. Liu, H. S. Yang, X. Wu, G. L. Jiang and Y. L. Yin, J. Anim. Sci., 2016, 94, 164–168 CrossRef CAS.
- J. Wu, H. Chen, H. Li, Y. Tang, L. Yang, S. Cao and D. Qin, Molecules, 2016, 21(3), 260 CrossRef PubMed.
- S. Park, Y. Sima and P. Hanb, Anim. Cells Syst., 2010, 14, 253–259 CrossRef CAS.
- N. Hohne, M. Poidinger, F. Merz, H. Pfister, T. Brückl, P. Zimmermann, M. Uhr, F. Holsboer and M. Ising, Biol. Psychol., 2014, 103, 267–275 CrossRef PubMed.
- B. E. Leonard, Eur. Psychiatry, 2005,(suppl. 3), S302–S306 CrossRef CAS.
- G. N. Pandey, Y. Dwivedi, H. S. Rizavi, X. Ren, S. C. Pandey, C. Pesold, R. C. Roberts, R. R. Conley and C. A. Tamminga, Am. J. Psychiatry, 2002, 159(3), 419–429 CrossRef PubMed.
- Y. Kitamura, Y. Fujitani, K. Kitagawa, T. Miyazaki, H. Sagara, H. Kawasaki, K. Shibata, T. Sendo and Y. Gomita, Biol. Pharm. Bull., 2008, 31(2), 246–249 CAS.
- Y. Kitamura, H. Araki and Y. Gomita, Pharmacol., Biochem. Behav., 2002, 71(1–2), 63–69 CrossRef CAS.
- K. Kawaura, Y. Ogata, S. Honda, F. Soeda, T. Shirasaki and K. Takahama, Behav. Brain Res., 2016, 302, 269–278 CrossRef CAS PubMed.
- K. Tokita, Y. Fujita, T. Yamaji and K. Hashimoto, Pharmacol., Biochem. Behav., 2012, 102(2), 329–334 CrossRef CAS PubMed.
- S. Bai, C. Zhou, P. Cheng, Y. Fu, L. Fang, W. Huang, J. Yu, W. Shao, X. Wang, M. Liu, J. Zhou and P. Xie, Int. J. Mol. Sci., 2015, 16(4), 8490–8504 CrossRef CAS PubMed.
- P. Zheng, Y. Wang, L. Chen, D. Yang, H. Meng, D. Zhou, J. Zhong, Y. Lei, N. D. Melgiri and P. Xie, Mol. Cell. Proteomics, 2013, 12(1), 207–214 Search PubMed.
- L. Liu, X. Zhou, Y. Zhang, Y. Liu, L. Yang, J. Pu, D. Zhu, C. Zhou and P. Xie, Behav. Brain Res., 2016, 305, 148–156 CrossRef CAS PubMed.
- G. Chen, D. Yang, Y. Yang, J. Li, K. Cheng, G. Tang, R. Zhang, J. Zhou, W. Li, Z. Liu, S. Fan and P. Xie, Behav. Brain Res., 2015, 278, 286–292 CrossRef CAS PubMed.
- X. Liu, P. Zheng, X. Zhao, Y. Zhang, C. Hu, J. Li, J. Zhao, J. Zhou, P. Xie and G. Xu, J. Proteome Res., 2015, 14(5), 2322–2330 CrossRef CAS PubMed.
- J. Chen, C. Zhou, P. Zheng, K. Cheng, H. Wang, J. Li, L. Zeng and P. Xie, Behav. Brain Res., 2017, 332, 280–287 CrossRef CAS PubMed.
- P. Zheng, Z. Fang, X. J. Xu, M. L Liu, X. Du, X. Zhang, H. Wang, J. Zhou and P. Xie, J. Affective Disord., 2016, 195, 75–81 CrossRef CAS PubMed.
- X. Zhou, L. Liu, Y. Zhang, J. Pu, L. Yang, C. Zhou, S. Yuan, H. Zhang and P. Xie, Neuroscience, 2017, 343, 1–9 CrossRef CAS PubMed.
- P. Willner, R. Muscat and M. Papp, Neurosci. Biobehav. Rev., 1992, 16(4), 525–534 CrossRef CAS PubMed.
- Q. Q. Mao, Z. Huang, S. P. Ip, Y. F. Xian and C. T. Che, Behav. Brain Res., 2012, 227(1), 305–309 CrossRef CAS PubMed.
- X. Wang, C. Zeng, J. Lin, T. Chen, T. Zhao, Z. Jia, X. Xie, Y. Qiu, M. Su, T. Jiang, M. Zhou, A. Zhao and W. Jia, J. Proteome Res., 2012, 11(12), 6223–6230 CrossRef CAS PubMed.
- X. Wang, T. Zhao, Y. Qiu, M. Su, T. Jiang, M. Zhou, A. Zhao and W. Jia, J. Proteome Res., 2009, 8(5), 2511–2518 CrossRef CAS PubMed.
- M. Li, X. Wang, J. Aa, W. Qin, W. Zha, Y. Ge, L. Liu, T. Zheng, B. Cao, J. Shi, C. Zhao, X. Wang, X. Yu, G. Wang and Z. Liu, Am. J. Physiol., 2013, 304(11), F1317–F1324 CrossRef CAS PubMed.
- Q. He, X. Kong, G. Wu, P. Ren, H. Tang, F. Hao, R. Huang, T. Li, B. Tan, P. Li, Z. Tang, Y. Yin and Y. Wu, Amino Acids, 2009, 37(1), 199–208 CrossRef CAS PubMed.
- Q. He, P. Ren, X. Kong, W. Xu, H. Tang, Y. Yin and Y. Wang, Mol. BioSyst., 2011, 7(7), 2147–2155 RSC.
- Q. He, H. Tang, P. Ren, X. Kong, G. Wu, Y. Yin and Y. Wang, J. Proteome Res., 2011, 10(11), 5214–5221 CrossRef CAS PubMed.
- H. Blasco, J. Błaszczyński, J. C. Billaut, L. Nadal-Desbarats, P. F. Pradat, D. Devos, C. Moreau, C. R. Andres, P. Emond, P. Corcia and R. Słowiński, J. Biomed. Inf., 2015, 53, 291–299 CrossRef CAS PubMed.
- P. Willner, A. Towell, D. Sampson, S. Sophokleous and R. Muscat, Psychopharmacology, 1987, 93(3), 358–364 CrossRef CAS PubMed.
- S. Mahadevan, S. L. Shah, T. J. Marrie and C. M. Slupsky, Anal. Chem., 2008, 80(19), 7562–7570 CrossRef CAS PubMed.
- F. Zhang and G. Du, World J. Biol. Chem., 2012, 3(8), 167–174 CrossRef PubMed.
- S. Huang, N. Chong, N. E. Lewis, W. Jia, G. Xie and L. X. Garmire, Genome Med., 2016, 8(2), 34 CrossRef PubMed.
- X. Wang, A. Zhang, G. Yan, W. Sun, Y. Han and H. Sun, PLoS One, 2013, 8(8), e71403 CAS.
- T. Iwai, T. Ohnuki, S. Sasaki-Hamada, A. Saitoh, A. Sugiyama and J. Oka, Behav. Brain Res., 2013, 243, 153–157 CrossRef CAS PubMed.
- B. Li, K. Suemaru, Y. Kitamura, Y. Gomita, H. Araki and R. Cui, J. Biochem. Mol. Toxicol., 2013, 27(11), 486–491 CrossRef CAS PubMed.
- J. Wu and Y. H. Gao, Expert Rev. Proteomics, 2015, 12(6), 623–636 CrossRef CAS PubMed.
- M. A. Farag, N. M. Ammar, T. E. Kholeif, N. S. Metwally, N. M. El-Sheikh, L. A. Wessjohann and A. Z. Abdel-Hamid, Food Funct., 2017, 8(3), 985–996 CAS.
- D. Yang, X. Wang, Y. Wu, B. Lu, A. Yuan, C. Leon and N. Guo, Molecules, 2015, 20(7), 11915–11929 CrossRef CAS PubMed.
- P. Elliott, J. M. Posma, Q. Chanx, I. Garcia-Perez, A. Wijeyesekera, M. Bictash, T. M. Ebbels, H. Ueshima, L. Zhao, L. van Horn, M. Daviglus, J. Stamler, E. Holmes and J. K. Nicholson, Sci. Transl. Med., 2015, 7(285), 285–262 Search PubMed.
- A. Noto, G. Pomero, M. Mussap, L. Barberini, C. Fattuoni, F. Palmas, C. Dalmazzo, A. Delogu, A. Dessì, V. Fanos and P. Gancia, Ann. Transl. Med., 2016, 4(21), 417 CrossRef PubMed.
- M. J. Owens and C. B. Nemeroff, Clin. Biochem., 1994, 40(2), 288–295 CAS.
- R. P. Waters, M. Rivalan, D. A. Bangasser, J. M. Deussing, M. Ising, S. K. Wood, F. Holsboer and C. H. Summers, Neurosci. Biobehav. Rev., 2015, 58, 63–78 CrossRef CAS PubMed.
- S. Cabib and S. Puglisi-Allegra, Psychopharmacology1, 1996, 128(4), 331–342 CrossRef CAS.
- V. Krishnan and E. J. Nestler, Nature, 2008, 455(7215), 894–902 CrossRef CAS PubMed.
- R. Odessey, E. A. Khairallah and A. L. Goldberg, J. Biol. Chem., 1974, 249(23), 7623–7629 CAS.
- A. Zinellu, S. Sotgia, L. Deiana and C. Carru, Methods Mol. Biol., 2013, 919, 35–42 CAS.
- J. S. Tian, G. J. Peng, Y. F. Wu, J. J. Zhou, H. Xiang, X. X. Gao, Y. Z. Zhou, X. M. Qin and G. H. Du, J. Chromatogr. B: Anal. Technol. Biomed. Life Sci., 2016, 1026, 227–235 CrossRef CAS PubMed.
- K. E. Tiedje, K. Stevens, S. Barnes and D. F. Weaver, Neurochem. Int., 2010, 57(3), 177–188 CrossRef CAS PubMed.
- J. Décombaz, M. Beaumont, J. Vuichoud, F. Bouisset and T. Stellingwerff, Amino Acids, 2012, 43(1), 67–76 CrossRef PubMed.
- E. Martin, R. E. Rosenthal and G. Fiskum, J. Neurosci. Res., 2005, 79(1–2), 240–247 CrossRef CAS PubMed.
- B. Z. Li and Y. J. Yuan, Appl. Microbiol. Biotechnol., 2010, 86(6), 1915–1924 CrossRef CAS PubMed.
- S. J. Elferink, J. Krooneman, J. C. Gottschal, S. F. Spoelstra, F. Faber and F. Driehuis, Appl. Environ. Microbiol., 2001, 67(1), 125–132 CrossRef CAS PubMed.
- M. Hauptmann, D. F. Wilson and M. Erecinska, FEBS Lett., 1983, 161(2), 301–305 CrossRef CAS PubMed.
- J. S. Tian, B. Y. Shi, H. Xiang, S. Gao, X. M. Qin and G. H. Du, PLoS One, 2013, 8(9), e75721 CAS.
- X. X. Gao, J. Cui, X. Y. Zheng, Z. Y. Li, Y. H. Choi, Y. Z. Zhou, J. S. Tian, J. Xing, X. J. Tan, G. H. Du and X. M. Qin, Phytother. Res., 2013, 27(7), 1074–1085 CrossRef PubMed.
- U. E. Lang, C. Beglinger, N. Schweinfurth, M. Walter and S. Borgwardt, Cell. Physiol. Biochem., 2015, 37(3), 1029–1043 CrossRef CAS PubMed.
- J. Lu, Y. L. Zheng, D. M. Wu, L. Luo, D. X. Sun and Q. Shan, Biochem. Pharmacol., 2007, 74(7), 1078–1090 CrossRef CAS PubMed.
- A. Yildiz-Yesiloglu and D. P. Ankerst, Prog. Neuro-Psychopharmacol. Biol. Psychiatry, 2006, 30(6), 969–995 CrossRef CAS PubMed.
- I. K. Yap, I. J. Brown, Q. Chan, A. Wijeyesekera, I. Garcia-Perez, M. Bictash, R. L. Loo, M. Chadeau-Hyam, T. Ebbels, M. I. De, E. Maibaum, L. Zhao, H. Kesteloot, M. L. Daviglus, J. Stamler, J. K. Nicholson, P. Elliott and E. Holmes, J. Proteome Res., 2010, 9(12), 6647–6654 CrossRef CAS PubMed.
Footnotes |
| † Electronic supplementary information (ESI) available. See DOI: 10.1039/c8ra00074c |
| ‡ Le Zhao and Zixu Zhang are co-first authors. |
| This journal is © The Royal Society of Chemistry 2018 |

