DOI:
10.1039/C7RA13636F
(Paper)
RSC Adv., 2018,
8, 9651-9660
High-resolution X-ray diffraction determination of the electron density of 1-(8-PhSC10H6)SS(C10H6SPh-8′)-1′ with the QTAIM approach: evidence for S4 σ(4c–6e) at the naphthalene peri-positions†
Received
25th December 2017
, Accepted 20th February 2018
First published on 5th March 2018
Abstract
An extended hypervalent S4 σ(4c–6e) system was confirmed for the linear BS-∗-AS-∗-AS-∗-BS interaction in 1-(8-PhBSC10H6)AS–AS(C10H6BSPh-8′)-1′ (1) via high-resolution X-ray diffraction determination of electron densities. The presence of bond critical points (BCPs; ∗) on the bond paths confirms the nature and extent of this interaction. The recently developed QTAIM dual functional analysis (QTAIM-DFA) approach was also applied to elucidate the nature of the interaction. Total electron energy densities Hb(rc) were plotted versus Hb(rc) − Vb(rc)/2 for the interaction at the BCPs, where Vb(rc) represents the potential energy densities at the BCP. The results indicate that although the data for an interaction in the fully optimized structure corresponds to a static nature, the data obtained for the perturbed structures around it represent the dynamic nature of the interaction in QTAIM-DFA. The former classifies the interaction and the latter characterises it. Although AS-∗-AS in 1 is classified by a shared shell interaction and exhibits weak covalent character, AS-∗-BS is characterized as having typical hydrogen-bond nature with covalent properties in the region of the regular closed shell interactions. The experimental results are supported by matching theoretical calculations throughout, particularly for the extended hypervalent E4 σ(4c–6e) (E = S) interaction.
Introduction
Recent research in our laboratory has been concerned with linear σ-type interactions higher than σ(3c–4e), which is the classical three-center four-electron σ type bonds/interactions.1 We refer to such interactions as extended hypervalent σ(mc–ne) (4 ≤ m; m < n < 2m).2–7 The σ(4c–6e) interaction is the first to be studied. AE2BE2 σ(4c–6e) was first recognized for the linear alignments of four BE⋯AE–AE⋯BE atoms in the structures of bis[8-(phenylchalcogena)naphthyl]-1,1′-dichalcogenide [1-(8-PhBEC10H6)AE–AE(C10H6BEPh-8′)-1′ (AE, BE) = (S, S: 1),3 (S, Se: 2),4 (Se, S: 3)4 and (Se, Se: 4)2] as determined by X-ray crystallographic analysis (see Fig. 2 for the structure of 1 (S, S) determined by the high-resolution X-ray crystallographic analysis). Scheme 1 illustrates the structures of 1–4. A substantial number of compounds containing the σ(4c–6e) interaction have been reported.6,8,9 Benzene substituents in the 1,2-positions, naphthalene substituents in the 1,8-positions and related systems serve as good spacers for the formation of these interactions.2–4,10–12 It has been strongly suggested that σ(4c–6e) interactions play an important role in the development of high functionalities in materials and also in key processes of biological and/or pharmaceutical activities.2–4,6–12
 |
| | Scheme 1 Structures of 1–4. | |
Fig. 1 shows the molecular orbitals of E4 σ(4c–6e), which is exemplified in the case of Cl42− (E = Cl). The central AE–AE distance in BE⋯AE–AE⋯BE should be shorter than the AE⋯BE distances in σ(4c–6e) even if AE = BE. This expectation is supported by the optimized structure of E42− (E = Cl) (Fig. 1). Charge transfer (CT) of the np(BE)→σ∗(AE–AE)←np(BE) type is the driving force for the formation of AE2BE2 σ(4c–6e), where np(BE) represents the p-type lone pair orbitals of BE with σ∗(AE–AE) for the σ∗ orbital of AE–AE. The high accepting ability of σ∗(AE–AE) and the high donating ability of np(BE) plays an important role in the formation of the linear interaction. The nature of AE2BE2 σ(4c–6e) is well established theoretically. The dynamic and static nature of AE2BE2 σ(4c–6e) is elucidated for 1-(8-MeBEC10H6)AE–AE(C10H6BEMe-8′)-1′: (AE, BE) = (S, S: 5), (S, Se: 6), (Se, S: 7) and (Se, Se: 8), after preparation and structural determination of 8.13 The static nature of AE2BE2 σ(4c–6e) has also been reported for 1–4 based on the observed crystal structures.13–16 AE2BE2 σ(4c–6e) are also recognized as a form of chalcogen bonding.17
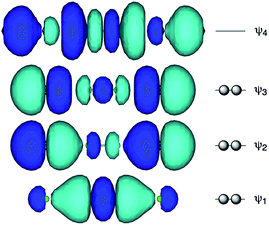 |
| | Fig. 1 Approximate MO model for E4 σ(4c–6e) exemplified by Cl42− (E = Cl). | |
 |
| | Fig. 2 Structure of 1 (S, S) determined by high-resolution X-ray crystallographic analysis. | |
Thus, the question of how the nature of AE2BE2 σ(4c–6e) can be established experimentally arises. The high-resolution X-ray diffraction determination of electron densities of 1 (S, S) would provide a firm basis for the real existence of S4 σ(4c–6e) in 1 (S, S). The quantum theory of atoms-in-molecules dual functional analysis (QTAIM-DFA), which we proposed recently,18–22 will support the experimental results by elucidating the dynamic and static nature of S4 σ(4c–6e) from the observed and/or optimized structures of 1 (S, S). It will be easily understood if the interactions can be defined by the corresponding bond paths (BPs) in QTAIM, but we must carefully use the correct terminology with the concept.23 A basis set system that reproduces the observed structural parameters, particularly for the AE⋯BE distances, r(AE⋯BE), must be established.
Therefore, this paper is concerned with the observation of the existence of S4 σ(4c–6e) in 1 (S, S) based on the data obtained from high-resolution X-ray diffraction determination of electron densities. The real existence of S4 σ(4c–6e) in 1 (S, S) was confirmed by theoretically elucidating the nature of S4 σ(4c–6e) with QTAIM-DFA. The nature of the interactions was determined by employing the criteria proposed previously when applying QTAIM-DFA to typical chemical bonds and interactions. QTAIM-DFA and the criteria are explained in the ESI in Scheme S1 and S2, Fig. S1 and eqn (S1)–(S6).† The basic concept of the QTAIM approach introduced by Bader24–26 is also surveyed, which enables us to analyze the nature of chemical bonds and interactions.27–33
Experimental
Bis[8-(phenylthio)naphthyl]-1,1′-disulfide (1 (S, S))
Compound 1 (S, S) was obtained via the reaction of the naphtho[1,8-c,d]-1,2-dithiolate dianion3,4 with excess benzenediazonium chloride in aqueous THF at 2–4 °C. After standard workup, the solution was chromatographed on silica gel containing acidic alumina. Recrystallization from the solvent mixed with hexane and dichloromethane afforded 1 (S, S) as yellow prisms in 68% yield, mp 169.8–170.6 °C. 1H NMR (CDCl3/TMS, 400 MHz) δ 7.02 (dd, J = 1.2 and 8.3 Hz, 4H), 7.12 (t, J = 7.7 Hz, 4H), 7.21 (t, J = 7.3 Hz, 4H), 7.45 (t, J = 7.6 Hz, 2H), 7.63 (dd, J = 1.0 and 8.1 Hz, 2H), 7.68 (dd, J = 1.1 and 7.6 Hz, 2H), 7.85 (dd, J = 1.4 and 7.2 Hz, 2H), 7.90 (dd, J = 1.3 and 8.2 Hz, 2H); 13C NMR (CDCl3/TMS, 75.5 MHz) δ 125.5, 125.8, 125.8, 126.2, 127.1, 127.4, 128.4, 128.9, 131.4, 133.8, 134.5, 136.4, 138.5 and 139.9 (see Fig. S2 and S3 of the ESI† for 1H and 13C NMR spectra, respectively). Anal. Calcd for C32H22S4: C, 71.87; H, 4.15. Found: C, 71.58; H, 4.24.
High-resolution X-ray crystallographic measurement of 1 (S, S)
Single crystal high-resolution data (sin(θ/λmax) = 1.08 Å−1) were collected at 100(2) K on a Rigaku FRE+ equipped with VHF Varimax confocal mirrors, an AFC10 goniometer and an HG Saturn724+ detector using Mo-Kα radiation (λ = 0.71075 Å). The Crystal Clear 3.1 software34 was used for data collection and CrysAlisPro35 for data reduction and Gaussian absorption correction. SORTAV36 was used to average and merge the sets of intensities. The crystallographic CIF file (CCDC-1811040) is provided in the ESI.†
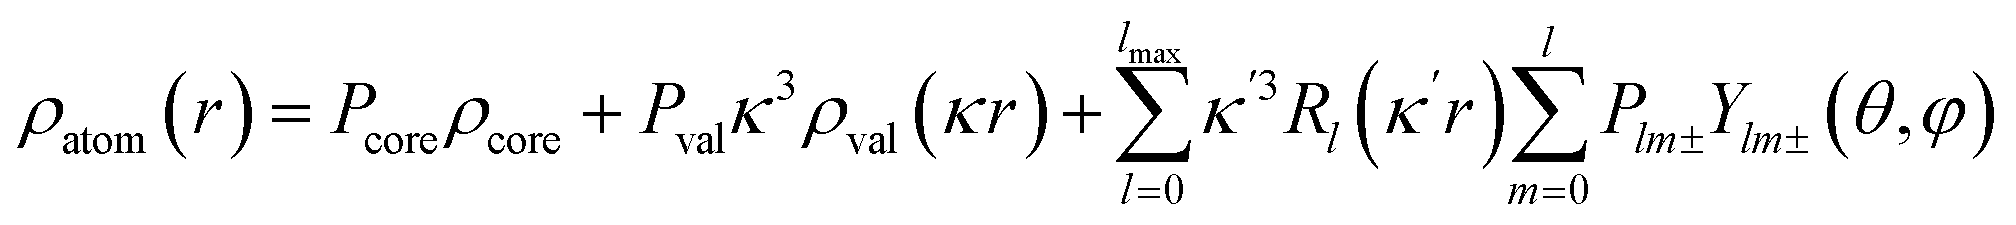
The crystal structure was solved using direct methods and least-squares independent atom refinement (IAM) was carried out with the SHELX-2014 (ref. 37) software package. All non-hydrogen atoms were refined with anisotropic displacement parameters, while all hydrogen atoms were calculated at theoretical positions with Uiso = 1.2 (see Fig. 2 for the crystal structure of 1 (S, S) and the crystal data and refinement details in Table S1 of the ESI†). This model served as the initial point for the aspherical atom refinement, which was implemented using the Hansen–Coppens formalism38 as implemented in the XD2016 program.39 According to this formalism, electron density in a crystal is divided into three components as expressed in eqn (1):
| |
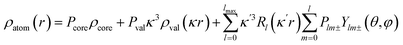 | (1) |
where, the first term is the spherically averaged free-atom Hartree–Fock core contribution,
ρcore, with population parameter
Pc. The second term is the spherically averaged free atom Hartree–Fock normalized to one electron valence contribution,
ρvalence, with population parameter
Pv, modified by the expansion/contraction parameter
κ. The third term represents the deviation of the valence density from spherical symmetry modified by the expansion/contraction parameter
κ′. The deformation is expressed by a density normalized Slater-type radial function

modulated by the density normalized, real spherical harmonics angular functions
dlm±(
r/
r) defined on local axes centered on the atoms and with population parameters
Plm±.
| |
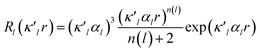 | (2) |
 is given by eqn (2), where n(l) ≥ 1 obeys Poisson's electrostatic equation and values for αl are estimated from the Hartree–Fock optimized single-ξ exponents of the valence orbital wave function calculated for free atoms. Scattering factors for C, H and S were derived from the wave functions tabulated by Clementi and Roetti.40 As shown in the literature, the use of default values of n(l) = (4,4,4,4) and αl for second-row atoms (P, S) may lead to ambiguous results.38,41 Thus, several models described previously42,43 were tested and finally n(l) = (4,4,6,8) values were used. An identical set of n(l) was used to refine the experimental data of another hypervalent sulfur-nitrogen species44,45 as well as in experimental studies of L-cysteine.46 The αl parameter was kept constant at 3.851ao−1.47 Initially, only the scale factor was refined for all data. Next, accurate positional and displacement parameters for all non-hydrogen atoms were obtained from the high order refinement (sin(θ/λ) > 0.7 Å−1), while positional and isotropic displacements for hydrogen atoms were refined using low-angle data (sin(θ/λ) < 0.7 Å−1). Due to the unavailability of neutron data, all C–H distances were fixed to the averaged distances from neutron studies48 (e.g., dCarom–H = 1.083 Å). During the next stages of refinement, monopole, dipole, quadrupole, octupole and hexadecapole populations were refined with the single expansion/contraction κ parameter in a stepwise manner. The expansions over the spherical harmonics were truncated at the hexadecapolar level [lmax = 4] for the sulfur-bonded atoms (AS, BS, Ci, ⋯) and at the octupolar level [lmax = 3] for the remaining carbon. Hydrogen atoms were represented by the bond directed dipole. Finally, a single κ′ parameter was refined for all non-hydrogen atoms. Chemically and symmetry related atoms were constrained to share the same expansion/contraction (κ/κ′) parameters. Throughout, the multipole refinement expansion/contraction parameters (κ/κ′) of all hydrogen atoms were fixed to values κ = 1.20 and κ′ = 1.20. This procedure was repeated several times in a block refinement until satisfactory convergence was achieved. Chemical constraints for similar atoms were applied at the initial stages of the refinements. These constraints were gradually released and the final model was chemically unconstrained. The electron neutrality condition was imposed on the molecule for the entire refinement. Final multipole refinement led to a featureless residual density map (Fig. S4 in the ESI†). The overall residual density after multipole refinement with all high order data was −0.24 ≤ ∇2 and ρ ≤ 0.25 e Å−3.
The multipolar refinement details are shown in Table S1 in the ESI.† For further details, see Table S2 in the ESI.†
Methodological details used for calculations
Calculations were performed using the Gaussian 09 program package.49 Compound 1 (S, S) was optimized with the 6-311+G(d) basis set for S and the 6-31G(d,p) basis sets for C and H. Herein, we refer to this basis set system as A (BSS-A). The Møller–Plesset second order energy correlation (MP2) level was applied to the calculations.50 The structural parameters optimized with MP2/BSS-A (r(AS, AS) = 2.0730 Å and r(AS, BS) = 2.9874 Å) were very close to the observed values (robsd(AS, AS) = 2.0559(5) Å and robsd:av(AS, BS) = 2.9852 Å), respectively. Compounds 1–4 were similarly optimized with MP2/BSS-A, where the 6-311+G(d) basis sets were applied to S and/or Se with the 6-31G(d,p) basis sets for C and H. The deformation density map for 1 (S, S) was computed using the Multiwfn program.51
The QTAIM functions were calculated using the Gaussian 09 program package49 with MP2/BSS-A. The results were analyzed with the AIM2000 program.52 Normal coordinates of internal vibrations (NIV) obtained by frequency analysis were employed to generate the perturbed structures.20,21 A k-th perturbed structure (Skw) was generated by the addition of the normal coordinates of the k-th internal vibration (Nk) to the standard orientation of a fully optimized structure (So) in the matrix representation as shown in eqn (3). The coefficient fkw in eqn (3) was determined to satisfy eqn (4) for an interaction in question. The perturbed structures generated with NIV correspond to the structures in the zero-point internal vibrations, where the interaction distances in question are elongated or shortened to the values given in eqn (4), where r and ro stand for the distances in the perturbed and fully optimized structures, respectively, with ao the Bohr radius (0.52918 Å).16,17,52 Nk significant to five decimal places was used to predict Skw.
| | |
r = ro + wao, (w = (0), ±0.05 and ±0.1; ao = 0.52918 Å)
| (4) |
| | |
y = co + c1x + c2x2 + c3x3, (Rc2: square of correlation coefficient)
| (5) |
Hb(rc) versus Hb(rc) − Vb(rc)/2 was plotted for data from five points of w = 0, ±0.05 and ±0.1 in eqn (4) in QTAIM-DFA. Each plot for an interaction was analyzed using a regression curve assuming the cubic function in eqn (5), where (x, y) = (Hb(rc) − Vb(rc)/2, Hb(rc)) (Rc2 > 0.99999).18–22,53
Results and discussion
High-resolution X-ray diffraction determination of electron densities for 1 (S, S)
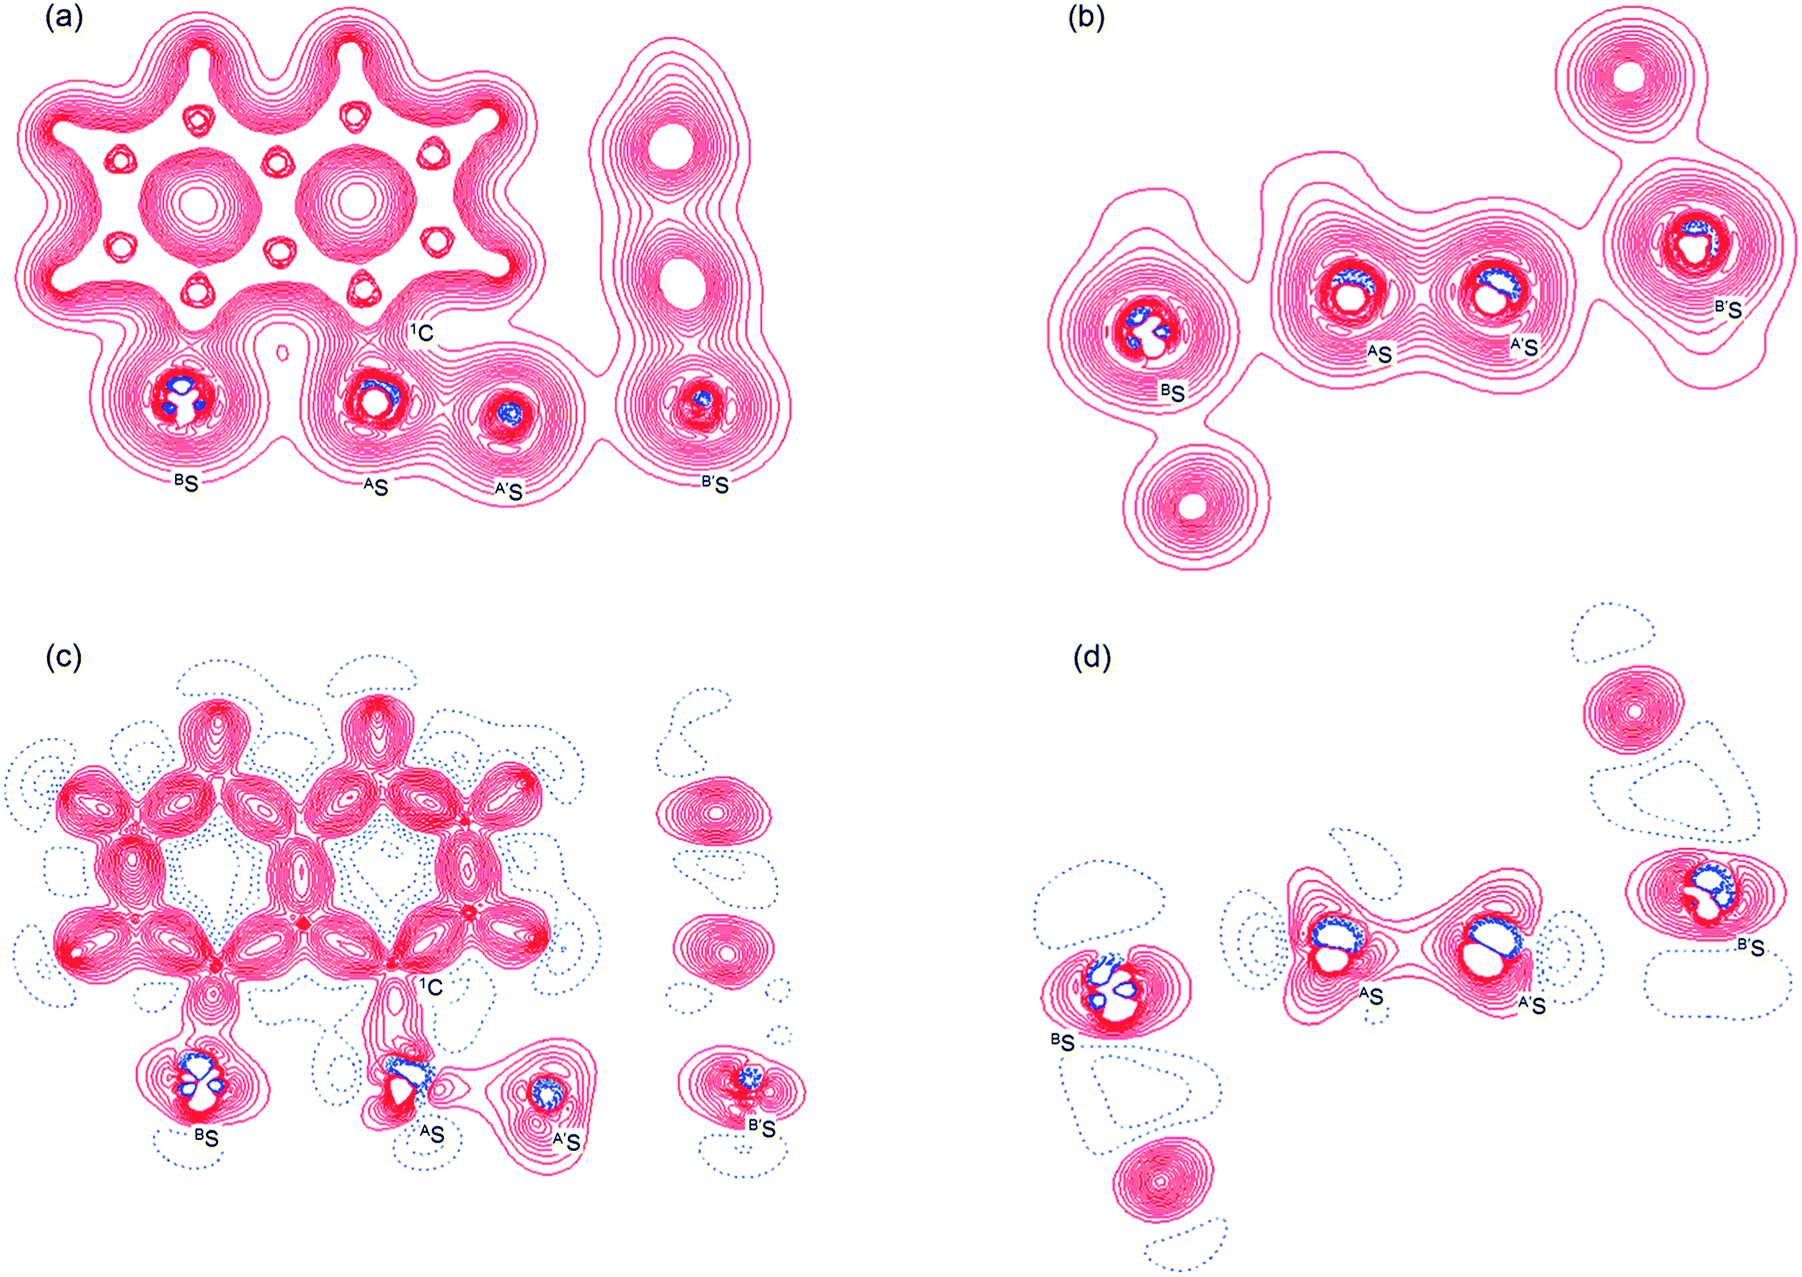
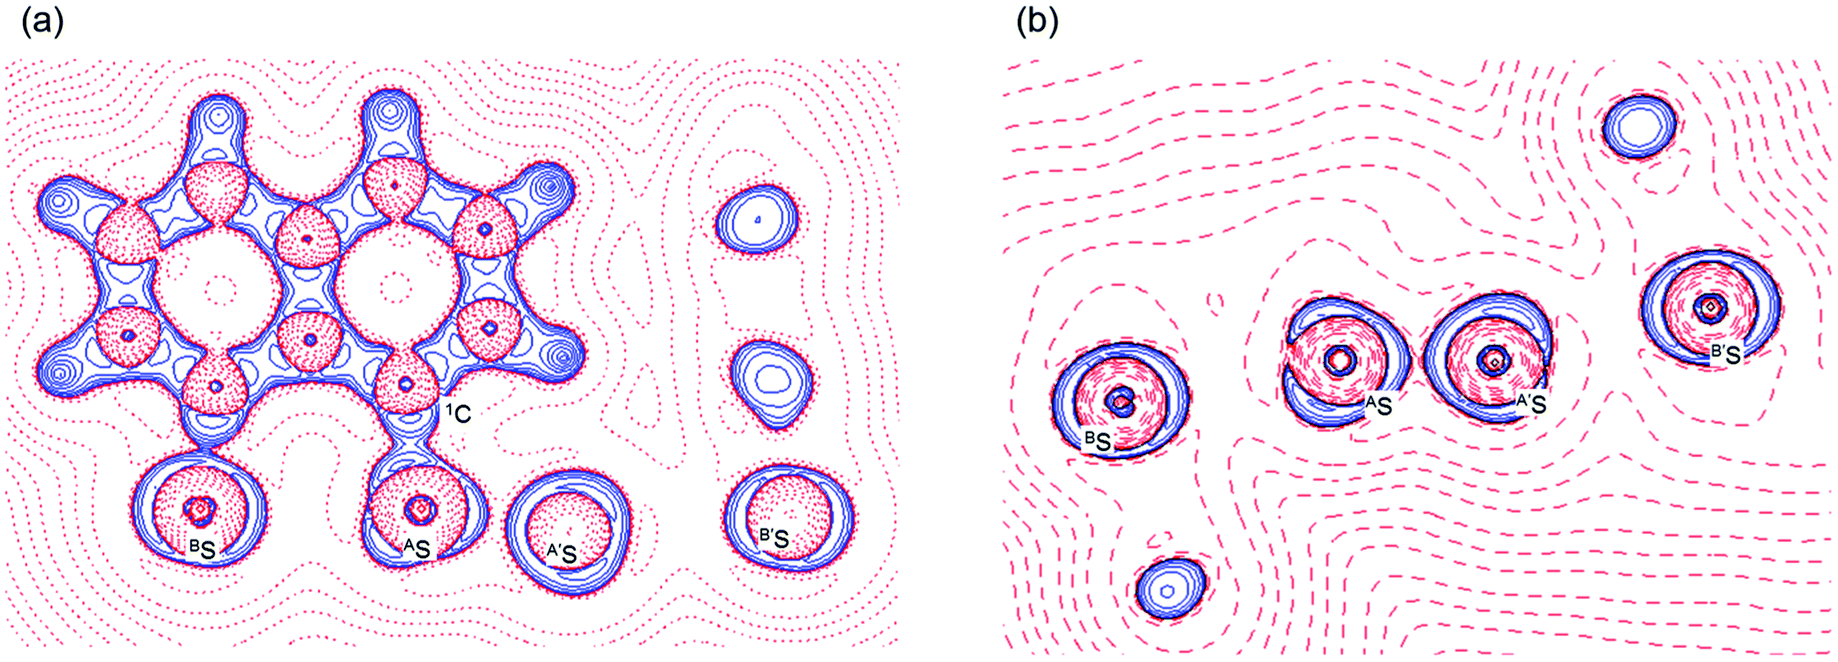
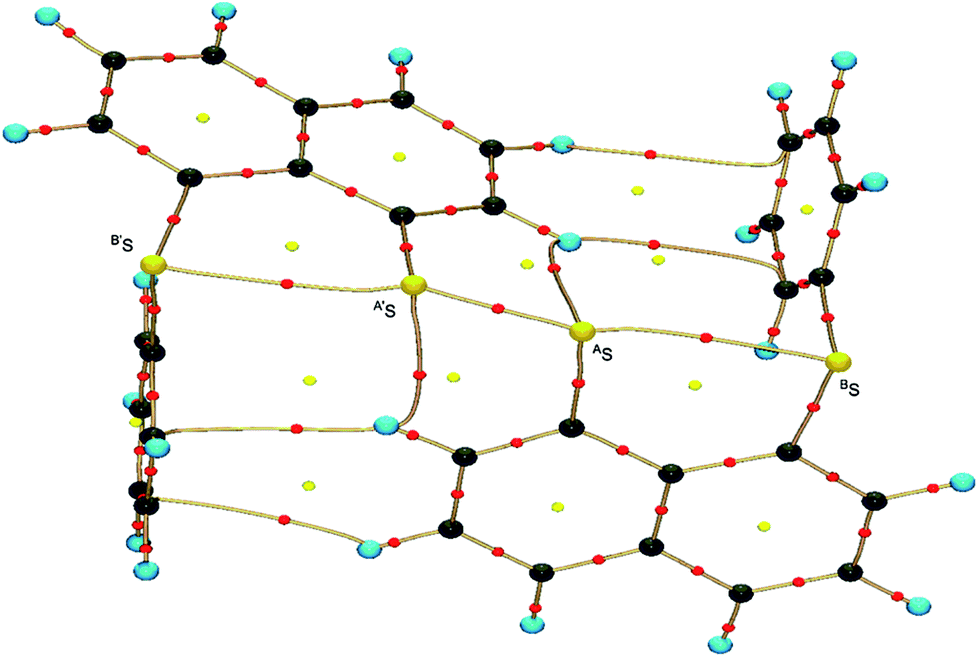
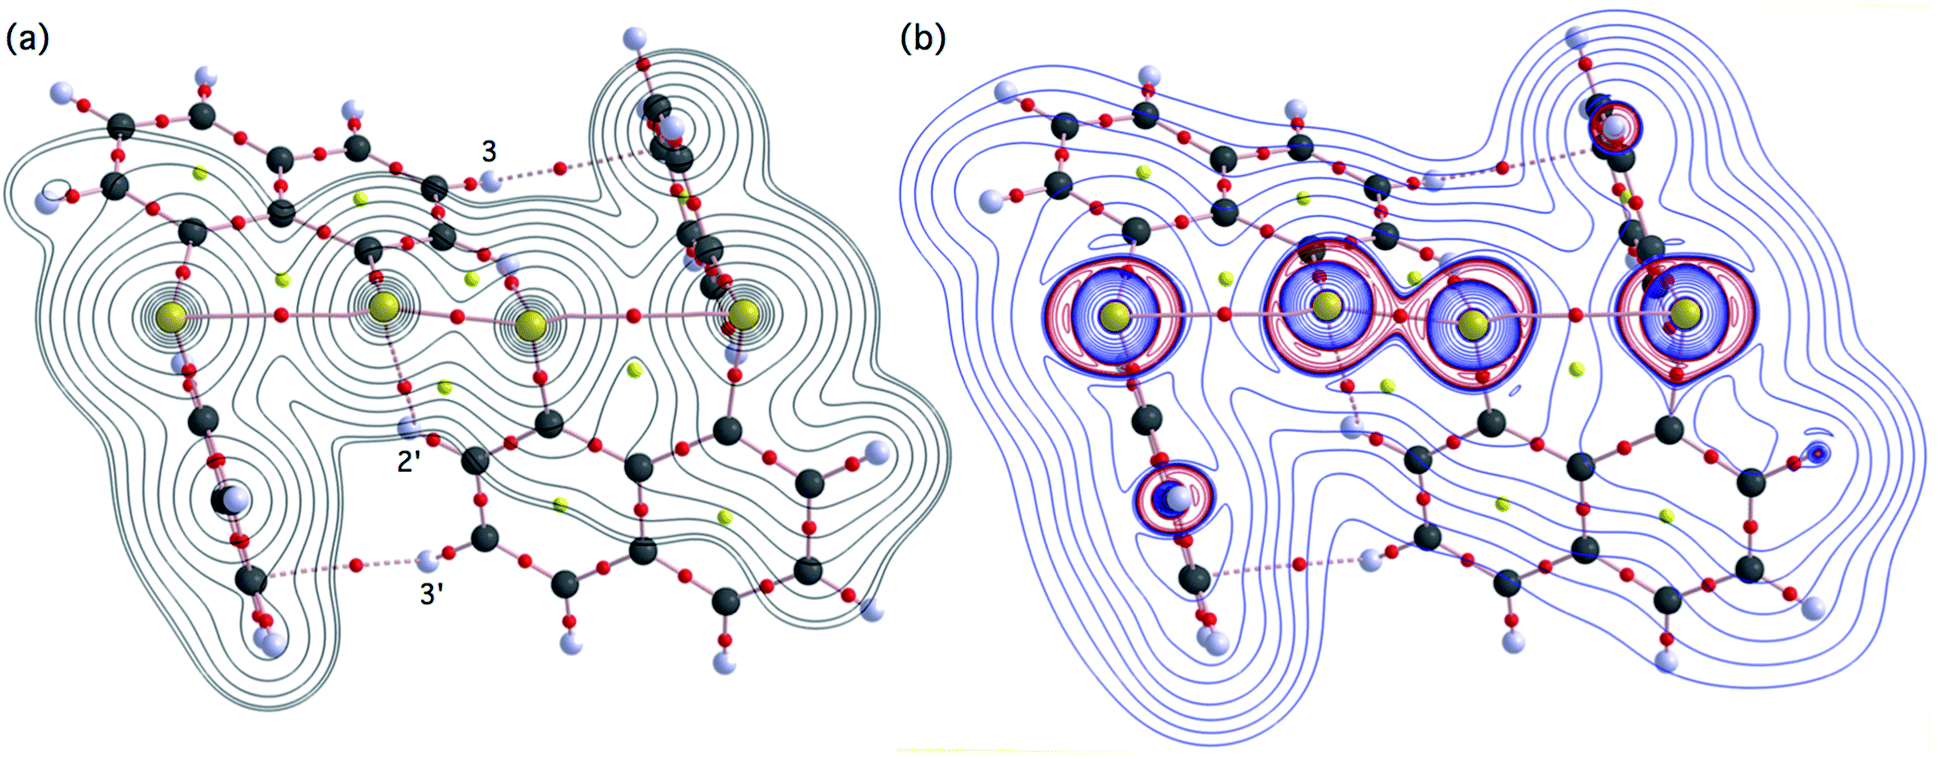
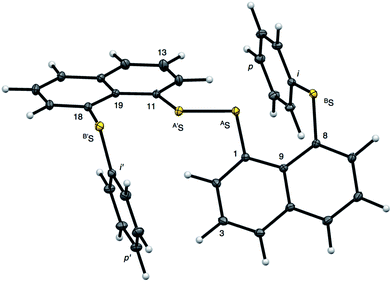
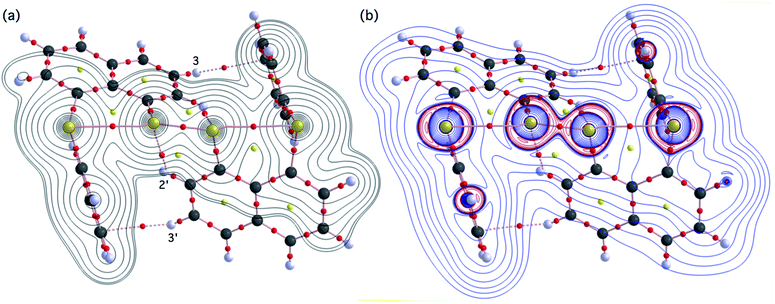
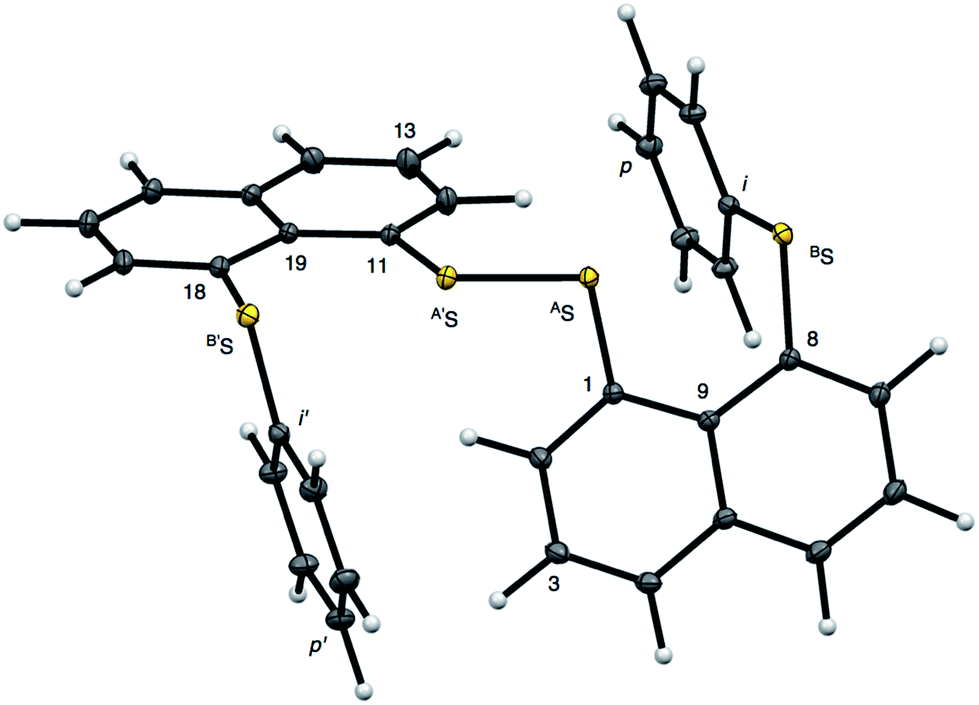
Fig. 2 shows the crystal structure of 1 (S, S) determined by high-resolution X-ray crystallographic analysis and Table 1 shows selected bond distances, angles and torsional angles. The robsd(AS, A′S) and robsd:av(AS, BS) values were determined to be 2.0559(8) Å (ref. 54) and 2.9852(8) Å, respectively, with ∠BSASA′Sobsd:av of 167.2° for 1 (S, S). The BS⋯AS–A′S⋯B’S interaction in 1 (S, S) can be described as linear since ∠BSASA′S is larger than 150°, which is the cut-off value we propose to determine the linearity of these interactions. Accordingly, the BS⋯AS–A′S⋯B′S interaction can be well described by the S4 σ(4c–6e) model. Fig. 3 depicts the valence electron density map in the A′SASC1 plane for 1 (S, S) with magnification around the BS⋯AS–A′S⋯B′S interaction in the BSASA′S (B′S) plane (Fig. 3b). The deformation density map in the A′SASC1 plane for 1 (S, S) and the magnified map around the BS⋯AS–A′S⋯B′S interaction in the BSASA′S (B′S) plane are presented in Fig. 3c and d, respectively. The positive Laplacian map in the A′SASC1 plane for 1 (S, S) and the magnified map around the BE⋯AE–AE⋯BE interaction in the BSASA′S (B′S) plane are presented in Fig. 4a and b, respectively. The BCPs around BS-∗-AS-∗-A′S-∗-B′S in 1 (S, S) are expected to be located in the negative area of ∇2ρb(rc). Fig. 5 illustrates the molecular graph of 1 (S, S), which was determined by high-resolution X-ray crystallographic analysis. All the BCPs are detected as expected, including those around BS-∗-AS-∗-A′S-∗-B′S in 1 (S, S). Two pairs of BPs with BCPs are also detected for the weaker interactions, which are very close to those drawn theoretically and therefore discussed in the theoretical section.
Table 1 Selected structural parameters observed for 1 (S, S) and those evaluated with MP2/BSS-Aa
| Species (AS, BS) (symmetry) |
r(AS, A′S) (Å) |
Δr(AS, A′S)b (Å) |
r(AS, BS) (Å) |
Δr(AS, BS)b (Å) |
Δrvan(AS, BS)c (Å) |
∠A′SASC1 (°) |
∠C8BSCi (°) |
∠BSASA′S (°) |
ϕ1d (°) |
ϕ2e (°) |
| BSS-A; the 6-311+G(d) basis set for S with the 6-31G(d,p) basis sets for C and H. Δr(AS, XS) = rcalcd(AS, XS) − robsd(AS, XS), where X = A′ and B. Δrvan(AS, BS) = r(AS, BS) − ∑rvdW(AS, BS), where rvdW(S) = 1.80 Å (ref. 55). ϕ1 = ϕ(C1ASA′SC1′). ϕ2 = ϕ(C9C8BSCi) and/or ϕ(C19C18B′SCi′). Averaged value: robsd:av(AS, BS) = 2.9879(4) Å and 2.9825(5) Å. Averaged value: ∠C1ASA′Sobsd:av = 105.54(2)° and 104.48(2)°. Averaged value: ∠C8BSCi-obsd:av = 101.94(1)° and 102.99(2)°. Averaged value: ∠BSASA′Sobsd:av = 168.68(2)° and 165.70(2)°. Averaged value: ϕ2-obsd:av = −70.22(2)° and −80.98(2)°. |
| 1 (S, S) (C1)obsd |
2.0559(5) |
0.000 |
2.9852f |
0.000 |
−0.615 |
105.0g |
102.5h |
167.2i |
−89.5 |
−75.6j |
| 1 (S, S) (C2)calcd |
2.0730 |
0.017 |
2.9874 |
0.002 |
−0.613 |
104.0 |
100.6 |
169.4 |
−78.2 |
−64.2 |
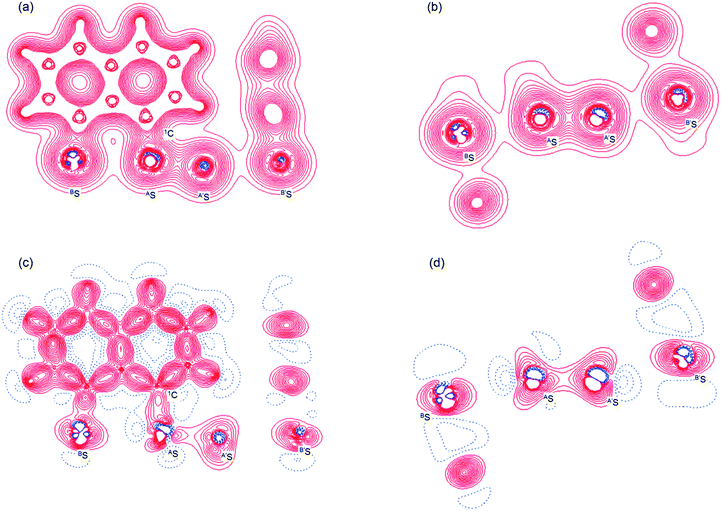 |
| | Fig. 3 Valence electron density map drawn on the BSASC1 plane of 1 (S, S) and the magnified map for the BS⋯AS–A′S⋯B′S interaction drawn on the BSASA′S plane ((a) and (b), respectively), in which the contour level is 0.1 e Å−3. Deformation density map drawn on the BSASC1 plane of 1 (S, S) and the magnified map for the BS⋯AS–A′S⋯B′S interaction drawn on the BSASA′S plane ((c) and(d), respectively), in which contour level is 0.05 e Å−3. The red and blue lines correspond to the increased and decreased electron densities, respectively, in the formation of the chemical bonds or interactions. | |
 |
| | Fig. 4 Positive Laplacian map in the BSASC1 plane of 1 (S, S) (a) and magnified BS⋯AS–A′S⋯B′S interaction region in the BSASA′S plane (b). Positive and negative areas are shown by red and blue lines, respectively and each contour level is 0.05 e Å−3. | |
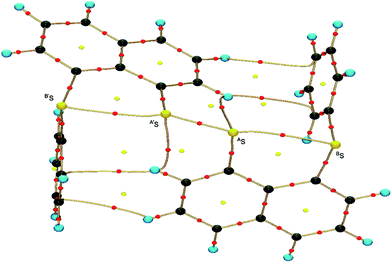 |
| | Fig. 5 Molecular graph of 1 (S, S) determined by high-resolution X-ray crystallographic analysis. | |
Formation of S4 σ(4c–6e) in 1 (S, S) confirmed based on experimental background
The electron distributions can be clearly observed in Fig. 3. The valence electron density map of 1 (S, S) seems to define (three-dimensional) saddle points of ρ(r) between AS and BS and between A′S and B′S of 1 (S, S) and the typical saddle point between AS and A′S (see Fig. 3a or b). Each saddle point of ρ(r) between the adjacent S atoms in BS⋯AS–A′S⋯B′S should correspond to a BCP on a BP in 1 (S, S) (see also Fig. 5). The enhanced charge density at BS directs toward to the depleted area at AS extending over the backside of the AS–A′S bond, as shown in Fig. 3c and d. This shows the contribution of the CT interaction of the np(BS)→σ∗(AS–A′S) form. Similar phenomena can be found between B′S and A′S–AS, which show the CT interaction of the np(B′S)→σ∗(A′S–AS) form. Such degenerated CT interactions should be analyzed as S4 σ(4c–6e) of the np(BS)→σ∗(AS–A′S)←np(B′S) form, which must be the driving force for the formation of S4 σ(4c–6e) as proposed by our group. The valence electron density maps and the deformation density maps around the BS⋯AS–A′S⋯B′S interaction, as shown in Fig. 3, strongly support the formation of linear S4 σ(4c–6e) of the np(BS)→σ∗(AS–A′S)←np(B′S) type in 1 (S, S) based on the experimental treatment.
As shown in Fig. 4, three VSCCs (valence shell charge concentrations) appear at each S atom in the BSASA′S (B′S) plane of 1 (S, S). A pair of VSCCs on AS and BS is beginning to merge with each other, which confirms the presence of the AS⋯BS interaction. The A′S⋯B′S interaction is similarly confirmed through almost merging between the VSCCs on A′S and B′S. These results together with the original AS–A′S bond also confirm the formation of S4 σ(4c–6e) in 1 (S, S). The linearity of the VSCCs is not very good, which would affect the BPs between the atoms. The differences between the lengths of the BPs (rBP) and the straight-line distances (RSL) (ΔrBP = rBP − RSL) are less than 0.0010 Å and 0.012–0.013 Å for AS–A′S and AS⋯BS (and A′S⋯B′S), respectively, in 1 (S, S). Therefore, each of the BS⋯AS–A′S⋯B′S interactions in 1 (S, S) can be approximated to a linear interaction.
The BCPs on BPs around BS⋯AS–A′S⋯B′S in 1 (S, S) are clearly specified in the molecular graph drawn experimentally in Fig. 5 together with that expected for 1 (S, S). Some QTAIM parameters were experimentally determined at the BCPs around BS⋯AS–A′S⋯B′S in 1 (S, S) (see the observed values for the QTAIM parameters and that evaluated theoretically with MP2/BSS-A employing the observed structure of 1 (S, S) in Table 2). Although the AS–A′S bond in 1 (S, S) is experimentally classified by the regular CS (r-CS) interactions, the AS⋯BS and A′S⋯B′S interactions are shown to exist just on the border area between the pure CS (p-CS) and r-CS interactions (see, Fig. 5 and Table 2). The values evaluated theoretically employing the observed structure of 1 (S, S) reproduced the experimentally obtained values accurately except for (ħ2/8m)∇2ρb(rc) (= Hb(rc) − Vb(rc)/2), Hb(rc) and kb(rc) (= Vb(rc)/Gb(rc)) at the BCP of the AS–A′S bond although this deviation does not seem to be very severe. However, the difference in (ħ2/8m)∇2ρb(rc) (= Hb(rc) − Vb(rc)/2) will greatly affect the classification of AS–A′S since the signs are opposite to the values predicted experimentally and the value calculated employing the observed structure of 1 (S, S).
Table 2 QTAIM functions and QTAIM-DFA parameters for AE-∗-A′E and AE-∗-BE at BCPs of 1-(8-PhBEC10H6)AE–A′E(C10H6BEMe-8′)-1′ (1–4)a
| Species (symmetry) |
Interaction (X-∗-Y) |
ρb(rc) (eao−3) |
c∇2ρb(rc)b (au) |
Hb(rc) (au) |
kb(rc)c |
R (au) |
θ (°) |
νn (n)d (cm−1) |
kfe (mDyn Å−1) |
θp (°) |
κp (au−1) |
Classification/characterization |
| The 6-311+G(d) basis set was employed for S and Se with the 6-31G(d,p) basis set for C and H. c∇2ρb(rc) = Hb(rc) − Vb(rc)/2, where c = ℏ2/8m. kb(rc) = Vb(rc)/Gb(rc). Corresponding to the interaction in question. Symmetric and anti-symmetric modes being employed for AE-∗-A′E and AE-∗-BE, respectively. Force constant for νn. Observed values for QTAIM parameters. Calculated values for QTAIM parameters evaluated employing the observed structure. Typical HB nature with covalency. |
| 1 (C1)obsdf |
(AS-∗-A′S) |
0.141 |
0.004 |
−0.11 |
−1.92 |
|
|
|
|
|
|
r-CS |
| (AS-∗-BS) |
0.020 |
0.008 |
0.00 |
−1.00 |
|
|
|
|
|
|
p-CS/r-CS |
| (A′S-∗-B′S) |
0.021 |
0.008 |
0.00 |
−1.00 |
|
|
|
|
|
|
p-CS/r-CS |
| 1 (C1)obsdg |
(AS-∗-AS) |
0.1418 |
−0.0111 |
−0.0748 |
−2.424 |
0.0757 |
188.5 |
|
|
|
|
SS |
| (AS-∗-BS) |
0.0229 |
0.0075 |
−0.0004 |
−1.027 |
0.0075 |
93.1 |
|
|
|
|
r-CS |
| (A′S-∗-B′S) |
0.0234 |
0.0076 |
−0.0005 |
−1.031 |
0.0076 |
93.7 |
|
|
|
|
r-CS |
| 1 (C2)calcd |
(AS-∗-AS) |
0.1373 |
−0.0097 |
−0.0697 |
−2.383 |
0.0704 |
187.9 |
518.7 (48) |
1.701 |
197.5 |
0.5 |
SS/Cov-w |
| (AS-∗-BS) |
0.0227 |
0.0075 |
−0.0004 |
−1.026 |
0.0075 |
93.1 |
181.1 (17) |
0.209 |
117.8 |
68.9 |
r-CS/t-HB-wch |
| 2 (C2)calcd |
(AS-∗-AS) |
0.1356 |
−0.0089 |
−0.0677 |
−2.354 |
0.0683 |
187.5 |
502.9 (48) |
1.698 |
197.5 |
0.6 |
SS/Cov-w |
| (AS-∗-BSe) |
0.0225 |
0.0068 |
−0.0006 |
−1.042 |
0.0069 |
95.1 |
152.0 (16) |
0.154 |
128.1 |
133.3 |
r-CS/t-HB-wch |
| 3 (C2)calcd |
(ASe-∗-ASe) |
0.0970 |
−0.0018 |
−0.0403 |
−2.095 |
0.0404 |
182.5 |
288.9 (28) |
0.442 |
186.6 |
2.5 |
SS/Cov-w |
| (ASe-∗-BS) |
0.0246 |
0.0070 |
−0.0011 |
−1.071 |
0.0070 |
93.7 |
150.9 (15) |
0.086 |
140.1 |
126.4 |
r-CS/t-HB-wch |
| 4 (C2)calcd |
(ASe-∗-ASe) |
0.0948 |
−0.0013 |
−0.0387 |
−2.070 |
0.0387 |
181.9 |
275.5 (28) |
0.664 |
187.1 |
2.4 |
SS/Cov-w |
| (ASe-∗-BSe) |
0.0250 |
0.0064 |
−0.0014 |
−1.098 |
0.0066 |
102.3 |
126.0 (15) |
0.105 |
150.5 |
141.8 |
r-CS/CT-MC |
Theoretical basis for the nature of S4 σ(4c–6e) in 1 (S, S)
Structure of 1 (S, S) optimized at the MP2 level. Compound 1 (S, S) was optimized with MP2/BSS-A, retaining C2 symmetry. Table 1 shows selected predicted bond distances, angles and torsional angles for 1 (S, S). The predicted structural parameters remarkably match the corresponding observed parameters. The rcalcd(AE, AE) and rcalcd(AE, BE) values are 2.0730 and 2.9874 Å, respectively. The differences between the calculated and observed distances for AE–AE and AE⋯BE are also given in Table 1, which are defined as Δr(AE, AE) = rcalcd(AE, AE) − robsd(AE, A′E) and Δr(AE, BE) = rcalcd(AE, BE) − robsd(AE, BE), respectively. The Δr(AE, AE) and Δr(AE, BE) values are 0.017 and 0.002 Å, respectively. The Δr(AE, BE) value of 0.002 Å completely satisfies this criterion, while the Δr(AE, AE) value of 0.017 Å is only slightly larger than 0.013 Å. The magnitude of Δr less than 0.013 Å is desirable for QTAIM-DFA, which corresponds to a half of each interval of adjacent two data points in the plots of Hb(rc) versus Hb(rc) − Vb(rc)/2 in QTAIM-DFA (0.013 Å = 0.05ao/2 = 0.026 Å/2; see Fig. 8). Despite the slightly larger magnitude of Δr(AE, A′E), the optimized overall structure of 1 (S, S) can be considered to satisfy the criterion since the AE⋯BE interactions are the principle concern for S4 σ(4c–6e).
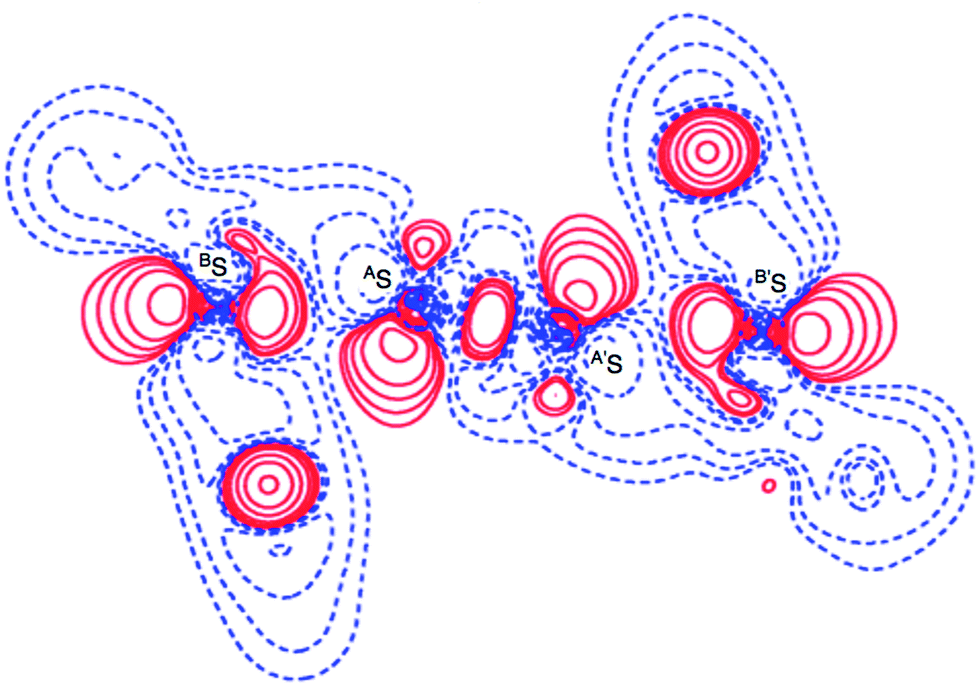
Deformation density map around BS-∗-AS-∗-AS-∗-BS of 1 (S, S). The deformation density map was drawn theoretically on the BSASA′S plane around the BS-∗-AS-∗-A′S-∗-B′S interaction of 1 (S, S) in C2 symmetry, similarly to the case of the experimental approach as shown in Fig. 6. The deformation density map shown in Fig. 6 is (very) similar to that shown in Fig. 3d. The enhanced charge density at BS also directs toward to the depleted area at AS extending over the backside of the AS–A′S bond, as shown in Fig. 6. In particular, the CT interaction of the np(BS)→σ∗(AS–A′S)←np(B′S) type is also demonstrated theoretically by the deformation density map, which should be analyzed as linear S4 σ(4c–6e) as discussed above. The contribution of the CT interaction of the np(BE)→σ∗(AE–AE)←np(BE) type in 1 (AE = BE = S) was evaluated by the second order perturbation of the Fock matrix (E(2))56 with MP2/BSS-A, and also those for 2–4 (AE, BE = S and/or Se). The results are shown in Table S4 of the ESI.† The E(2) values of 13.2–26.1 kcal mol−1 were predicted for 1–4 depending on AE and BE, where σ∗(AE–AE) contributes much more than the case of n(BE). The S4 σ(4c–6e) nature of the linear S4 interaction in 1 (S, S) as well as in AE2BE2 σ(4c–6e) in 2–4 (AE, BE = S and/or Se) are theoretically well established.
 |
| | Fig. 6 Deformation density map for the BS⋯AS–A′S⋯B′S interaction drawn on the BSASA′S plane of 1 (S, S), of which contour level is 0.05 e Å−3. The red and blue lines correspond to the increased and decreased electron densities, respectively, in the formation of the chemical bonds or interactions. | |
Molecular graph, contour plot, and negative Laplacian around BS-∗-AS-∗-A′S-∗-B′S in 1 (S, S). Fig. 7 shows the molecular graph, contour plot, and negative Laplacian map for 1 (S, S) calculated with MP2/BSS-A. All BCPs are detected as expected, including those around BS-∗-AS-∗-A′S-∗-B′S in 1 (S, S). Similarly to the case of the experimental results, BCPs are also detected for the weaker interactions of AS-∗-2′H with A′S-∗-2H and 3H-∗-p′C with 3′H-∗-pC. The former may play an additional role in stabilising the linear BS-∗-AS-∗-A′S-∗-B′S interaction, while the latter is likely to influence the specific positions of the phenyl groups through the CNap–H⋯π(C6H5S) interactions. As shown in Fig. 7b, the BCP on AS-∗-A′S is located in the negative area of ∇2ρb(rc), while those on AS-∗-BS are in the positive region. These results indicate that AS-∗-A′S and AS-∗-BS are classified by shared shell (SS) and closed shell (CS) interactions, respectively. Accordingly, these results clearly demonstrate the formation of S4 σ(4c–6e) in 1 (S, S) theoretically. As shown in Fig. 7, the BPs (AS-∗-BS) seem somewhat bent around AS. However, the differences between rBP and the corresponding RSL (ΔrBP = rBP − RSL) are 0.001 Å and 0.021 Å for ΔrBP (AS, A′S) and ΔrBP (AS, BS), respectively, in 1 (S, S) (Table S3 of the ESI†). These results indicate that each of the BS⋯AS–A′S⋯B′S interactions in 1 (S, S) can also be approximated as a linear interaction theoretically. The ΔrBP values in 5–8 have been discussed elsewhere.11
 |
| | Fig. 7 Molecular graphs for 1 (S, S) with contour plot (a) and negative Laplacian map (b) calculated with MP2/BSS-A. BCPs (bond critical points) are denoted by red dots, RCPs (ring critical points) by yellow dots and CCPs (cage critical points) by green dots. BPs (bond paths) are drawn as pink lines and the secondary one as pink dots. They are associated with the BCPs. Carbon, hydrogen and sulfur atoms are shown in black, gray and yellow, respectively. The contours (ea0−3) for (a) are at 2l (l = ±8, ±7 … and 0) with 0.0047 (bold line). Positive and negative areas in (b) are in blue and red lines, respectively. | |
The nature of the non-covalent E⋯E interaction was established for E = S in 1 (S, S) both experimentally and theoretically in this study. The interaction becomes much stronger for E = Se in 4 (Se, Se) based on the theoretical investigations. The results are in accordance with those reported recently14–16 although the strength of S⋯S seems to change widely as the structure changes.
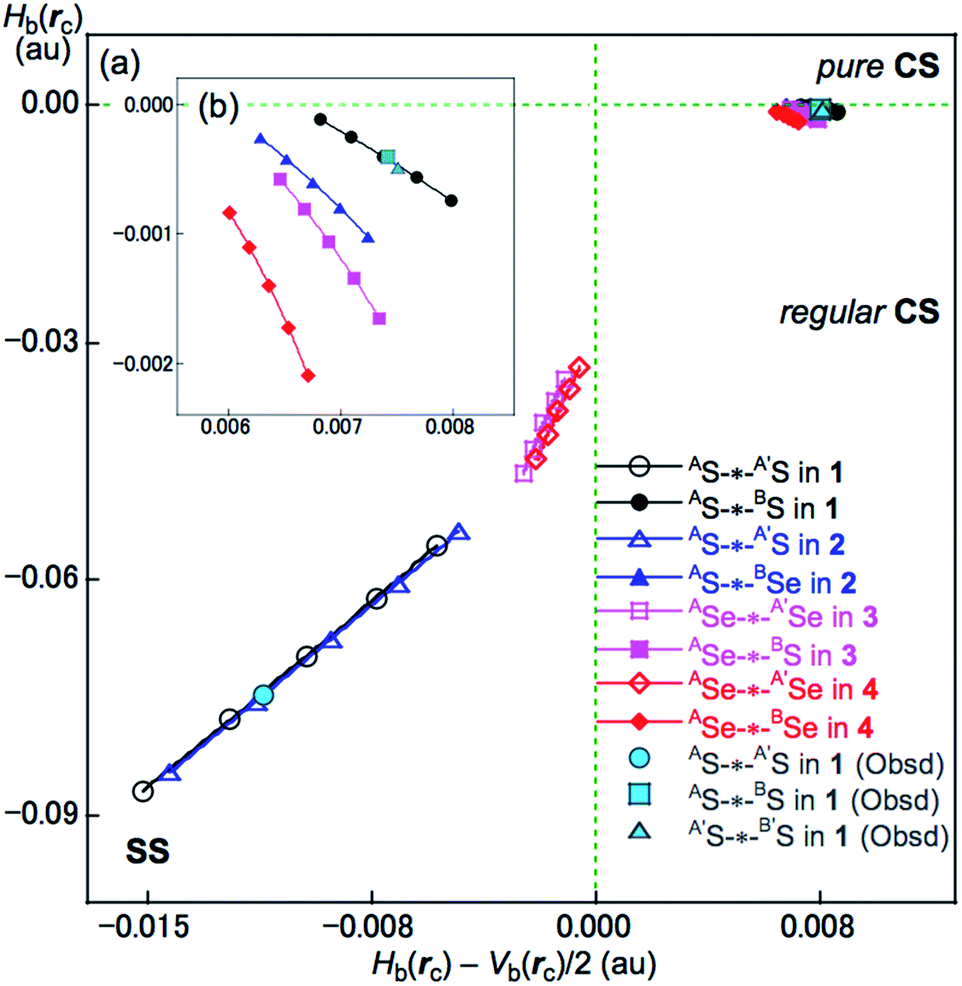
Application of QTAIM-DFA to AE2BE2 σ(4c–6e) (AE, BE = S, Se). The QTAIM functions of ρb(rc), Hb(rc) − Vb(rc)/2, Hb(rc) and kb(rc) (= Vb(rc)/Gb(rc)) were evaluated for AE-∗-AE and AE-∗-BE at the BCPs and Table 2 presents the values obtained. Table 2 also contains the frequencies (ν) and force constants (kf) corresponding to AE-∗-A′E and AE-∗-BE. Fig. 8 shows the plots of Hb(rc) versus Hb(rc) − Vb(rc)/2 for the fully optimized data of 1–4 given in Table 2 together with those from the perturbed structures around the fully optimized structures; the perturbed structures were generated with NIV according to eqn (3) and eqn (4). The plots were analyzed according to eqn (S3)–(S6) in the ESI† and the QTAIM-DFA parameters of (R, θ) and (θp, κp) were obtained. Table 2 presents the (R, θ) and (θp, κp) values for AE-∗-AE and AE-∗-BE in 1–4.
 |
| | Fig. 8 Plots of Hb(rc) versus Hb(rc) − Vb(rc)/2 for AE-*-AE and AE-*-BE of 1–4. (a) Whole plot and (b) magnified plot for AE-*-BE. Marks and colours for the species are shown in the figure. | |
Nature of AS-∗-AS and AS-∗-BS in 1 (S, S) as defined by θ and θp. The nature of AS-∗-AS and AS-∗-BS in 1 (S, S) was determined using the QTAIM-DFA parameters of (R, θ) and (θp, κp) with the standard values in Scheme S2 of the ESI† as a reference. The θ values are for the classification of interactions, which can then be characterized by θp with R being used to sub-divide the covalent interactions. It is instructive to survey the criteria briefly in relation to this study. The CS and SS interactions have values of 45° < θ < 180° (0 < Hb(rc) − Vb(rc)/2) and 180° < θ < 206.6° (Hb(rc) − Vb(rc)/2 < 0), respectively. The CS interactions are sub-divided into p-CS and r-CS for values of 45° < θ < 90° (0 < Hb(rc)) and 90° < θ < 180° (Hb(rc) < 0), respectively. The θp value plays an important role in characterizing the interactions. In the p-CS region of 45° < θ < 90°, when 45° < θp < 90°, the interactions will be vdW type character, while for 90° < θp < 125°, they will be typical HB (t-HB)-type without covalency (θp of 125° corresponds to θ = 90°).18–21 CT interactions will occur in the r-CS region, where 90° < θ < 180°. The t-HB interactions with covalency (t-HB-wc) appear in the range of 125° < θp < 150° (90° < θ < 115°). CT-MC (molecular complex through charge transfer) and CT-TBP (trigonal bipyramidal adduct through CT) type interactions will appear in the ranges of 150° < θp < 180° (115° < θ < 150°) and 180° < θp < 190° (150° < θ < 180°), respectively, although CT-TBP was not observed in this study. R provides a way to sub-classify the SS interactions, where the classical covalent SS chemical bonds are weak (Cov-w) when R < 0.15 au.The (θ, θp, R) values for AS-∗-AS in 1 (S, S) are (187.9°, 197.5°, 0.0704 au), which is therefore classified as SS and predicted to have weak covalent nature (SS/Cov-w). Similarly, (θ, θp, R) = (93.1°, 117.8°, 0.0075 au) for AS-∗-BS, which is therefore classified as r-CS. The interaction is predicted to have t-HB-wc nature irrespective of θp = 117.8° (<125°) because the θ value of 93.1° (>90°) is superior to θp = 117.8° (<125°) [θp = 125° corresponds to θ = 90° for typical interactions (see Scheme S2 of the ESI†)]. Therefore, AS-∗-BS in 1 (S, S) is predicted to have r-CS/t-HB-wc nature overall. The nature of AE-∗-AE and AE-∗-BE was also predicted for 2–4. The AE-∗-AE interactions in 2–4 have SS/Cov-w nature irrespective of the θp value of about 187° for 3 (Se, S) and 4 (Se, Se) since θ values (larger than 180°) are superior to the θp values in the classification. Although AE-∗-BE in 2–4 are classified as r-CS interactions based on the criterion of 93° < θ < 102°, they are predicted to be of t-HB-wc, t-HB-wc and CT-MC nature, respectively, based on the θp values. These results are summarized in Table 2.
Conclusion
The high-resolution X-ray diffraction determination of electron densities supported by a rigorous theoretical treatment was performed for 1 (S, S). The valence electron density map exhibits (three-dimensional) saddle points of ρ(r) between AS and BS and between A′S and B′S. Enhanced charge densities at BS and B′S direct toward to the depleted area around AS and A′S, respectively, and extend over the backside of the AS–A′S bond. The results demonstrate the formation of S4 σ(4c–6e) of the np(BS)→σ∗(AS–A′S)←np(B′S) type. This is supported by the valence electron density map(s) and the deformation density maps in the region around BS⋯AS–A′S⋯B′S. A pair of VSCCs originating from AS and BS merge with each other confirming the presence of the AS⋯BS interaction as well as those on A′S and B′S forming the A′S⋯B′S interaction. These results together with the conventional AS–A′S bond confirm the formation of S4 σ(4c–6e) in 1 (S, S). The formation of S4 σ(4c–6e) is experimentally demonstrated clearly by BPs with BCPs in the molecular graph for BS⋯AS–A′S⋯B′S. The AS⋯BS and A′S⋯B′S interactions are observed on the border area between the p-CS and r-CS interactions. These experimental results are well supported and rationalised by complementary theoretical calculations.
The dual experimental–theoretical approach provides a solid basis for understanding the behavior of BE⋯AE–A′E⋯B′E of E4 σ(4c–6e) not only in 1 (S, S) but also in 2–4. This methodology has previously been applied to 2-(2-pyridylimino)-2H-1,2,4-thiadiazolo[2,3-a]pyridine,57 for which the behavior of N–E–N σ(3c–4e) (E = S, Se and Te) was clarified. Compilation of these results makes it possible to confirm the real existence and chemistry of hypervalent and extended hypervalent interactions.
Conflicts of interest
The authors declare no conflict of interest.
Acknowledgements
This work was partially supported by a Grant-in-Aid for Scientific Research (No. 17K05785) from the Ministry of Education, Culture, Sports, Science and Technology, Japan. The authors would like to thank the UK Engineering and Physical Sciences Research Council for funding the UK National Crystallography Service.
Notes and references
-
(a) G. C. Pimentel, J. Chem. Phys., 1951, 19, 446 CrossRef CAS;
(b) J. I. Musher, Angew. Chem., Int. Ed. Engl., 1969, 8, 54–68 CrossRef CAS.
-
(a) W. Nakanishi, S. Hayashi and S. Toyota, Chem. Commun., 1996, 371–372 RSC;
(b) W. Nakanishi, S. Hayashi and S. Toyota, J. Org. Chem., 1998, 63, 8790–8800 CrossRef CAS.
- W. Nakanishi, S. Hayashi and T. Arai, Chem. Commun., 2002, 2416–2417 RSC.
- W. Nakanishi, S. Hayashi, S. Morinaka, T. Sasamori and N. Tokitoh, New J. Chem., 2008, 32, 1881–1889 RSC.
-
(a) W. Nakanishi, S. Hayashi and N. Itoh, Chem. Commun., 2003, 124 RSC;
(b) W. Nakanishi, S. Hayashi and N. Itoh, J. Org. Chem., 2004, 69, 1676 CrossRef CAS PubMed;
(c) W. Nakanishi, S. Hayashi, S. Yamaguchi and K. Tamao, Chem. Commun., 2004, 140–141 RSC.
-
(a) W. Nakanishi, Hypervalent Chalcogen Compounds in Handbook of Chalcogen Chemistry: New Perspectives in Sulfur, Selenium and Tellurium, ed. F. A. Devillanova, Royal Society of Chemistry, London, 2006, ch. 10.3, pp. 644–668 Search PubMed;
(b) W. Nakanishi and S. Hayashi in Handbook of Chalcogen Chemistry: New Perspectives in Sulfur, Selenium and Tellurium, ed. F. A. Devillanova and W.-W. du Mont, Royal Society of Chemistry: Cambridge, U.K., 2nd edn, 2013, ch. 12.3, vol. 2, pp. 335–372 Search PubMed;
(c) W. Nakanishi, S. Hayashi, M. Hashimoto, M. Arca, M. C. Aragoni and V. Lippolis in The Chemistry of Organic Selenium and Tellurium Compounds, ed Z. Rappoport, Wiley, New York, 2013, ch. 11, vol. 4, pp. 885–972 Search PubMed.
-
(a) M. C. Durrant, Chem. Sci., 2015, 6, 6614–6623 RSC;
(b) M. S. Schmøkel, S. Cenedese, J. Overgaard, M. R. V. Jørgensen, Y.-S. Chen, C. Gatti, D. Stalke and B. B. Iversen, Inorg. Chem., 2012, 51, 8607–8616 CrossRef PubMed.
- The Chemistry of Organic Selenium and Tellurium Compounds, ed. Z. Rappoport, Wiley, New York, 2013, ch. 13–16, vol. 4, pp. 989–1236 Search PubMed.
- T. P. Kilian, F. R. Knight and J. D. Woollins, Chem.–Eur. J., 2011, 17, 2302–2328 CrossRef PubMed.
-
(a) G. Mugesh, A. Panda, H. B. Singh, N. S. Punekar and R. J. Butcher, Chem. Commun., 1998, 2227–2228 RSC;
(b) G. Mugesh, A. Panda, H. B. Singh, N. S. Punekar and R. J. Butcher, J. Am. Chem. Soc., 2001, 123, 839–850 CrossRef CAS PubMed;
(c) G. Mugesh, A. Panda, S. Kumar, S. Apte, H. B. Singh and R. J. Butcher, Organometallics, 2002, 21, 884–892 CrossRef CAS;
(d) S. Kumar, K. Kandasamy, H. B. Singh and R. J. Butcher, New J. Chem., 2004, 28, 640–645 RSC;
(e) S. C. Menon, H. B. Singh, J. M. Jasinski, J. P. Jasinski and R. J. Butcher, Organometallics, 1996, 15, 1707–1712 CrossRef CAS;
(f) J. E. Drake, M. B. Hursthouse, M. Kulcsar, M. E. Light and A. Silvestru, Phosphorus, Sulfur Silicon Relat. Elem., 2001, 169, 293–296 CrossRef;
(g) J. E. Drake, M. B. Hursthouse, M. Kulcsar, M. E. Light and A. Silvestru, J. Organomet. Chem., 2001, 623, 153–160 CrossRef CAS;
(h) J. R. Anacona, J. Gomez and D. Lorono, Acta Crystallogr., Sect. C: Cryst. Struct. Commun., 2003, 59, o277–o280 CAS;
(i) G. Mugesh, H. B. Singh and R. J. Butcher, Eur. J. Inorg. Chem., 1999, 1229–1236 CrossRef CAS;
(j) G. Mugesh, H. B. Singh and R. J. Butcher, J. Organomet. Chem., 1999, 577, 243–248 CrossRef CAS;
(k) D. Shimizu, N. Takeda and N. Tokitoh, Chem. Commun., 2006, 177–178 RSC.
-
(a) R.-F. Hu, Y.-H. Wen, J. Zhang, Z.-J. Li and Y.-G. Yao, Acta Crystallogr., Sect. E: Struct. Rep. Online, 2004, 60, o2029–o2031 CAS;
(b) S. Wang, H. Mao-Lin and F. Chen, Acta Crystallogr., Sect. E: Struct. Rep. Online, 2004, 60, m413–m415 CAS;
(c) X.-J. Wang, Z.-F. Chen, B.-S. Kang, H. Liang, H.-Q. Liu, K.-B. Yu, C.-Y. Su and Z.-N. Chen, Polyhedron, 1999, 18, 647–655 CrossRef CAS.
-
(a) J. R. Anacona, J. Gomez and D. Lorono, Acta Crystallogr., Sect. C: Cryst. Struct. Commun., 2003, 59, o277–o280 CAS;
(b) T. C. W. Mak, W.-H. Yip, W.-H. Chan, G. Smith and C. H. L. Kennard, Aust. J. Chem., 1989, 42, 1403–1406 CrossRef CAS.
- W. Nakanishi, Y. Tsubomoto and S. Hayashi, RSC Adv., 2016, 6, 93195–93204 RSC.
- Similar E4 σ(4c–6e) interactions were reported in (EPR2NPR2E-)2 (E = S, Se, Te: R = i-Pr or t-Bu), recently. The elongation of the central E–E bonds is estimated to be 2, 6, and 8%, relative to the corresponding typical values, for E = S, Se, and Te, respectively..
- J. S. Ritch, T. Chivers, D. J. Eisler and H. M. Tuononen, Chem.–Eur. J., 2007, 13, 4643–4653 CrossRef CAS PubMed.
- See also, T. Chivers, D. J. Eisler, J. S. Ritch and H. M. Tuononen, Angew. Chem., Int. Ed., 2005, 44, 4953–4956 CrossRef CAS PubMed.
-
(a) G. E. Garrett, G. L. Gibson, R. N. Straus, D. S. Seferos and M. S. Taylor, J. Am. Chem. Soc., 2015, 137, 4126–4133 CrossRef CAS PubMed;
(b) M. E. Brezgunova, J. Lieffrig, E. Aubert, S. Dahaoui, P. Fertey, S. Lebègue, J. A. Ángyán, M. Fourmigué and E. Espinosa, Cryst. Growth Des., 2013, 13, 3283–3289 CrossRef CAS;
(c) F. T. Burling and B. M. Goldstein, J. Am. Chem. Soc., 1992, 114, 2313–2320 CrossRef CAS;
(d) Y. Nagao, T. Hirata, S. Goto, S. Sano, A. Kakehi, K. Iizuka and M. Shiro, J. Am. Chem. Soc., 1998, 120, 3104–3110 CrossRef CAS;
(e) A. F. Cozzolino, P. J. W. Elder and I. Vargas-Baca, Coord. Chem. Rev., 2011, 255, 1426–1438 CrossRef CAS;
(f) H. Zhao and F. Gabbaï, Nat. Chem., 2010, 2, 984–990 CrossRef CAS PubMed;
(g) W. Wang, B. Ji and Y. Zhang, J. Phys. Chem. A, 2009, 113, 8132–8135 CrossRef CAS PubMed.
-
(a) W. Nakanishi, S. Hayashi and K. Narahara, J. Phys. Chem. A, 2009, 113, 10050–10057 CrossRef CAS PubMed;
(b) W. Nakanishi, S. Hayashi and K. Narahara, J. Phys. Chem. A, 2008, 112, 13593–13599 CrossRef CAS PubMed.
- W. Nakanishi and S. Hayashi, Curr. Org. Chem., 2010, 14, 181–197 CrossRef CAS.
- W. Nakanishi and S. Hayashi, J. Phys. Chem. A, 2010, 114, 7423–7430 CrossRef CAS PubMed.
- W. Nakanishi, S. Hayashi, K. Matsuiwa and M. Kitamoto, Bull. Chem. Soc. Jpn., 2012, 85, 1293–1305 CrossRef CAS.
-
(a) S. Hayashi, K. Matsuiwa, M. Kitamoto and W. Nakanishi, J. Phys. Chem. A, 2013, 117, 1804–1816 CrossRef CAS PubMed;
(b) Y. Sugibayashi, S. Hayashi and W. Nakanishi, Phys. Chem. Chem. Phys., 2015, 17, 28879–28891 RSC;
(c) S. Hayashi, Y. Sugibayashi and W. Nakanishi, Phys. Chem. Chem. Phys., 2016, 18, 9948–9960 RSC;
(d) S. Hayashi, K. Matsuiwa, N. Nishizawa and W. Nakanishi, J. Org. Chem., 2015, 80, 11963–11976 CrossRef CAS PubMed;
(e) Y. Sugibayashi, S. Hayashi and W. Nakanishi, ChemPhysChem, 2016, 17, 2579–2589 CrossRef CAS PubMed.
-
(a) R. F. W. Bader, J. Phys. Chem. A, 2009, 113, 10391–10396 CrossRef CAS PubMed;
(b) C. Foroutan-Nejad, S. Shahbazian and R. Marek, Chem.–Eur. J., 2012, 18, 4982–4993 CrossRef PubMed;
(c) M. Garcıa-Revilla, E. Francisco, P. L. A. Popelier and A. M. Pendás, ChemPhysChem, 2013, 14, 1211–1218 CrossRef PubMed;
(d) Z. A. Keyvani, S. Shahbazian and M. Zahedi, Chem.–Eur. J., 2016, 22, 5003–5009 CrossRef CAS PubMed.
- Atoms in Molecules. A Quantum Theory, ed. R. F. W. Bader, Oxford University Press, Oxford, UK, 1990 Search PubMed.
- C. F. Matta and R. J. Boyd, An Introduction to the Quantum Theory of Atoms in Molecules in The Quantum Theory of Atoms in Molecules: From Solid State to DNA and Drug Design, ed. C. F. Matta and R. J. Boyd, WILEY-VCH, Weinheim, Germany, 2007, ch. 1 Search PubMed.
-
(a) F. Biegler-König and J. Schönbohm, J. Comput. Chem., 2002, 23, 1489–1494 CrossRef PubMed;
(b) F. Biegler-König, J. Schönbohm and D. Bayles, J. Comput. Chem., 2001, 22, 545–559 CrossRef;
(c) R. F. W. Bader, J. Phys. Chem. A, 1998, 102, 7314–7323 CrossRef CAS;
(d) R. F. W. Bader, Chem. Rev., 1991, 91, 893–926 CrossRef CAS;
(e) R. F. W. Bader, Acc. Chem. Res., 1985, 18, 9–15 CrossRef CAS;
(f) T. H. Tang, R. F. W. Bader and P. MacDougall, Inorg. Chem., 1985, 24, 2047–2053 CrossRef CAS;
(g) R. F. W. Bader, T. S. Slee, D. Cremer and E. Kraka, J. Am. Chem. Soc., 1983, 105, 5061–5068 CrossRef CAS;
(h) F. Biegler-König, R. F. W. Bader and T. H. Tang, J. Comput. Chem., 1982, 3, 317–328 CrossRef.
- J. A. Dobado, H. Martînez-Garcîa, J. Molina and M. R. Sundberg, J. Am. Chem. Soc., 2000, 122, 1144–1149 CrossRef CAS.
- J. Molina and J. A. Dobado, Theor. Chem. Acc., 2001, 105, 328–337 CrossRef CAS.
- S. K. Ignatov, N. H. Rees, B. R. Tyrrell, S. R. Dubberley, A. G. Razuvaev, P. Mountford and G. I. Nikonov, Chem.–Eur. J., 2004, 10, 4991–4999 CrossRef CAS PubMed.
- S. K. Tripathi, U. Patel, D. Roy, R. B. Sunoj, H. B. Singh, G. Wolmershäuser and R. J. Butcher, J. Org. Chem., 2005, 70, 9237–9247 CrossRef CAS PubMed.
-
(a) M. Yamashita, Y. Yamamoto, K.-y. Akiba, D. Hashizume, F. Iwasaki, N. Takagi and S. Nagase, J. Am. Chem. Soc., 2005, 127, 435–4371 Search PubMed;
(b) Y. Yamamoto and K.-y. Akiba, J. Synth. Org. Chem., Jpn., 2004, 62, 1128–1137 CrossRef CAS.
- W. Nakanishi, T. Nakamoto, S. Hayashi, T. Sasamori and N. Tokitoh, Chem.–Eur. J., 2007, 13, 255–268 CrossRef CAS PubMed.
- Some specific interactions are tried to analyze employing QTAIM. See, I. S. Bushmarinov, M. Y. Antipin, V. R. Akhmetova, G. R. Nadyrgulova and K. A. Lyssenko, J. Phys. Chem. A, 2008, 112, 5017–5023 CrossRef CAS PubMed , for an example.
- CrystalClear, Rigaku Corporation, Tokyo, Japan, 2009 Search PubMed.
- CrysalisPro, Agilent Technologies, Oxfordshire, 2013 Search PubMed.
- R. H. Blessing, J. Appl. Crystallogr., 1997, 30, 421–426 CrossRef CAS.
- G. M. Sheldrick, Acta Crystallogr., Sect. A: Found. Crystallogr., 2008, 64, 112–122 CrossRef CAS PubMed.
- N. K. Hansen and P. Coppens, Acta Crystallogr., Sect. A: Cryst. Phys., Diffr., Theor. Gen. Crystallogr., 1978, 34, 909–921 CrossRef.
- A. Volkov, P. Macchi, L. J. Farrugia, C. Gatti, P. Mallinson, T. Richter and T. Koritsanszky, XD2016, A Computer Program Package for Multipole Refinement, Topological Analysis of Charge Densities and Evaluation of Intermolecular Energies from Experimental and Theoretical Structure Factors, 2016 Search PubMed.
- E. Clementi and C. Roetti, At. Data Nucl. Data Tables, 1974, 14, 177–478 CrossRef CAS.
- J. Overgaard and D. E. Hibbs, Acta Crystallogr., Sect. A: Found. Crystallogr., 2004, 60, 480–487 Search PubMed.
- E. Espinosa, E. Molins and C. Lecomte, Phys. Rev. B: Condens. Matter Mater. Phys., 1997, 56, 1820–1833 CrossRef CAS.
- P. M. Dominiak and P. Coppens, Acta Crystallogr., Sect. A: Found. Crystallogr., 2006, 62, 224–227 CrossRef PubMed.
- S. Pillet, M. Souhassou, Y. Pontillon, A. Caneschi, D. Gatteschi and C. Lecomte, New J. Chem., 2001, 25, 131–143 RSC.
- D. Leusser, J. Henn, N. Kocher, B. Engels and D. J. Stalke, J. Am. Chem. Soc., 2004, 126, 1781–1793 CrossRef CAS PubMed.
- S. Dahaoui, V. Pichon-Pesme, J. A. K. Howard and C. J. Lecomte, J. Phys. Chem. A, 1999, 103, 6240–6250 CrossRef CAS.
- E. Clementi and D. L. J. Raimondi, Chem. Phys., 1963, 38, 2686–2689 CAS.
- International Union of Crystallography (IUCr), International Tables for Crystallography, Kluwer Academic, Norwell, MA, 2004, vol. C, pp. 796–811 Search PubMed.
- M. J. Frisch, G. W. Trucks, H. B. Schlegel, G. E. Scuseria, M. A. Robb, J. R. Cheeseman, G. Scalmani, V. Barone, B. Mennucci, G. A. Petersson, H. Nakatsuji, M. Caricato, X. Li, H. P. Hratchian, A. F. Izmaylov, J. Bloino, G. Zheng, J. L. Sonnenberg, M. Hada, M. Ehara, K. Toyota, R. Fukuda, J. Hasegawa, M. Ishida, T. Nakajima, Y. Honda, O. Kitao, H. Nakai, T. Vreven, J. A. Montgomery Jr, J. E. Peralta, F. Ogliaro, M. Bearpark, J. J. Heyd, E. Brothers, K. N. Kudin, V. N. Staroverov, R. Kobayashi, J. Normand, K. Raghavachari, A. Rendell, J. C. Burant, S. S. Iyengar, J. Tomasi, M. Cossi, N. Rega, J. M. Millam, M. Klene, J. E. Knox, J. B. Cross, V. Bakken, C. Adamo, J. Jaramillo, R. Gomperts, R. E. Stratmann, O. Yazyev, A. J. Austin, R. Cammi, C. Pomelli, J. W. Ochterski, R. L. Martin, K. Morokuma, V. G. Zakrzewski, G. A. Voth, P. Salvador, J. J. Dannenberg, S. Dapprich, A. D. Daniels, Ö. Farkas, J. B. Foresman, J. V. Ortiz, J. Cioslowski and D. J. Fox, Gaussian 09 (Revision D.01), Gaussian, Inc., Wallingford CT, 2009 Search PubMed.
-
(a) C. Møller and M. S. Plesset, Phys. Rev., 1934, 46, 618–622 CrossRef;
(b) J. Gauss, J. Chem. Phys., 1993, 99, 3629–3643 CrossRef CAS;
(c) J. Gauss, Ber. Bunsen-Ges. Phys. Chem., 1995, 99, 1001–1008 CrossRef CAS.
- T. Lu, Multiwfn: Multifunctional wavefunction analyzer, http://Multiwfn.codeplex.com Search PubMed.
- F. Biegler-König, The AIM2000 program (Version 2.0) is employed to analyze and visualize atoms-in-molecules, J. Comput. Chem., 2000, 21, 1040–1048 CrossRef . See also ref. 21b.
- W. Nakanishi and S. Hayashi, J. Phys. Chem. A, 2013, 117, 1795–1803 CrossRef CAS PubMed.
- The S–S distance in 1 (S, S) is longer than that in 1-NapS–SNap-1′, which will be discussed elsewhere.
- A. Bondi, J. Phys. Chem., 1964, 68, 441–451 CrossRef CAS.
- E. D. Glendening, C. R. Landis and F. Weinhold, J. Comput. Chem., 2013, 34, 1429–1437 CrossRef CAS PubMed.
- W. Nakanishi, S. Hayashi, M. B. Pitak, M. B. Hursthouse and S. J. Coles, J. Phys. Chem. A, 2011, 115, 11775–11787 CrossRef CAS PubMed.
Footnote |
| † Electronic supplementary information (ESI) available: QTAIM-DFA approach, Cartesian coordinates for optimized structures of 1–4. CCDC 1811040. For ESI and crystallographic data in CIF or other electronic format see DOI: 10.1039/c7ra13636f |
|
| This journal is © The Royal Society of Chemistry 2018 |

 Open Access Article
 This Open Access Article is licensed under a
  *a,
Lucy K. Mappb and
Simon J. Coles
*a,
Lucy K. Mappb and
Simon J. Coles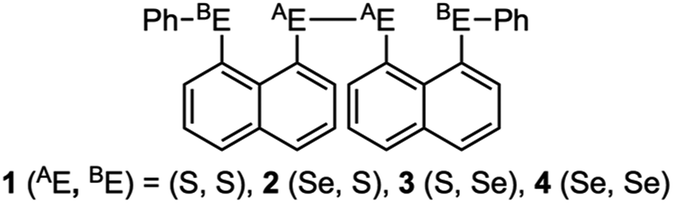

 modulated by the density normalized, real spherical harmonics angular functions dlm±(r/r) defined on local axes centered on the atoms and with population parameters Plm±.
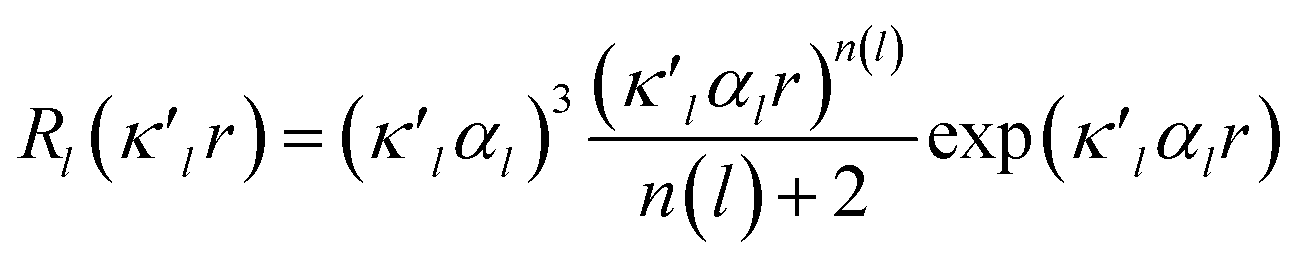
 is given by eqn (2), where n(l) ≥ 1 obeys Poisson's electrostatic equation and values for αl are estimated from the Hartree–Fock optimized single-ξ exponents of the valence orbital wave function calculated for free atoms. Scattering factors for C, H and S were derived from the wave functions tabulated by Clementi and Roetti.40 As shown in the literature, the use of default values of n(l) = (4,4,4,4) and αl for second-row atoms (P, S) may lead to ambiguous results.38,41 Thus, several models described previously42,43 were tested and finally n(l) = (4,4,6,8) values were used. An identical set of n(l) was used to refine the experimental data of another hypervalent sulfur-nitrogen species44,45 as well as in experimental studies of L-cysteine.46 The αl parameter was kept constant at 3.851ao−1.47 Initially, only the scale factor was refined for all data. Next, accurate positional and displacement parameters for all non-hydrogen atoms were obtained from the high order refinement (sin(θ/λ) > 0.7 Å−1), while positional and isotropic displacements for hydrogen atoms were refined using low-angle data (sin(θ/λ) < 0.7 Å−1). Due to the unavailability of neutron data, all C–H distances were fixed to the averaged distances from neutron studies48 (e.g., dCarom–H = 1.083 Å). During the next stages of refinement, monopole, dipole, quadrupole, octupole and hexadecapole populations were refined with the single expansion/contraction κ parameter in a stepwise manner. The expansions over the spherical harmonics were truncated at the hexadecapolar level [lmax = 4] for the sulfur-bonded atoms (AS, BS, Ci, ⋯) and at the octupolar level [lmax = 3] for the remaining carbon. Hydrogen atoms were represented by the bond directed dipole. Finally, a single κ′ parameter was refined for all non-hydrogen atoms. Chemically and symmetry related atoms were constrained to share the same expansion/contraction (κ/κ′) parameters. Throughout, the multipole refinement expansion/contraction parameters (κ/κ′) of all hydrogen atoms were fixed to values κ = 1.20 and κ′ = 1.20. This procedure was repeated several times in a block refinement until satisfactory convergence was achieved. Chemical constraints for similar atoms were applied at the initial stages of the refinements. These constraints were gradually released and the final model was chemically unconstrained. The electron neutrality condition was imposed on the molecule for the entire refinement. Final multipole refinement led to a featureless residual density map (Fig. S4 in the ESI†). The overall residual density after multipole refinement with all high order data was −0.24 ≤ ∇2 and ρ ≤ 0.25 e Å−3.