
 Open Access Article
 This Open Access Article is licensed under a
 Creative Commons Attribution 3.0 Unported Licence
Electrospinning of CeO2 nanoparticle dispersions into mesoporous fibers: on the interplay of stability and activity in the HCl oxidation reaction
Maren Möller,
Nikolay Tarabanko,
Claas Wessel,
Rüdiger Ellinghaus,
Herbert Over* and
Bernd M. Smarsly *
*
Physikalisch-Chemisches Institut, Justus-Liebig-Universität Gießen, 35392 Gießen, Germany. E-mail: herbert.over@phys.chemie.uni-giessen.de; Bernd.Smarsly@phys.Chemie.uni-giessen.de
First published on 19th December 2017
Abstract
CeO2 nanoparticles with diameters of ca. 6 nm were synthesized using a microwave-based synthetic route, enabling dispersions in various unipolar solvents. From these dispersions, CeO2 nanofibers were prepared by electrospinning followed by heat treatment at 550 °C in air, possessing mesoporosity with BET surface areas larger than 100 m2 g−1. This mesoporosity is due to a nanoscale separation between the nanoparticles and the spinning polymer. The well-defined CeO2 fibers were used as catalysts in the HCl oxidation reaction (Deacon process), and the catalytic parameters (space-time yield (STY), oxygen storage capacity (OSC), and the so-called complete oxygen storage capacity (OSCc)) were compared with recently reported nanoscopic CeO2 materials. It is found that the fibers and also the particles themselves show comparably high activity (STY), which correlates with a high OSCc value, in comparison with CeO2 materials possessing larger particle sizes. This correlation implies that the entire particles, not only the surface, are involved in oxidation reactions. In the HCl oxidation reaction, the fiber morphology is degraded and the surface area is substantially decreased, but the activity is still quite high after 60 h on stream, and no chlorination is detectable by X-ray Diffraction, in contrast to CeO2 materials with larger particle sizes. These findings demonstrate that the stability and activity of CeO2-based catalysts can only be scrutinized by a material comprising both a high surface area and well-defined morphology.
Introduction
In recent years, research on CeO2-based materials has been intensified, as rare-earth oxides emerged as a promising materials in heterogeneous catalysis of various redox reactions, owing to the reversible transformation between the Ce3+ and Ce4+ oxidation states.1 Based on the reversible uptake and release of oxygen CeO2 acts as an oxygen buffer and can thus spur oxidation reactions.2 Also, CeO2 is reported as a catalyst for hydrogenation reactions.3,4 These reactions often impose harsh conditions on both the setup and the CeO2 catalyst itself in terms of elevated temperature and pressure, as well as due to highly corrosive reaction conditions as encountered with the HCl oxidation reaction (Deacon reaction: eqn (1)).2| 2HCl + 0.5O2 → H2O + Cl2 |
| ΔRH° = −58.5 kJ mol−1 and ΔRG° = −11.0 kJ mol−1, (T = 703 K) | (1) |
Aside from CeO2, several other metal oxides can serve as catalysts in the HCl oxidation reaction, especially RuO2,5 CuCrO2,6 and even uranium-based materials (U3O8).7
In particular, CeO2-based catalysts were proposed as promising alternatives for RuO2/TiO2-based catalysts in the catalyzed HCl oxidation reaction.2,8,9 In particular, it was emphasized that the optimization of CeO2-based catalysts needs to focus on activity as well as stability.10 Composites of CeO2 with other metal oxides such as Al2O3 and ZrO2 were suggested as means to stabilize CeO2 under harsh reaction conditions.11 In recent studies we showed that electrospun fibers of CeO2 and CexZr1−xO2 possessing uniform diameters of approx. 100–200 nm and large aspect ratios provide a useful means to qualitatively assess the catalyst's stability with respect to the HCl oxidation reaction.12–14 As a main finding it was demonstrated that for this corrosive reaction the breakdown of the fiber morphology – being easily visualized by Scanning Electron Microscopy (SEM) images – represents an indicator for chemical transport and sintering processes of the catalyst during reaction.12–14 Also, it was observed that fibers made of Ce-rich mixed Ce–Zr oxide solid solutions (e.g. Ce0.80Zr0.20O2) were quite stable under HCl-rich conditions.12 By contrast, for pure CeO2 fibers morphological changes and the concomitant formation of CeCl3 were observable and thus evidenced alterations of the catalyst upon harsh reaction conditions. However, the fiber materials prepared in these previous studies possessed only small mesopore volumes and BET surface areas, with typical values on the order of ca. 10–30 m2 g−1 only.13 Hence, electrospun fibers possessing significantly higher surface areas and mesopore volumes (ca. 100 m2 g−1) are desirable for the further fundamental understanding of the interplay between activity and stability, as corrosion reactions in general are surface processes. Increasing the surface area of CeO2-based fibers would enhance the rate of both types of reactions, namely the HCl oxidation and possible corrosion reaction(s). While the activity of our previously reported fibers possessing ca. 30 m2 g−1 was already promising,12–15 higher surface areas can thus enable to further assess and understand the corrosion reactions and stability of the catalyst.
The interior of these previously reported fibers does not possess a high mesopore volume or surface area owing to the synthetic pathway: typically, these fibers are generated by electrospinning a solution based on a volatile solvent, containing a molecular metal compound such as CeCl3 and a polymer, the latter primarily providing sufficient viscosity. For the final CeO2 or cerium–zirconium oxide fiber, removal of the polymer and the crystallization are achieved by treatment at elevated temperature in the presence of oxygen, typically at a temperature of at least 600 °C, resulting in the loss of nanoscaled porosity due to sintering.12–14 Hence, uniform CeO2-based fibers – pure CeO2 as well as mixed oxides CexZr1−xO2 – featuring both, high crystallinity and appreciable nanoscaled porosity (i.e. large BET surface areas of ca. 100 m2 g−1) can hardly be obtained by the aforementioned procedure.12–14
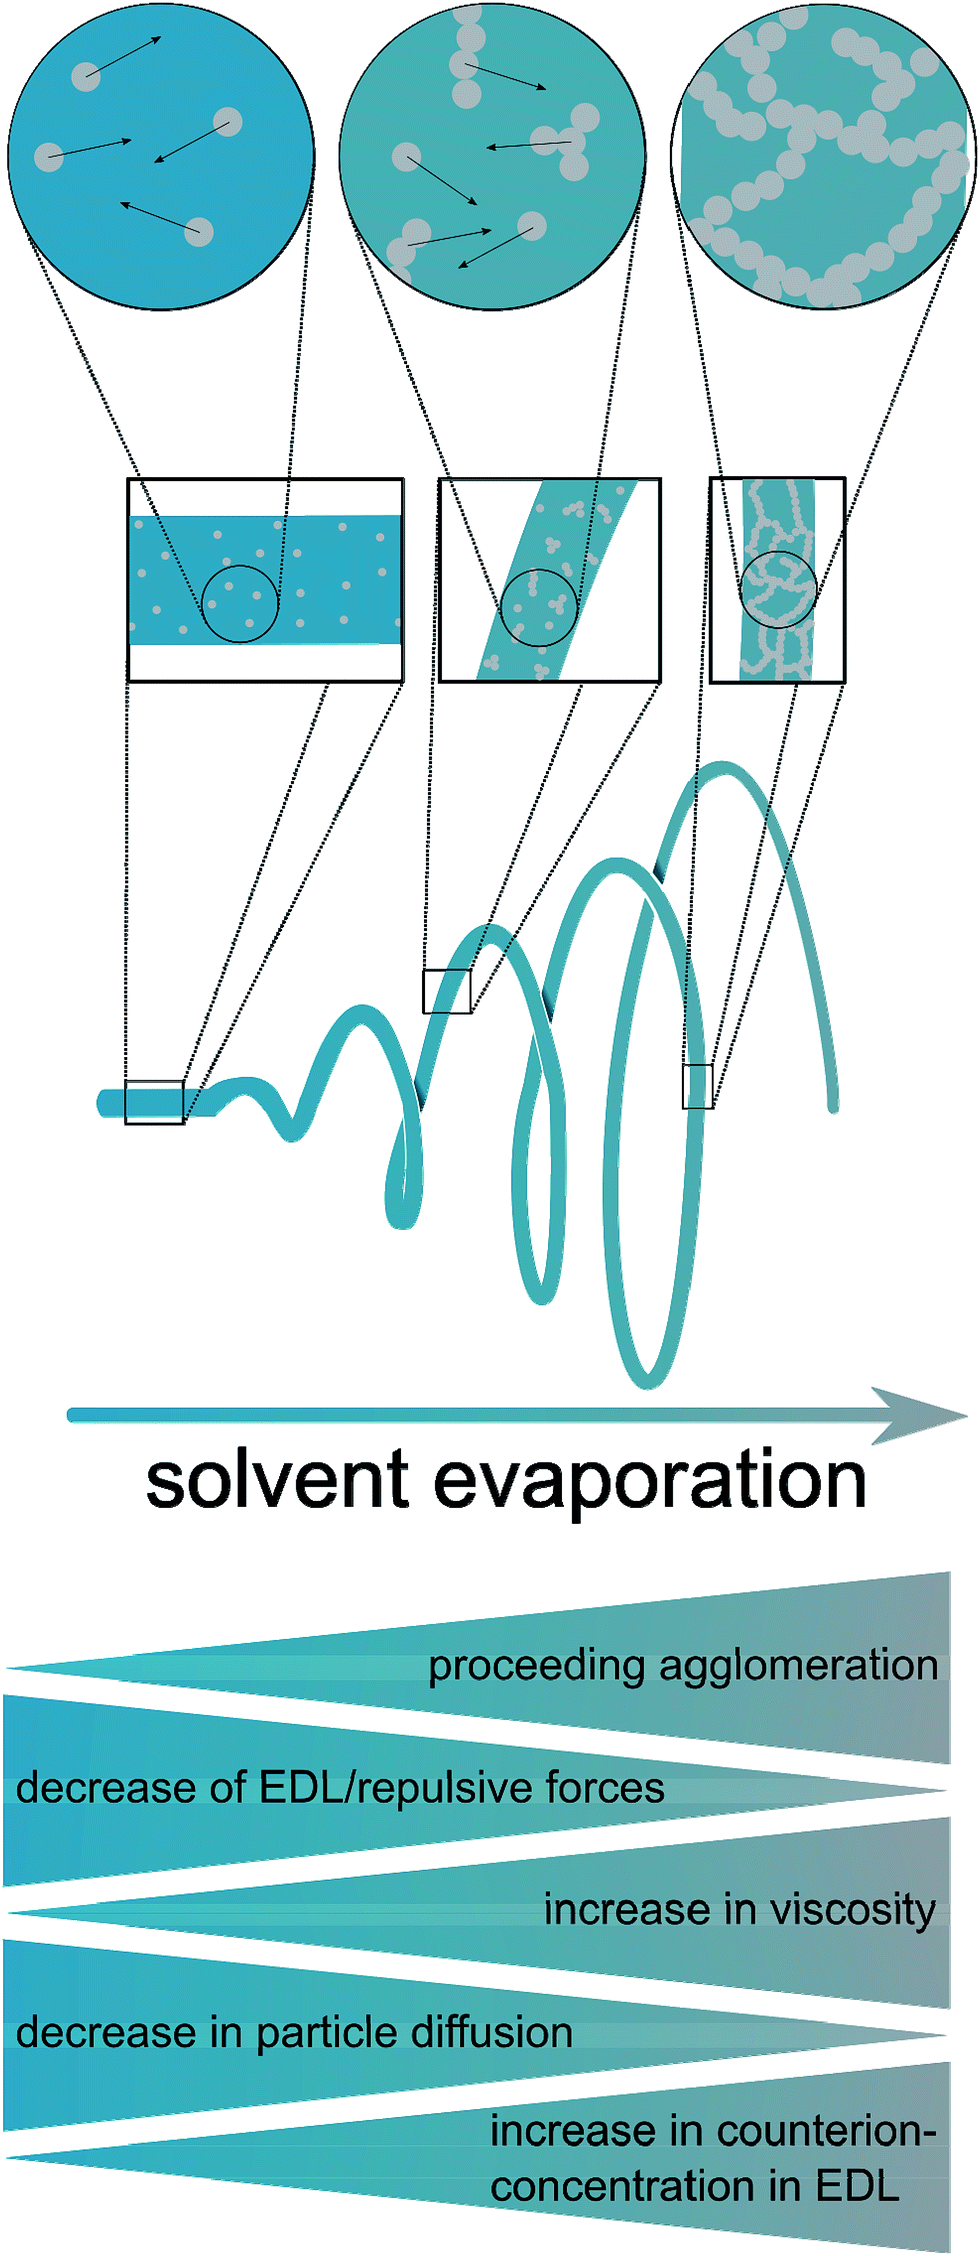
Based on these considerations, the present study was dedicated to the generation of fibers of CeO2 prepared by electrospinning dispersions of preformed crystalline CeO2 particles with a diameter in the small nanometer range, and studying the stability in the HCl oxidation reaction, as proposed recently.15 It can be assumed that the resulting fibers possess high surface areas, owing to interparticle space (Scheme 1 and Fig. 1). Using preformed CeO2 nanoparticles allows separating the control of chemical composition from the electrospinning process. The feasibility of using dispersions of preformed metal oxide nanoparticles for producing mesoporous fibers by electrospinning was demonstrated in a case study on TiO2 nanofibers.16 Scheme 1 shows the processes taking place during the electrospinning that might lead to the desired porous nanofibers.
 | ||
| Scheme 1 Processes during the electrospinning leading to porous fibers. | ||
 | ||
| Fig. 1 SEM images of CeO2 fibers indicating the mesoporosity inside the fibers. | ||
At first glance, this approach appears straightforward in the light of numerous publications and expertise on the synthesis of CeO2 nanoparticles. However, the basic principle of electrospinning enforces the usage of a sufficiently volatile solvent, which on the one hand dissolves a suitable organic polymer (e.g. poly(ethylene oxide), poly(vinyl pyrrolidone)) and on the other hand is able to stabilize a colloidal dispersion of CeO2 nanoparticles. These requirements impose sharp restrictions in the choice of solvents and can thus be fulfilled by only a small number of organic solvents. Typically, electrospinning processes use solvents such as ethanol, CHCl3 and tetrahydrofurane (THF), which means that the highly crystalline CeO2 nanoparticles need to be dispersible in one of these solvents. In addition, the particles should possess an average diameter of a few nanometers, in order to achieve a high surface area, see Scheme 1. Also, the synthesis of such CeO2 nanoparticles should allow for finely tuning the particle size. Hence, the generation of fibers by electrospinning dispersions of crystalline CeO2 nanoparticles requires a synthetic methodology providing CeO2 nanoparticles with quite distinct properties.
Several methods for the synthesis of ceria nanoparticles are known in literature. One of the best known and widely used method is the benzyl alcohol-based synthesis introduced by Niederberger et al.17 A variety of synthetic approaches was summarized by Bumajdad et al.18 However, only few strategies have been reported CeO2 nanoparticles being dispersible in CHCl3, CH2Cl2 or THF, as needed for electrospinning, especially in combination with polymers typically used for electrospinning. The synthesis developed in this work is based on the approach presented by Yu et al., who introduced a synthesis providing small spherical CeO2 nanoparticles possessing an average diameter of ca. 3–4 nm, which can be dispersed in several organic solvents.19 In order to facilitate this formula and to allow for a fine tuning of particle sizes, the synthesis was adapted in the present study to a microwave-based procedure. Niederberger recently reported a microwave-based synthesis of CeO2 nanoparticles,17c which however does not provide nanoparticles being dispersible in the organic solvents required. Based on the synthesis by Yu et al.,19 we report in the present study a straightforward protocol enabling the synthesis of crystalline CeO2 nanoparticles possessing tunable particle diameters and being dispersible in the required organic solvents. As a major goal of this study, we investigated a suitable formula for the generation of mesoporous fibers by electrospinning using poly(ethylene oxide) as typical spinning polymer.
Furthermore, the mesoporous CeO2 fibers were subjected to catalytic tests in the Deacon reaction, using the reactor applied in our previous publication.12–14 These experiments were used to clarify the influence of small nanoparticle sizes and, hence, an increased surface area of electrospun CeO2 fibers on the activity yield as well as the stability of the fibers. In particular, the HCl oxidation reaction was also performed on materials prepared from molecular precursors, possessing low surface areas. The space-time yield (STY) and also the oxygen storage capacity (OSC) as well as the complete oxygen storage capacity (OSCc) were compared with the values for previously reported nanoscopic CeO2 materials used in the HCl oxidation reaction. In particular, these parameters are discussed with the results of recent studies on shape-controlled CeO2 nanoparticles, namely rods, cubes and octahedrons with (110), (100) and (111) orientation, respectively.20
Results and discussion
Synthesis strategy
As recently exemplified with the generation of TiO2 nanofibers by electrospinning of a TiO2 nanoparticle dispersion,16 the usage of suitable solvent mixtures can result in quite high surfaces areas of up to approximately 130 m2 g−1, based on a phase-separation between the nanoparticles, the polymer and the solvent, akin to a spinodal-phase separation. As shown in ref. 16, such separation on the nanometer scale leads to a final surface area being larger than the mere interstitial porosity of the nanoparticles. Based on these requirements, only few solvents appeared to be suitable for the dispersion of CeO2 nanoparticles, for instance chloroform (CHCl3) and tetrahydrofurane (THF) which are able to dissolve electrospinning polymers such as poly(ethylene oxide) (PEO) and poly(vinyl pyrrolidone) (PVP). A main challenge of the present study was therefore the development of a synthesis of highly crystalline CeO2 nanoparticles possessing sufficient colloidal stability in a multi-component mixture of solvents and electrospinning polymer. In order to achieve such a high colloidal stability, the average diameter of the nanoparticles should not exceed ca. 10 nm.In the present study, the original benzyl alcohol-based synthesis of CeO2 nanoparticles introduced by Niederberger et al.17a was modified to generate CeO2 nanoparticles being dispersible in ethanol.17b As the originally aqueous nanoparticle dispersion requires a delicate dialysis against pure ethanol, this process turned out to be inappropriate for a dispersion being suitable for electrospinning. Our approach is therefore based on the synthesis by Yu et al.19 which uses a heating step at 320 °C. Such high temperatures can be problematic, as most heating plates coupled with a magnetic stirrer possess a higher limit of 250 °C only. Also, the reaction of Yu takes several hours. By adapting the synthesis route to a microwave reactor, the reaction temperature was decreased to 200 °C and the total synthesis time (including preparations, the actual synthesis, separation and redispersion of the particles) was reduced to less than one hour.
The microwave-based synthesis developed in this study (Scheme 2) provided well dispersible CeO2 nanoparticles, forming colloidal dispersions with a weight percentage of typically 4 wt%. Feasible solvents include chloroform, dichloromethane, hexane, toluene and diethyl ether, although dispersions in the latter were instable due to the low boiling point of diethyl ether.
 | ||
| Scheme 2 Schematic illustration of the nanoparticle and fiber synthesis. All heating steps during the nanoparticle synthesis were carried out using a microwave reactor. | ||
Characterization of the nanoparticles
As main benefit of our synthetic route, the variation of reaction time within the microwave enabled a fine-tuning of the nanoparticle size with the particles being of high crystallinity. As seen in Fig. 2, the XRD patterns of particles obtained by applying reaction times of 1 min and 2 min (200 °C, respectively) are characteristic of crystalline CeO2 (cubic phase), and the significant width of the reflections indicates nanometer-scaled diameters of the nanoparticles. Since the nanoparticles' shape can be regarded as spherical (see TEM results in Fig. 2), the average particle diameter was inferred from the integral width of the (002) reflection (see Exp. section), which was well separable. Such analysis provided average particle diameter of 6 nm for both reaction times (1 min and 2 min).Raman spectroscopy provided a well-defined signature, which is in accordance with the cubic phase of CeO2 (Fig. 2, center left). The main signals can be assigned as F2g mode (460 cm−1),21 2TA mode (255 cm−1), 2LO mode (1175 cm−1)22 and defect-induced modes (590 cm−1).23–25 A mode at 828 cm−1 can be assigned to peroxo-like species originating from molecular oxygen adsorbed on two electron defects.25 Since Raman spectroscopy is much more sensitive towards phase impurities than XRD, we can conclude that the nanoparticles do not contain other crystalline substances, e.g. Ce salts.
 | ||
| Fig. 2 Upper left: XRD pattern of the as-synthesized ceria nanoparticles. (a) Reaction time: 1 min; (b) reaction time: 2 min; reference: JCPDS-number 00-034-0394; upper right: TG/MS analysis (using synthetic air) of the CeO2 nanoparticles differing in the reaction time at 200 °C. The upper curves correspond to thermogravimetry, the lower ones to mass spectrometry detecting water (m/z = 18) and carbon dioxide (m/z = 44); center left: Raman spectrum of the as-synthesized ceria nanoparticles (reaction time 2 min). Laser wavelength: 532 nm, 10 mW; center right: Infrared spectrum of the as-synthesized ceria nanoparticles (reaction time 2 minutes), oleylamine and calcined ceria nanoparticles as a reference; lower left: Dynamic light scattering (DLS) analysis of the as-synthesized ceria nanoparticles dispersed in chloroform. (a–d) Particle size distributions obtained for two reactions times (a and b: 1 min; c and d: 2 min), and determined by two types of analysis, namely the number-based distributions (b and d) and the intensity-weighted distributions (a and c); lower right: TEM images of the ceria nanoparticles. (a) Electron diffraction pattern of particles with a reaction time of 1 min; (b) TEM image of particles prepared using a reaction time of 1 min; (c) TEM image of particles prepared using a reaction time of 2 min; (d) zoomed TEM image of particles obtained after a reaction time of 2 min. | ||
TEM measurements (Fig. 2, lower right) of the dried particles revealed well isolated CeO2 nanoparticles with almost ideal spherical shape, similar to the study of Yu et al.19 From these images an average diameter of 5 nm was determined for both samples. In addition, the TEM images reveal an internal crystalline make-up of the nanoparticles (i.e. low fraction of amorphous CeO2), being in conformity with Raman spectroscopy and XRD.
The characterization of the nanoparticles was complemented by DLS analysis performed on the particle dispersions (Fig. 2, lower left). The number-based size distributions revealed a maximum at approx. 6 nm (1 min reaction time) and approx. 13 nm (2 min reaction time), with the latter being attributable to a certain degree of agglomeration. The asymmetric shape of the number-based particle size distribution is in agreement with the TEM images, showing only particle sizes being larger than ca. 5 nm (1 min reaction time). It should be noted that the intensity-based size distribution determined from DLS showed a maximum at ca. 20 nm (1 min reaction time) and ca. 40 nm (2 min reaction time). This apparent contradiction can be explained by the fact that even a small concentration of larger particles strongly contributes to the DLS signal and, thus, to the size distribution based on the measured intensity. In conclusion, from the DLS analyses it can be inferred that the CeO2 nanoparticles exhibit only a weak tendency for agglomeration, in that the particles form small agglomerates containing ca. 1–2 particles on the average.
In order to assess the influence of relevant parameters, the temperature and precursor concentration were systematically varied. Upon raising the reaction temperature of the first heating step from 90 °C to 120 °C no nanoparticles could be precipitated. Next, the synthesis was performed using only 50% of the precursor concentration whilst keeping the other parameters unchanged, including the amounts of the other reactants. This approach yielded particles with a diameter of about 17 nm, as determined by dynamic light scattering (DLS).
The pronounced colloidal stability is, together with the small size, based on the decoration of the nanoparticles with organic groups. Infrared (IR) spectroscopy and thermogravimetric analysis (TGA) were employed to identify and quantify the organic moieties on the nanoparticles' surface. IR spectroscopy (Fig. 2, center right) revealed strong signals at 2923 and 2853 cm−1 being attributed to the C–H stretching vibrations of oleylamine.
TGA (Fig. 2, upper right) showed a significant content of organic moieties linked to the CeO2 nanoparticles, amounting to ca. 18 wt% (1 min reaction time) and ca. 23 wt% (2 min reaction time). The difference can be explained by an increased thickness of the organic layer surrounding the particles. The longer the reaction time the thicker was the organic layer. The TGA data thus explain the enhanced particle diameter determined by DLS analysis. In TEM no such difference is observable between the two samples (1 min vs. 2 min reaction time), because the organic layer is hardly visible in TEM under the conditions used. These findings indicate that during the second minute of reaction only the organic layer around the particles grows, while the crystallite size remains constant. Based on these findings only the particles with a reaction time of one minute were used for the electrospinning of nanofibers.
Hence, a major challenge and advancement of the present work was the establishment of a colloidally stable dispersion of highly crystalline CeO2 nanoparticles in nonpolar solvents such as toluene, chloroform, dichloromethane, diethyl ether, hexane and others. It is worthwhile discussing the dispersions in terms of the principles of interaction between colloids. Colloidal stability requires the prevention of agglomeration and is based on a delicate interplay between electrostatic and steric interaction. In general, CeO2 nanoparticles can be expected to possess a pronounced attractive van-der-Waals interaction, because cerium being a transition metal possesses a high polarizability. This attractive interaction outbalances the electrostatic repulsion for diverse dispersions of CeO2 nanoparticles. In this respect, the stability of the dispersions prepared in the present study is surprising at a first glance. It can be explained by the fact that the final dispersions are prepared in nonpolar solvents, featuring a minute concentration of electrolyte, which in turn results in a large repulsive interaction (large Debye length), possibly exceeding the attractive van-der-Waals interaction. The addition of poly(ethylene oxide) destabilizes the colloidal dispersion due to flocculation, so that the dispersion used for electrospinning is only stable for several hours.
Preparation and characterization of the nanofibers
The nanoparticle dispersions were subsequently utilized to prepare solutions for electrospinning. Poly(ethylene oxide) (PEO) with a molecular weight of 300![[thin space (1/6-em)]](https://www.rsc.org/images/entities/char_2009.gif) 000 g mol−1 appeared as most suitable polymer in terms of enabling stable solutions. PEO with a molecular weight of 1000000 g mol−1 leads to precipitation in the solutions, also being too viscous to spin. The CeO2 content of the dispersions based on PEO possessing a molecular weight of 300000 g mol−1 was 2.8 wt%. A lower CeO2 content led to a breakdown of the fiber structure after calcination, while a higher content resulted in an electrical conductivity of the spinning solution being too high for the electrospinning process. Two different solvent mixtures (chloroform only and chloroform/hexane (mass ratio 1:1.4)) were employed to study their influence on surface area and pore volume of the fibers. Both solvent mixtures yielded fiber mats with homogeneous fiber diameters. Fibers prepared with chloroform as the only solvent showed larger mesopore volumes, as calculated from nitrogen physisorption measurements by NLDFT (non-localized density functional theory). In detail, a formula was developed providing fiber mats with quite uniform fiber diameters of ca. 500 nm (Fig. 3, upper left, showing calcined CeO2 fibers), preserving a defined fiber morphology even after heat treatment in air at 550 °C (Fig. 3, upper right). The mass fraction of CeO2 of the as-spun fibers was approx. 43%, as revealed by TGA (Fig. 3, lower). This finding is in good agreement with the theoretical value of 44% that can be calculated from the amounts of CeO2 and polymer used for the fiber synthesis. TGA performed in air also showed that at this temperature no significant amount of organic moieties was left on the fibers. Based on the results from TGA the calcination temperature for the fiber samples was lowered to 350 °C, while a lower calcination temperatures of 300 °C showed substantial carbon residues in the sample.
000 g mol−1 appeared as most suitable polymer in terms of enabling stable solutions. PEO with a molecular weight of 1000000 g mol−1 leads to precipitation in the solutions, also being too viscous to spin. The CeO2 content of the dispersions based on PEO possessing a molecular weight of 300000 g mol−1 was 2.8 wt%. A lower CeO2 content led to a breakdown of the fiber structure after calcination, while a higher content resulted in an electrical conductivity of the spinning solution being too high for the electrospinning process. Two different solvent mixtures (chloroform only and chloroform/hexane (mass ratio 1:1.4)) were employed to study their influence on surface area and pore volume of the fibers. Both solvent mixtures yielded fiber mats with homogeneous fiber diameters. Fibers prepared with chloroform as the only solvent showed larger mesopore volumes, as calculated from nitrogen physisorption measurements by NLDFT (non-localized density functional theory). In detail, a formula was developed providing fiber mats with quite uniform fiber diameters of ca. 500 nm (Fig. 3, upper left, showing calcined CeO2 fibers), preserving a defined fiber morphology even after heat treatment in air at 550 °C (Fig. 3, upper right). The mass fraction of CeO2 of the as-spun fibers was approx. 43%, as revealed by TGA (Fig. 3, lower). This finding is in good agreement with the theoretical value of 44% that can be calculated from the amounts of CeO2 and polymer used for the fiber synthesis. TGA performed in air also showed that at this temperature no significant amount of organic moieties was left on the fibers. Based on the results from TGA the calcination temperature for the fiber samples was lowered to 350 °C, while a lower calcination temperatures of 300 °C showed substantial carbon residues in the sample.
 | ||
| Fig. 3 Upper left: SEM image of ceria nanofibers calcined at 550 °C for 3 h (heating rate 5 K min−1), using poly(ethylene oxide) as spinning polymer (molecular weight 300000 g mol−1) and chloroform as solvent; upper right: SEM image of calcined ceria nanofibers spun with poly(ethylene oxide) (molecular weight 300000 g mol−1) and using chloroform as solvent; center left: Nitrogen physisorption experiment: adsorption–desorption isotherm (T = 77 K) of the calcined ceria nanoparticles and fiber samples. All samples were synthesized using nanoparticles prepared using a reaction time of 1 min in the microwave reactor (see Experimental part); center right: Non-localized density functional theory (NLDFT) cumulated pore volume of the calcined ceria nanoparticles and fiber samples (determined from the adsorption branch), assuming a cylinder model; lower: Thermogravimetric analysis of as-spun ceria nanofibers. Atmosphere: synthetic air, heating rate 5 K min−1. | ||
The mesoporosity of the nanofibers was studied by nitrogen physisorption analysis (77 K) (Fig. 3). The nanoparticle-based CeO2 fibers possessed a BET surface area of ca. 120–130 m2 g−1 and a mesopore volume of 0.29–0.35 mL g−1 (Fig. 3 and Table 1). For comparison, CeO2 nanofibers were prepared using molecular precursors, following our previous publications.12–14 These fibers exhibited a significantly smaller mesoporosity (approx. 40 m2 g−1 and a mesopore volume of 0.16 mL g−1). Furthermore, also CeO2 nanoparticles obtained by drying and calcining the dispersions showed a comparably small BET surface area and small mesopore volume (Table 1).
| Sample | Surface area (BET)/m2 g−1 | Pore volume (NLDFT)/cm3 g−1 | Pore volume determined at p/p0 = 0.97/cm3 g−1 |
|---|---|---|---|
| Nanoparticle-based fibers (chloroform) | 120 | 0.29 | 0.29 |
| Nanoparticle-based fibers (hexane/chloroform) | 130 | 0.35 | 0.35 |
| Molecular precursor based fibers | 25 | 0.07 | 0.16 |
| Calcined nanoparticles | 30 | 0.02 | 0.02 |
Thus, these reference experiments proved that the relatively large mesoporosity of the CeO2 particle-based nanofibers was due to the special phase-separation occurring within the electrospinning process, being in accordance with our previous study.16 The particle-based synthesis of nanofibers can thus be regarded as suitable and straightforward procedure to endow nanofibers with a substantial BET surface area larger than 100 m2 g−1. In order to further enlarge the surface area and mesopore volume of the fibers, hexane was used to disperse the nanoparticles. The dispersion was mixed with a solution of poly(ethylene oxide) (PEO) in chloroform, as poly(ethylene oxide) is not soluble in hexane. N2 physisorption revealed that the phase separation in this sample led to an even larger mesopore volume and surface area in such samples.
Reactivity and stability in HCl oxidation
Catalytic tests were carried out as specified in the Experimental chapter with particle-derived fibers spun from a spinning solution with chloroform as the sole solvent, as well as with molecular precursor fibers (Fig. 4). | ||
| Fig. 4 Upper left: Space time yield (STY) of chlorine in the HCl oxidation reaction in the catalytic tests using particle-derived fibers versus operation duration. Temperature during the reaction was T = 703 K. For the descriptions of the “mild” and “harsh” conditions see the Experimental section; upper right: space-time yield (STY) of chlorine in the HCl oxidation reaction in the catalytic tests with molecular-precursor-derived fibers versus operation duration. The temperature during the reaction was T = 703 K. For the descriptions of the “mild” and “harsh” conditions see the Experimental section; lower: XRD of the particle-based fibers used in the catalytic tests. | ||
Table 2 contains the physisorption results for the fiber samples before reactive treatment, and after either “harsh” or “mild” treatment (see the Experimental section for the experimental parameters). The BET surface and area and pore volume substantially decrease for the samples used in the HCl oxidation reaction. As a control experiment, the physisorption results are also provided for particle-based fibers before and after treatment for 60 h under air at T = 703 K (different production batch, hence the difference in porosity in Table 3), proving that enhanced temperature alone does not significantly decrease the BET surface area and mesoporosity. It is thus the harsh HCl oxidation reaction which is responsible for the marked decrease in surface area (Table 2).
| Sample | Surface area (BET)/m2 g−1 | Pore volume (DFT)/cm3 g−1 |
|---|---|---|
| Molecular precursor, before treatment | 25 | 0.07 |
| Molecular precursor, mild conditions | 14 | 0.04 |
| Molecular precursor, harsh conditions | 19 | 0.06 |
| Particle precursor, before treatment | 120 | 0.29 |
| Particle precursor, mild conditions | 60 | 0.30 |
| Particle precursor, harsh conditions | 40 | 0.23 |
| Sample | Surface area (BET) [m2 g−1] | Pore volume (DFT) [cm3 g−1] |
|---|---|---|
| Before treatment | 140 | 0.18 |
| Temperature treatment only | 130 | 0.17 |
As shown in Fig. 4 the chlorine Space-Time Yield (STY) of the particle-derived fiber samples is approximately twice as high in comparison with the fibers derived from molecular precursor. This finding is attributable to the larger specific surface area the particle-based catalyst possesses. With both types of fibers, the chlorine yield steadily, but slowly decreases over the course of the experiment, with no signs of stabilizing in 60 h. Concomitantly, both types of fibers exhibit markedly decreased specific surface area and pore volume after the reactive treatment which suggests that sintering of particles and fibers takes place during the catalytic process (Table 2). However, it is noteworthy that even after a treatment of 60 h under either “mild” or “harsh” experiments the particle-derived fibers maintain a greater surface area, porosity, and STY than the molecular precursor fibers exhibit initially. The continuous decrease in STY between 0 h and 60 h on stream is moderate, especially in regard to the marked morphological transformation of the particles (see below). Interestingly, the STY is not correlated to the BET surface for both types of catalyst samples, neither for “mild” nor “harsh” category, which is seen by comparing the STY normalized to the BET surface for the beginning and the end of the oxidation reaction (60 h). In essence, the BET surface is strongly decreased und harsh conditions, but the residual surface is quite active. This subject requires a separate study and falls outside the scope of the present work.
To gain deeper understanding of the phenomena involved in the degradation of the particle precursor catalysts, SEM imaging (Fig. 5) and XRD analysis (Fig. 4, lower) were carried out. The corresponding data for the molecular precursor-derived fibers are available elsewhere.13 Temperature treatment in air preserves the majority of the original fibrous morphology (Fig. 3, lower left), but this is hardly the case when the reactive environment of the HCl oxidation reaction is involved, which is in line with Tables 2 and 3. Even though the particle-derived fibers lose their initial catalytic activity at approximately the same rate as the non-porous fibers (Fig. 4), SEM images reveal that under the “mild” reactive conditions the porous fibers suffer extensive damage, and the “harsh” conditions lead to their complete disintegration (Fig. 5). Under the same conditions, molecular-precursor-based fibers composed of CeO2–ZrO2 solid solutions preserve their fibrous morphology considerably better.13 While CeO2–ZrO2 is generally considered as more stable in the Deacon process, these fibers possessed a much lower surface area than in the present case, thus reducing the rate of the corrosive reactions.
 | ||
| Fig. 5 SEM images of the particle-based fibers used in the catalytic tests: as-prepared sample (topmost), after “harsh” and “mild” reactive tests, and after thermal treatment in air. | ||
Degradation of the CeO2 catalysts' fibrous structure during HCl oxidation can be linked to the transformation of cerium dioxide into the trichloride.20 However, the XRD patterns of the particle-based fibers measured after the Deacon reaction exhibit no discernible reflections attributable to cerium chlorides (Fig. 4, bottom), even under “harsh” conditions. In fact, the diffractograms do not reveal any crystalline phases other than ceria. By contrast, substantial amounts of CeCl3 were detected by XRD in our previous publication on pure CeO2 fibers under comparable conditions regarding the HCl oxidation.12 The only major difference in these two studies lies with the much larger pore volume and surface area and, concomitantly, the markedly smaller particle size in the present study. Since a larger surface area of our CeO2 materials is correlated with a larger catalytic activity (see Table 4), at first glance a larger degree of corrosion (formation of CeCl3) is expected, which surprisingly is not the case. Chlorination might take place at the particles' surface, which however is not detectable by XRD. The XRD reflections of the samples used in the HCl oxidation process are moderately narrower than the reflections of the as-prepared fibers, corresponding to an average particle diameter of ca. 8 nm. This finding suggests that the particles constituting the porous fibers undergo coalescence under the reactive conditions, leading to larger crystallites in the catalyst that endured the Deacon reaction atmosphere. Based on this finding, the disintegration of the used fibers can be explained as follows: as neighboring constituting particles coalesce, the fiber can be possibly ruptured because of the mechanic strain involved in forming larger crystallites. Such coalescence will create cavities within the fiber, and numerous cavities formed in this manner would negatively affect the fiber's mechanical stability, finally leading to disintegration of the fibers. Taking into account that no observable CeCl3 formation is observed, we speculate that temporary chlorination occurs at the particles' surface, forming CeCl3. When CeCl3 reacts with O2 and H2O, Ce–OH groups are formed, the condensation of which between adjacent particles results in particle growth.
| CeO2-material | BET surface area/m2 g−1 | OSC/μmol g−1 | OSC/μmol m−2 | OSCc/μmol g−1 |
|---|---|---|---|---|
| CeO2 particles (5 nm) (ref. 26), same particles as in this work | ||||
| 120 | 30 | 0.25 | 170 | |
| Shape-controlled particles (ref. 20) | ||||
| Rods | 77 | 56 | 0.73 | 156 |
| Cubes | 22 | 10 | 0.45 | 102 |
| Octahedrons | 6 | 3 | 0.5 | 57 |
| CeO2 nonporous fibers (ref. 15) | ||||
| 25 | 22 | 0.8 | 100 | |
In order to further understand the main parameters affecting the reactivity of pure nanoscopic CeO2 materials in the HCl oxidation reaction, we compared the STY, oxygen storage capacity (OSC) and complete OSC (OSCc) of the particle-based fibers with other pure CeO2 materials which were published by our group (Tables 4 and 5) since 2013. Since the STY and the OSC/OSCc were always determined using identical experimental conditions and since several of the materials were independently studied in separate studies, a comparison of these parameters is meaningful. For instance, CeO2 fibers prepared from molecular precursors were synthesized and studied in three different works. In addition, the STY and OSC/OSCc were studied on nanoscopic shape-controlled CeO2 nanoparticles (rods, cubes, octahedrons), with respect to the HCl oxidation reaction.20 We showed that the rods are the most active particles, followed by the cubes and the octahedrons. The same trend holds true for the complete oxygen storage capacity (OSCc), suggesting a correlation between the observed STY and the OSCc. In addition, the rods were most stable under “harsh” conditions, but were the most active at the same time. This finding might pertain to the different exposed facets of the rods, cubes and octahedrons, but the rods also possessed the smallest particle size compared to the other types of particles (Table 5).
| STY “harsh”/mol kgcat−1 h−1 (value after 60 h) | STY “harsh”/10−4 mol m−2 h−1 (60 h), (BET surface area taken after 60 h in m2 g−1) | |
|---|---|---|
| CeO2 particles (5 nm) (ref. 26) | ||
| 27 | 9 (30) | |
| CeO2 particle-based fibers, this work (6 nm) | ||
| 23 | 5.8 (40) | |
| CeO2-particle fibers (6 nm) (ref. 15) | ||
| 14 | 3.5 (40) | |
| Shape-controlled particles (ref. 20) | ||
| Rods | 23 | n.a. |
| Cubes | 9 | n.a. |
| Octahedrons | 4 | n.a. |
| CeO2 nonporous fibers (ref. 15) | ||
| 8 | n.a. | |
| CeO2 nonporous fibers (ref. 12) | ||
| 11 | 4.9 (22.4) | |
| CeO2 nonporous fibers (this work) | ||
| 9 | 4.7 (19) | |
Comparing the different CeO2 materials (Tables 4 and 5), it is seen that the particles/fibers used in the present study exhibit the highest OSCc values per gram, being comparable with the rods described in ref. 20. These materials possess both a small crystallite size and, hence, a large surface area. Interestingly, facetted rods and the particles used in this study also possess a relatively high STY (after 60 h under “harsh” condition) in comparison with cubes and octahedrons and fibers prepared from molecular precursors, if normalized to the mass or the surface area (Table 5). These values suggest that the OSCc, but not the OSC, correlates with the STY, both parameters increasing with decreasing particle size. Apparently, for such small particles with diameters of a few nanometers the entire particle participates in oxidation reactions, i.e. the particle interior is largely involved in the reaction, not only the surface. Furthermore, it is interesting to note that both, rods with (110) orientation as well as small nanoparticles do not show CeCl3 in XRD experiments and are, thus, surprisingly stable against chlorination.20 The comparably small decay in STY after 60 h is in agreement with the absence of substantial amounts of CeCl3, in that the chlorination of CeO2 is directly related to inactivation of CeO2 in the HCl oxidation reaction.27 Such stable STY values under highly corrosive conditions for two types of pure CeO2 nanomaterials, the 6 nm-particles in the present study as well as the preferentially oriented rods (ca. 10 nm in diameter), point to a higher stability against chlorination because of the small particle dimensions in both cases. We speculate that the small dimensions of these CeO2 nanoparticles modify the surface energy and hence the thermodynamic driving force for chlorination reactions. However, surface facets might play an equally important role in the HCl oxidation reaction. Further studies need to clarify the origin of high stability, reactivity and OSCc values of (110)-oriented rods as well as the present particles.
In a very recent publication,27 it was shown that several possible reaction need to be considered regarding the chlorination of CeO2 in the HCl oxidation reaction:
| CeO2 + 4HCl ⇄ CeCl3 + 2H2O + 1/2Cl2 |
| CeO2 + 3HCl ⇄ CeCl3 + 3/2H2O + 1/4O2 |
| CeO2 + 3/2Cl2 ⇄ CeCl3 + O2 |
In that study,26 we investigated the impact of the amount of water on the HCl oxidation reaction of shape-controlled CeO2 particles and found that it exhibits a very strong impact on the stability, i.e. the equilibrium on the aforementioned reactions. A main finding is the stability of CeO2 even under “harsh” conditions (identical conditions as in the present study), if the temperature is well controlled and not reduced when the reaction is stopped, because the aforementioned reactions are exothermic.
These insights indicate that small nanoparticles of pure CeO2 might be rendered stable even under “harsh” conditions for prolonged time in the HCl oxidation reaction, if the particle size is in the range of only a few nanometers and if the process parameters are well chosen.
Nanoparticles of mixed CexZr1−xO2 and corresponding mesoporous fibers prepared thereof would therefore be a strategy to enhance the stability of such fibers, as solid solutions CexZr1−xO2 possess higher stability in the HCl oxidation reaction than pure CeO2.12,13 However, the CexZr1−xO2 nanoparticles reported in literature17a are not dispersible in solvents suitable or electrospinning under the required conditions, and our synthesis generating CeO2 nanoparticles cannot be directly used to provide nanoparticles of mixed CexZr1−xO2 possessing the required large Zr content.
Experimental section
Ceria nanoparticle synthesis
The synthesis of the ceria nanoparticles was based on the synthesis developed by Yu et al.19 It was adapted as a microwave synthesis. 0.85 g of cerium(III) nitrate hexahydrate was mixed with 10 mL of oleylamine in a 30 mL glass microwave vial and stirred on a magnetic stirrer for 10 min. The orange mixture was transferred into the microwave and heated to 90 °C for 1 min. The color of the mixture switched to violet. 1 mL of diethyl ether were added and the resulting mixture was heated to 200 °C for either 1 or 2 min. The resulting beige mixture was poured into ethanol to collect the particles. The particles were retrieved by centrifugation and washed with ethanol. Possible solvents for dispersions were toluene, chloroform, dichloromethane, diethyl ether, hexane and other non-polar solvents. To obtain the nanoparticle powder for characterization the dispersion was dried at 90 °C.Ceria fiber synthesis from nanoparticles
For the synthesis of the nanofibers a suspension of freshly prepared nanoparticles in chloroform or hexane was mixed with a solution of poly(ethylene oxide) (M = 300000 g mol−1) in chloroform. The solution contained 2.9 wt% of poly(ethylene oxide) and 2.2 wt% of CeO2. The weight percentages of the components are given in Table 6. The solution was stirred until it was homogeneous and loaded into a plastic syringe with a steel needle. The syringe was placed in a syringe pump and the needle was connected to a high voltage power supply. The counter electrode, a round collector covered with aluminum foil, was connected to a high voltage power supply of the opposite polarity. The power supplies were used to create an electric field of about 1 kV cm−1. The distance between the electrodes was about 10 cm. This set up was placed in a chamber that was flushed with compressed air to reduce the humidity of the spinning atmosphere. The as-spun fibers were calcined at 550 °C (later 350 °C) for 3 h with a heating rate of 5 K min−1.
| Mass percentage of | Solution 1 (chloroform only) | Solution 2 (chloroform/hexane) |
|---|---|---|
| Chloroform | 94.9 | 38.8 |
| Hexane | — | 56.2 |
| Poly ethylene oxide | 2.9 | 2.8 |
| CeO2 | 2.2 | 2.2 |
Fiber synthesis of non-porous ceria fibers
To prepare the spinning solution for the non-porous ceria fibers 246 mg CeCl3·7H2O, 609 mg methanol, 604 mg ethanol and 220 mg N,N-dimethyl formamide were mixed and heated to 125 °C for 10 min. Ethanol was added to the clear solution until 1600 mg of solution were reached. 1013 mg of poly vinyl pyrrolidone (M = 1.3 × 10⁶ g mol−1) solution (15 wt% in ethanol) and 120 mg of water were added. The mixture was stirred until homogeneous, filled into a syringe, and spun into fibers in the same manner as explained above. The polymer was removed by calcination at 550 °C for 3 h (heating rate 5 K min−1).Characterization
XRD measurements were carried out using a X'Pert Pro by Panalytical (Cu Kα, λ = 0.15418 nm). The average particle size D was determined by D = 1/B, where B is the integral width of a well separable reflection. The nitrogen physisorption experiments were carried out using an Autosorb 6 by Quantachrome at T = 77 K. The samples were degassed in vacuum for about 30 h at 120 °C. The surface area was determined using the BET method, and the pore size distributions were calculated via an NLDFT approach, using the adsorption branch of the isotherm. A cylindrical pore kernel (adsorptions branch) for the system silica/nitrogen (77.4 K) was assumed. The SEM images were taken with a Merlin SEM by Zeiss. To reduce charging effects the samples were sputtered with platinum. For the dynamic light scattering (DLS) measurements a StabiSizer by ParticleMetrix was used. The thermogravimetric measurements were carried out using a STA 409 PC/PG by NETZSCH. Transmission electron microscopy (TEM) was performed on a Philips CM30 instrument operated at 300 kV. Copper mesh grids were used for the sample preparation. Infrared spectroscopy was carried out using a IFS25 instrument by Bruker Optics. The spectra were measured from 4000 to 450 cm−1. The samples were pressed into KBr pellets for the measurement. For the Raman spectroscopy, a Senterra spectrometer by Bruker Optics was used. The laser wavelength was 532 nm and the laser energy was 10 mW.Catalytic tests
Catalytic activity of the fiber samples towards hydrogen chloride oxidation was assessed using a flow reactor with a fixed catalyst bed. In this setup, an initial gaseous reactant mixture of a certain composition is fed at a constant volumetric flow rate through a catalyst bed which is held fixed in a tubular reactor (the catalyst bed fills the entire cross-section of the reactor). Such operation is principally similar to the operation of industrial catalytic fixed-bed reactors, and the results of the experiment can serve as a reasonable estimate of how the catalyst in question will perform in practical application and what improvements need to be made. The concentration of the product (chlorine) generated during the contact of the reactants with the catalyst is measured photometrically in real time in the reactor effluent. This experimental approach easily enables real-time long-term monitoring of changes in the catalytic activity (here catalytic activity is used synonymously to space time yield: the amount of the product per unit catalyst mass per unit time), as assuring long-term performance stability is critical to a catalyst's practical suitability. However, assessing the changes in a catalyst sample requires the reactor shutdown after a desired reaction time and subsequent ex situ analyses.The activity measurements were carried out with an installation specifically designed for corrosive gases such as HCl and Cl2 at atmospheric pressures, its general layout is described elsewhere.12 Temperature of the reactor (containing 30 mg of a catalyst) during the reaction is maintained by a vertical cylindrical electric furnace controlled by a PID regulator (Eurotherm 2416), feedback was provided by a type K thermocouple (located in a thermowell inside the reactor immediately downstream of the catalyst bed). The gases used are HCl (Air Liquide, quality 2.8), O2 (Air Liquide, 4.8) and Ar (Praxair, 5.0). Argon is additionally dried using a water absorption cartridge (ALPHAGAZ purifier H2O free, from Air Liquide). The gases are managed at desired flow rates by means of electronic mass flow controllers (MKS Instruments 1179B). Upon leaving the reactor the gas mixture passes through a glass condenser where the water produced in the Deacon reaction is trapped to prevent condensation in the photometric cell. Remaining gases are photometrically analyzed for Cl2 content at the 329 nm wavelength in a PTFE flow optical cell (FIAlab SMA Z-cell, 50 mm optical path length) together with a light source (Ocean Optics DH-2000-BAL with a deuterium bulb) and a spectrometer (Ocean Optics USB4000) all connected by optical fibers. After the analysis, the remaining gases are bubbled through aqueous NaOH solution and released into the atmosphere.
Two different protocols were used for the used for the catalytic experiments. “Mild” treatment means that the reactor is flushed by argon at room temperature and heated to the reaction temperature (to 703 K at the rate of 10 K min−1) under argon flow. When the target temperature is reached, the flow is replaced by 10 vol% HCl and 20 vol% O2 balanced in Ar with the total flow rate of 15 sccm (standard-conditions cubic centimeters per minute). At the end of an experiment the reactor is again flushed with argon at 15 sccm and is allowed to cool down under this inert flow. “Harsh” treatment means that the reactor is first flushed with the reactant mixture (in this case, 20 vol% HCl and 20 vol% O2 balanced in Ar, 15 sccm total) at room temperature, then the reactor is heated under this reactant flow (to 703 K at the rate of 10 K min−1). At the end of the experiment the reactor is allowed to cool down under the same reactant flow. Since higher HCl concentrations and exposure to HCl at lower temperatures make transformation of CeO2 into CeCl3 more thermochemically favorable,15,27 these “mild” (less HCl, inert atmosphere during heating and cooling) and “harsh” (more HCl, HCl atmosphere during heating and cooling) conditions represent the opposite extremes in terms of corrosive aggressiveness of the experimental conditions towards the catalyst.
Conclusions
The present study introduces a synthesis for colloidal dispersions of crystalline CeO2 nanoparticles of small diameters (6 nm) enabling the generation of mesoporous CeO2 fibers with well-defined diameters using electrospinning. Despite the inevitable temperature treatment at elevated temperatures (550 °C) and the consequent sintering the fibers possess a BET surface area larger than 100 m2 g−1, which can be attributed to a nanoscaled separation between the nanoparticles and the spinning polymer (PEO). Such BET surface areas are substantially larger than the surface area of the interstitial porosity of the nanoparticles themselves, and also larger than the BET surface area of fibers generated by using molecular Ce compounds for electrospinning. The catalytic tests revealed that high-surface area CeO2 exhibits pronounced catalytic activity, but marked degradation of the fiber morphology indicates corrosion of pure CeO2. Our study proved that the catalyst's degradation is a consequence of the chemical reaction between the catalyst and the Deacon reactants during the catalytic conversion of HCl to Cl2, and not due to sintering caused by the elevated temperature. However, the XRD patterns showed almost no changes even under harsh conditions. Recent insights on shape-controlled CeO2 nanoparticles used in the HCl oxidation reaction20 showed that rod-like particles with (110)-orientation are quite active and do not show CeCl3 formation, similar to the CeO2 nanoparticles in the present study. Furthermore, pure CeO2 nanoparticles show stable performance in the HCl oxidation reaction in the presence of water.27 Hence, the present study suggests that small CeO2 nanoparticles undergo chlorination, but CeCl3 is formed only temporarily and on the surface. It appears as if the high surface-to-volume ratio modifies both, the reactivity for the formation of CeCl3 and also the oxygen storage capacity, as these materials are surface-dominated.The question why our quite small CeO2 nanoparticles are surprisingly stable is thus complex and needs to be studied separately. It will be addressed in a separate study in our group, involving detailed quantitative chemical analysis of chlorine in the CeO2 material after the catalytic reaction under various conditions (“harsh” vs. “mild”), e.g. using XPS and other techniques. In particular, the stability will be studied as a function of the particle size, as our findings suggest that particle size itself might enhance the stability against chlorination reactions. Furthermore, it is important to clarify if the Ce3+ concentration in such small nanoparticles is different compared to larger CeO2 grains, owing to intrinsic strain.28 We believe that the study therefore sets the starting point for further, detailed studies for assessing the properties of CeO2 materials in general.29
One possible solution to the stability problem can be using nanoparticles of CeO2–ZrO2 solid solutions as catalysts which are both highly stable against chlorination20 and against sintering.12,29 The synthesis of dispersible nanoparticles of zirconia-doped ceria and fibers generated thereof represents a significant challenge, because the presented protocol cannot be directly transferred to such solid solution.
Conflicts of interest
There are no conflicts to declare.Acknowledgements
This project was supported by the Center for Materials Research (LaMa) at Justus-Liebig-Universität Giessen. We acknowledge financial support within the LOEWE program of excellence of the Federal State of Hessen (project initiative STORE-E). The authors thank Pascal Vöpel and Tobias Weller (Physikalisch-Chemisches Institut, Justus-Liebig-Universität Gießen) for the TEM images, Hubert Wörner (Institut für Anorganische und Analytische Chemie, Justus-Liebig-Universität Gießen) for the TG analysis, Hans P. Reisenauer (Institut für Organische Chemie, Justus-Liebig-Universität Gießen) for measuring the infrared spectra, and Dr Limei Chen (I. Physikalisches Institut, Justus-Liebig-Universität Gießen) for her help with the analysis of the Raman spectra.Notes and references
- A. Trovarelli, Catal. Rev., 1996, 38, 439–520 CAS.
- A. P. Amrute, C. Mondelli, M. Moser, G. Novell-Leruth, N. Lopez, D. Rosenthal, R. Farra, M. E. Schuster, D. Teschner, T. Schmidt and J. Perez-Ramirez, J. Catal., 2012, 286, 287–297 CrossRef CAS.
- G. Vilé, S. Colussi, F. Krumeich, A. Trovarelli and J. Pérez-Ramírez, Angew. Chem., Int. Ed., 2014, 53, 12069–12072 CrossRef PubMed.
- G. Vilé, S. Wrabetz, L. Floryan, M. E. Schuster, F. Girgsdies, D. Teschner and J. Pérez-Ramírez, ChemCatChem, 2014, 6, 1928–1934 CrossRef.
- K. Seki, Catal. Surv. Asia, 2010, 14, 168–175 CrossRef CAS.
- A. P. Amrute, G. O. Larrazábal, C. Mondelli and J. Pérez-Ramírez, Angew. Chem., Int. Ed., 2013, 52, 9772–9775 CrossRef CAS PubMed.
- F. Krumeich, A. P. Amrute, C. Mondelli and J. Pérez-Ramírez, Z. Anorg. Allg. Chem., 2014, 640, 768–773 CrossRef CAS.
- J. Pérez-Ramírez, C. Mondelli, T. Schmidt, O. F.-K. Schlüter, A. Wolf, L. Mleczko and T. Dreier, Energy Environ. Sci., 2011, 4, 4786–4799 Search PubMed.
- H. Over and R. Schomäcker, ACS Catal., 2013, 3, 1034–1046 CrossRef CAS.
- G. Ertl, Handbook of heterogeneous catalysis, VCH, 1997 Search PubMed.
- M. Moser, C. Mondelli, T. Schmidt, F. Girgsdies, M. E. Schuster, R. Farrac, L. Szentmiklósi, D. Teschner and J. Pérez-Ramírez, Appl. Catal., B, 2013, 132–133, 123–131 CrossRef CAS.
- C. H. Kanzler, S. Urban, K. Zalewska-Wierzbicka, F. Hess, S. F. Rohrlack, C. Wessel, R. Ostermann, J. P. Hofmann, B. M. Smarsly and H. Over, ChemCatChem, 2013, 5, 2621–2626 CrossRef CAS.
- S. Urban, N. Tarabanko, C. H. Kanzler, K. Zalewska-Wierzbicka, R. Ellinghaus, S. F. Rohrlack, L. Chen, P. J. Klar, B. M. Smarsly and H. Over, Catal. Lett., 2013, 143, 1362–1367 CrossRef CAS.
- C. Kanzler, H. Over, B. M. Smarsly and C. Wessel, in Atomically-Precise Methods for Synthesis of Solid Catalysts, ed. S. Hermans and T. V. de Bocarme, Royal Society of Chemistry, 2014, pp. 198–224 Search PubMed.
- M. Möller, H. Over, B. Smarsly, N. Tarabanko and S. Urban, Catal. Today, 2015, 253, 207–218 CrossRef.
- C. Wessel, R. Ostermann, R. Dersch and B. M. Smarsly, J. Phys. Chem. C, 2011, 115, 362–372 CAS.
- (a) A. S. Deshpande, N. Pinna, P. Beato, M. Antonietti and M. Niederberger, Chem. Mater., 2004, 16, 2599–2604 CrossRef CAS; (b) A. S. Deshpande, N. Pinna, B. Smarsly, M. Antonietti and M. Niederberger, Small, 2005, 1, 313–316 CrossRef CAS PubMed; (c) S. Hilaire, L. Luo, F. Rechberger, F. Krumeich and M. Niederberger, Z. Anorg. Allg. Chem., 2014, 640, 733–737 CrossRef CAS.
- A. Bumajdad, J. Eastoe and A. Mathew, Adv. Colloid Interface Sci., 2009, 147–148, 56–66 CrossRef CAS PubMed.
- T. Yu, J. Joo, Y. I. Park and T. Hyeon, Angew. Chem., Int. Ed., 2005, 44, 7411–7414 CrossRef CAS PubMed.
- C. Li, Y. Sun, I. Djerdj, P. Voepel, C.-C. Sack, T. Weller, R. Ellinghaus, J. Sann, Y. Guo, B. M. Smarsly and H. Over, ACS Catal., 2017, 7, 6453–6463 CrossRef CAS.
- V. G. Keramidas and W. B. White, J. Chem. Phys., 1973, 59, 1561–1562 CrossRef.
- W. H. Weber, K. C. Hass and J. R. McBride, Phys. Rev. B: Condens. Matter Mater. Phys., 1993, 48, 178–185 CrossRef CAS.
- Z. Wu, M. Li, J. Howe, H. M. Meyer and S. H. Overbury, Langmuir, 2010, 26, 16595–16606 CrossRef CAS PubMed.
- A. Filtschew, K. Hofmann and C. Hess, J. Phys. Chem. C, 2016, 120, 6694–6703 CAS.
- Y. M. Choi, H. Abernathy, H.-T. Chen, M. C. Lin and M. Liu, ChemPhysChem, 2006, 7, 1957–1963 CrossRef CAS PubMed.
- M. Möller, et al., ChemCatChem, 2015, 7(22), 3738–3747 CrossRef.
- C. Li, F. Hess, I. Djerdj, G. Chaia, Y. Sun, Y. Guoa, B. M. Smarsly and H. Over, J. Catal., 2018, 357, 257–262 CrossRef.
- C. B. Gopal, et al., Nat. Commun., 2017, 8, 15360 CrossRef PubMed.
- A. Trovarelli, Catalysis by Ceria and Related Materials, Imperial College Press, 2002 Search PubMed.
| This journal is © The Royal Society of Chemistry 2018 |