A thieno[3,4-b]thiophene linker enables a low-bandgap fluorene-cored molecular acceptor for efficient non-fullerene solar cells†
Haijun
Fan
 a,
Thomas
Vergote
a,
Shengjie
Xu
a,
Shanshan
Chen
b,
Changduk
Yang
a,
Thomas
Vergote
a,
Shengjie
Xu
a,
Shanshan
Chen
b,
Changduk
Yang
 b and
Xiaozhang
Zhu
 *ac
*ac
aBeijing National Laboratory for Molecular Sciences, CAS Key Laboratory of Organic Solids, Institute of Chemistry, Chinese Academy of Sciences, Beijing 100190, China. E-mail: xzzhu@iccas.ac.cn
bDepartment of Energy Engineering, School of Energy and Chemical Engineering, Low Dimensional Carbon Materials Center, Ulsan National Institute of Science and technology (UNIST), Ulsan 689-798, South Korea
cUniversity of Chinese Academy of Sciences, Beijing 100049, China
First published on 18th January 2018
Abstract
A low-bandgap small-molecule acceptor NFTI with a fluorene central core, 2-(2,3-dihydro-3-oxo-1H-inden-1-ylidene) propane-dinitrile end groups and thieno[3,4-b]thiophene linkers was designed and synthesized for bulk-heterojunction organic solar cell applications. NFTI exhibits broad absorption with a low optical bandgap of approximately 1.57 eV in the thin film state. An optimized power conversion efficiency (PCE) of 9.02% with a high short-circuit current of 17.8 mA cm−2 was achieved with diphenyl ether (DPE) and 2,3,5,6-tetrafluoro-7,7,8,8-tetracyanoquinodimethane (F4-TCNQ) binary-processing additives. According to the detailed morphological investigation, we found that binary-processing additives helped to reduce the size of nanocrystals and enhance the intermolecular interaction, which led to improved charge separation and transport in the BHJ thin film, and thus achieved high device performance.
1. Introduction
As a feasible technique for solar energy conversion, competitive advantages of organic solar cells have been demonstrated such as low cost, lightweight and flexibility.1–3 With decades of development, both the design strategy of photoactive materials and device processing techniques are gradually improving, which contributes to the fast enhancement of power conversion efficiency (PCE). Solution-processed single-junction bulk-heterojunction (BHJ) organic solar cells with PCEs above 10% are no longer rare.4–7 In high-performance organic solar cells, fullerene derivatives8–10 were generally adopted as the electron acceptor to blend with polymer or small-molecule donors to form a bulk heterojunction to achieve effective photo-electricity conversion. Despite superior properties such as high electron affinity and electron mobility, fullerene derivatives have several drawbacks such as high-cost synthesis and purification, weak absorption in the Vis-NIR region and poor energy-level tunability.11 As a possible solution, non-fullerene acceptors have emerged.12,13 Current reports indicate that non-fullerene acceptors have already surpassed their fullerene counterparts in terms of PCE.14–16 To further improve the device performance to a more ideal value for commercialization, there is an urge to explore the precise design as well as deep deciphering of the relationship between the molecular structure and device performance.Concerning the molecular design, no matter for the donor or acceptor materials, an effective way is to construct a D–A molecular configuration, where D represents the electron-rich moiety and A denotes the electron-deficient one. With intramolecular charge transfer (ICT) properties, the photoelectric properties of such D–A type molecules can be finely tuned. In particular, the A–D–A configuration with an electron-donating unit as the core and two strong electron-withdrawing units as the terminals has been proved to be effective for designing molecular acceptors.11,13,17–21 Besides the proper matching of D–A units, the linkage unit between D and A is equally important because the linker could effectively affect the absorption, energy level, and charge transport as well as the morphology by modulating π-frameworks of the target materials.22–24 Recently, we have demonstrated the application of a fused quinoidal 2-alkylthieno[3,4-b]thiophene (TbT)25 unit for the design of small-molecule donors STB-n with an A–Q–D–Q–A arrangement and achieved promising device performance.26,27 Compared with the thiophene linker, the TbT unit can extend the π-conjugation by enhancing quinoid resonance28,29 in the target molecules, leading to an increased photoresponse. Such a strategy was also extended to the design of small-molecule acceptors. With ester-substituted TbT linkers, low-bandgap molecular acceptors including ATT-1,30 ATT-231 and ATT-332 with a fused indacenodithiophene (IDT) core have been designed and synthesized, which show favourable spectral-matching with molecular donors of different bandgaps for photovoltaic applications.
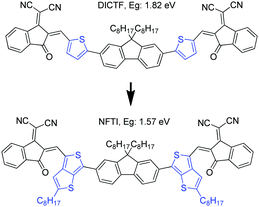
Besides IDT, fluorene11,17,33 as another commonly used building block, was introduced as the central core for calamitic shaped molecular acceptors normally bearing an A1–A2–D–A2–A1 arrangement. Chen et al. also reported a fluorene-based molecular acceptor DICTF with a bandgap of 1.82 eV, which renders a photocurrent of 16.3 mA cm−2.17 Peng et al. demonstrated an effective fluorene-based molecular acceptor SFBRCN with a large optical bandgap of 2.05 eV and achieved a photocurrent of 17.2 mA cm−2 by blending with a low-bandgap polymer donor PTB7-Th.33 However, such fluorene-cored acceptors generally show quite large optical bandgaps, attributed to the weak electron-donating nature of fluorene and twisted molecular geometry induced by a large steric hindrance that inevitably weakened the ICT, which limits the effective utilization of solar irradiation.
In this work, a narrow bandgap fluorene-cored molecular acceptor was achieved through TbT linkage. The compound (NFTI, Fig. 1) comprises a weak electron-donating fluorene core and two strong electron-withdrawing 2-(2,3-dihydro-3-oxo-1H-inden-1-ylidene)propanedinitrile terminal groups linked by quinoidal 2-alkyl-substituted TbT. Though bearing a similar molecular arrangement except the linkage unit, NFTI shows a much lower optical bandgap than DICTF, 1.57 vs. 1.82 eV, while the lowest unoccupied molecular orbital (LUMO) energy level remains the same as that of DICTF. Considering its low bandgap characteristic, a large-bandgap polymer donor, poly[(2,6-(4,8-bis(5-(2-ethylhexyl)thiophen-2-yl)-benzo[1,2-b:4,5-b′]dithiophene))-alt-(5,5-(1′,3′-di-2-thienyl-5′,7′-bis(2-ethylhexyl)benzo[1′,2′-c:4′,5′-c′]dithiophene-4,8-dione))]),34 known as PBDB-T (Fig. S1, ESI†), was blended with NFTI to fabricate bulk-heterojunction solar cells. Upon device optimization, non-fullerene solar cells based on the PBDB-T:NFTI photoactive blend obtained an optimal PCE of 9.02%, achieving both high short circuit current (17.82 mA cm−2) and open circuit voltage (0.902 V) with small energy loss (0.67 eV). Compared to the moderate PCE (∼5.93%) of PBDB-T:DICTF-based devices,18 the notable performance improvement achieved by the PBDB-T:NFTI photovoltaic system strongly suggests that the TbT linkage is an effective designing strategy to achieve low bandgap high-performance non-fullerene acceptor materials.
2. Results and discussion
Material preparation
The synthetic route of NFTI is shown in Scheme 1. The starting material tributyl(2-hexylthieno[3,4-b]thiophen-6-yl)stannane 1 was synthesized according to our previous report.35 The Stille-coupling reaction of compound 1 with 2,7-dibromo-9,9-dioctyl-9H-fluorene produces compound 2. After the formylation reaction of compound 2 followed by a Knoevenagel condensation reaction with 2-(3-ethyl-4-oxothiazolidin-2-ylidene)malononitrile, the targeted molecular acceptor NFTI was obtained.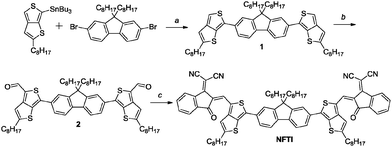 | ||
| Scheme 1 Synthesis of NFTI. Reagents and conditions: (a) Pd(PPh3)4, toluene/DMF, 90 °C, 36 h, dark; (b) n-BuLi, −78 °C, 1 h, DMF, −78 °C to r.t., 1 h; and (c) INCN, CHCl3, pyridine, 75 °C, 12 h. | ||
Absorption and electrochemical properties
Fig. 2a shows the UV-Vis-NIR absorption of NFTI in chloroform and in the film state. An absorption peak at 662 nm is observed for NFTI in solution with a molar extinction coefficient (ε) of 1.77 × 10⁵ M−1 cm−1. When the NFTI film is formed, the maximum absorption peak appears at 706 nm with an ε value of 0.63 × 105 cm−1 displaying a significant redshift of 44 nm, which suggests a strong interaction of NFTI molecules. This may benefit the charge transport in real solar cell devices. Estimated from the onset of absorption in the film state, the optical bandgap of NFTI was 1.57 eV. The frontier orbital energy levels of NFTI were investigated by cyclic voltammetry measurements with ferrocene as the calibration standard. The highest occupied molecular orbital (HOMO) energy level and the LUMO energy level were determined to be −5.46 and −3.77 eV, respectively, which were based on the potential onsets of the oxidation and reduction curves (Fig. 2b). Compared with the thiophene-bridged molecular acceptor DICTF, NFTI shows a near-identical LUMO level but a slightly high-lying HOMO level, which results in a narrowed bandgap, confirmed by both CV measurements and theoretical calculations (Fig. S2, ESI†).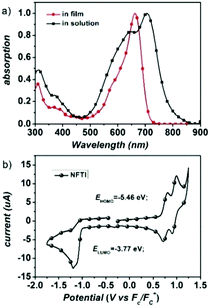 | ||
| Fig. 2 (a) Absorption spectra of NFTI in chloroform solution and in the film state. (b) Cyclic voltammogram of the NFTI film. | ||
Photovoltaic performance
BHJ organic solar cells were fabricated by applying a PBDB-T polymer donor and NFTI. All devices adopt a conventional configuration of the glass/indium tin oxide (ITO)/poly(3,4-ethylenedioxythiophene):poly(styrenesulphonate)(PEDOT:PSS)/PBDB-T:NFTI/FPI/Al multiple-layered structure. FPI is a commercially available interfacial material (Fig. S1, ESI†) developed by Jen et al.36 Detailed optimization data on device performance are summarized in Tables S1–S5 (ESI†). Typical current density–voltage (J–V) curves for optimal PBDB-T:NFTI devices are shown in Fig. 3a, detailed photovoltaic parameters are summarized in Table 1, and all data were measured under AM 1.5, 100 mW cm−2 simulated solar illumination. The optimal D/A weight ratio for the PBDB-T![[thin space (1/6-em)]](https://www.rsc.org/images/entities/char_2009.gif) :
:![[thin space (1/6-em)]](https://www.rsc.org/images/entities/char_2009.gif) NFTI system is 1
NFTI system is 1![[thin space (1/6-em)]](https://www.rsc.org/images/entities/char_2009.gif) :
:![[thin space (1/6-em)]](https://www.rsc.org/images/entities/char_2009.gif) 0.9. Utilizing both thermal annealing and processing additives (3% DPE), devices based on PBDB-T:NFTI photovoltaic blends realize a moderate PCE of 8.34% with a Voc of 0.898 V, a Jsc of 16.22 mA cm−2 and an FF of 0.57. Further optimization using a binary-additive-processing strategy achieves an even high PCE of 9.02%, exhibiting a Voc of 0.902 V, a Jsc of 17.82 mA cm−2, and an FF of 0.56. The adoption of the solid additive, 2,3,5,6-tetrafluoro-7,7,8,8-tetracyanoquinodimethane (F4-TCNQ),37 mainly improves the Jsc of the device, which is also supported by external quantum efficiency (EQE) measurements (Fig. 3b). An enhanced optoelectronic response is observed ranging across the whole visible light region (400–700 nm), indicating more efficient photoelectron conversion induced by F4-TCNQ addition. According to the integration results on EQE curves, the photocurrents are 16.94 and 15.52 mA cm−2 respectively for the device with the F4-TCNQ additive and without F4-TCNQ, errors both less than 6% compared to the Jsc measured under AM1.5, 100 mW cm−2 solar irradiation.
0.9. Utilizing both thermal annealing and processing additives (3% DPE), devices based on PBDB-T:NFTI photovoltaic blends realize a moderate PCE of 8.34% with a Voc of 0.898 V, a Jsc of 16.22 mA cm−2 and an FF of 0.57. Further optimization using a binary-additive-processing strategy achieves an even high PCE of 9.02%, exhibiting a Voc of 0.902 V, a Jsc of 17.82 mA cm−2, and an FF of 0.56. The adoption of the solid additive, 2,3,5,6-tetrafluoro-7,7,8,8-tetracyanoquinodimethane (F4-TCNQ),37 mainly improves the Jsc of the device, which is also supported by external quantum efficiency (EQE) measurements (Fig. 3b). An enhanced optoelectronic response is observed ranging across the whole visible light region (400–700 nm), indicating more efficient photoelectron conversion induced by F4-TCNQ addition. According to the integration results on EQE curves, the photocurrents are 16.94 and 15.52 mA cm−2 respectively for the device with the F4-TCNQ additive and without F4-TCNQ, errors both less than 6% compared to the Jsc measured under AM1.5, 100 mW cm−2 solar irradiation.
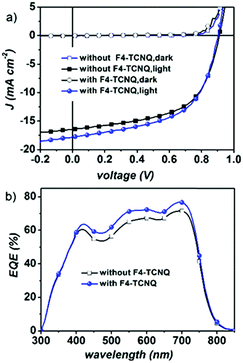 | ||
| Fig. 3 (a) Current density versus voltage (J–V) curves of PBDB-T:NFTI-based devices with/without F4-TCNQ and (b) the external quantum efficiency curves of the optimized PBDB-T:NFTI based devices. | ||
| Additive conditions | V oc (V) | J sc (mA cm−2) | FF (%) | PCEa (%) |
|---|---|---|---|---|
| a The averaged data are given in parentheses, which are collected from 24 identical devices. All devices adopt an ITO/PEDOT:PSS/donor:acceptor/FPI/Al structure. | ||||
| Without F4-TCNQ | 0.898(0.896) | 16.22(16.18) | 0.57(0.56) | 8.34(8.14) |
| With 0.01% (w/w) F4-TCNQ | 0.902(0.901) | 17.82(17.77) | 0.56(0.55) | 9.02(8.89) |
Charge transport behaviour
The space-charge limited current (SCLC) method38 was used to investigate the charge transport properties of PBDB-T:NFTI blend films. Two kinds of single-carrier transporting devices were fabricated to measure the hole and electron mobilities respectively. The hole-only device utilizes a structure of ITO/PEDOT:PSS/PBDB-T:NFTI/Au while the electron-only device adopts an Al/PBDB-T:NFTI/Al configuration. For blend films processed only with the DPE additive, the hole and electron mobilities were 3.79 × 10⁻⁴ and 1.11 × 10⁻⁵ cm2 V−1 s−1, respectively, yielding a μhole![[thin space (1/6-em)]](https://www.rsc.org/images/entities/char_2009.gif) :
:![[thin space (1/6-em)]](https://www.rsc.org/images/entities/char_2009.gif) μelectron ratio of 34
μelectron ratio of 34![[thin space (1/6-em)]](https://www.rsc.org/images/entities/char_2009.gif) :
:![[thin space (1/6-em)]](https://www.rsc.org/images/entities/char_2009.gif) 1. Once processed with the F4-TCNQ additive, the blend film obtained better charge carrier mobilities (μhole = 4.90 × 10⁻⁴ cm2 V−1 s−1; μelectron = 4.17 × 10⁻⁵ cm2 V−1 s−1) and a more balanced charge transportation (μhole
1. Once processed with the F4-TCNQ additive, the blend film obtained better charge carrier mobilities (μhole = 4.90 × 10⁻⁴ cm2 V−1 s−1; μelectron = 4.17 × 10⁻⁵ cm2 V−1 s−1) and a more balanced charge transportation (μhole![[thin space (1/6-em)]](https://www.rsc.org/images/entities/char_2009.gif) :
:![[thin space (1/6-em)]](https://www.rsc.org/images/entities/char_2009.gif) μelectron = 12
μelectron = 12![[thin space (1/6-em)]](https://www.rsc.org/images/entities/char_2009.gif) :
:![[thin space (1/6-em)]](https://www.rsc.org/images/entities/char_2009.gif) 1, see Fig. S9, ESI†), which contribute to reduced recombination. As shown in the Jsc–ILP (incident light power) plot (Fig. 4a), the bimolecular recombination did reduce in F4-TCNQ processed devices, which is probably due to the trap filling effect resulting in the decrease of the defects in the solid films.39 The charge-transport properties may also be affected by the concentration of the photo-generated charge carries under illumination. It generally results in a loss of build-in potential and suppresses the charge separation due to charge-accumulation. To examine this, we plotted the dependence of Jph to Veff (Fig. 4b). Jph is the net photocurrent defined as Jlight–Jdark, where Jlight and Jdark are the current density under illumination and in the dark, respectively. Veff is the effective applied voltage defined as Veff = V0 − V, where V is the applied voltage and V0 denotes the compensation voltage when Jph = 0,40 namely the built-in potential. We find that the built-in potential for the F4-TCNQ processed device is 20 mV lower than that of the control device, 0.98 V vs. 1.00 V, respectively, which implies a possible charge accumulation in the bulk, possibly because F4-TCNQ addition does induce additional charges. This also helps to understand why the FF for the F4-TCNQ processed device is slightly lower than that of the control one. Although both of the two devices saturate after similar Veff thresholds (∼0.4 V) and show similar Jph/Jsat values (0.82 vs. 0.816) at the short circuit point, the devices processed with F4-TCNQ display stronger ability of photocurrent generation in the low Veff region (<0.4 V) than the control device, suggesting more effective charge separation by processing with F4-TCNQ.
1, see Fig. S9, ESI†), which contribute to reduced recombination. As shown in the Jsc–ILP (incident light power) plot (Fig. 4a), the bimolecular recombination did reduce in F4-TCNQ processed devices, which is probably due to the trap filling effect resulting in the decrease of the defects in the solid films.39 The charge-transport properties may also be affected by the concentration of the photo-generated charge carries under illumination. It generally results in a loss of build-in potential and suppresses the charge separation due to charge-accumulation. To examine this, we plotted the dependence of Jph to Veff (Fig. 4b). Jph is the net photocurrent defined as Jlight–Jdark, where Jlight and Jdark are the current density under illumination and in the dark, respectively. Veff is the effective applied voltage defined as Veff = V0 − V, where V is the applied voltage and V0 denotes the compensation voltage when Jph = 0,40 namely the built-in potential. We find that the built-in potential for the F4-TCNQ processed device is 20 mV lower than that of the control device, 0.98 V vs. 1.00 V, respectively, which implies a possible charge accumulation in the bulk, possibly because F4-TCNQ addition does induce additional charges. This also helps to understand why the FF for the F4-TCNQ processed device is slightly lower than that of the control one. Although both of the two devices saturate after similar Veff thresholds (∼0.4 V) and show similar Jph/Jsat values (0.82 vs. 0.816) at the short circuit point, the devices processed with F4-TCNQ display stronger ability of photocurrent generation in the low Veff region (<0.4 V) than the control device, suggesting more effective charge separation by processing with F4-TCNQ.
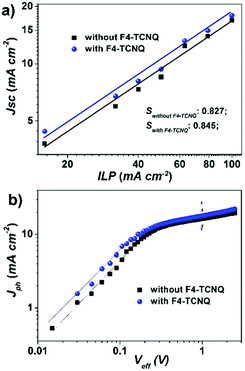 | ||
| Fig. 4 (a) Jsc dependence on the incident light power (ILP) and (b) Jph–Veff curves of PBDB-T:NFTI devices with/without F4-TCNQ additives. | ||
Film morphology
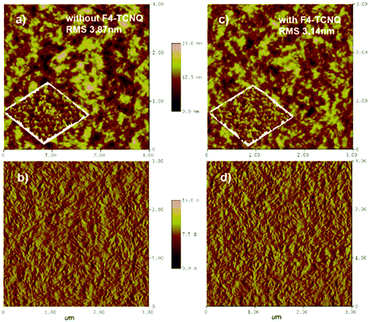
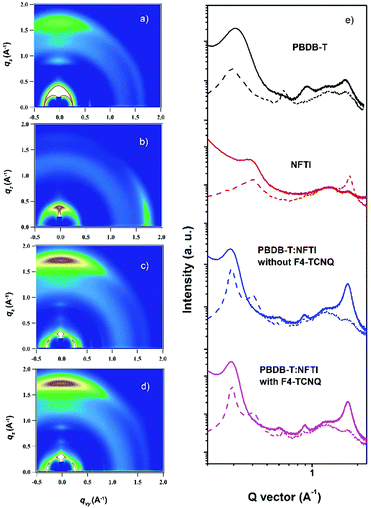
The morphology of the PBDB-T:NFTI blend films was investigated by atomic force microscopy (AFM) and transmission electron microscopy (TEM). As shown in Fig. 5, the blend films without and with F4-TCNQ are both smooth and uniform while detailed calculation on surface roughness (root-mean-squared value, RMS) shows that the two films have different surfaces. For the control film, the RMS is 3.87 nm. Comparatively, the RMS value of the F4-TCNQ-processed film is 3.14 nm. The utilization of F4-TCNQ affects the film formation and results in a less coarse surface, which associates with the formation of finer nanoaggregates. This is probably due to the crystallization effect induced by F4-TCNQ, which actually reduces the size of crystals through over-loading the amount of the crystal nucleus at the early stage of crystallization.41,42 From TEM images we observed more distinct size-reduced nanoaggregates. As denoted in Fig. S10 (ESI†), the control film features a continuous mountain-valley topography with an apparent domain size of around 200 nm in diameter, while the F4-TCNQ processed film shows a more uniform surface with a distinct bright-dark contrast at boundaries and a smaller domain size of around 100 nm. The reduced domain size benefits the increase in the contacting interfaces of the donor and acceptor, which favours charge separation and thus contributes to a high Jsc.Two-dimensional grazing-incidence wide-angle X-ray scattering (GIWAXS) was used to probe the microstructural change due to the addition of F4-TCNQ. Fig. 6 shows the GIWAXS pattern and the corresponding 1D line-cuts of all pristine and blend films. In the PBDB-T pristine film the polymer takes a preferential face-on orientation, as indicated by the distinct (010) diffraction peak at 1.69 Å−1 in the out-of-plane (OOP) direction, which corresponds to a π–π stacking distance of 3.71 Å. In contrast, NFTI shows a typical edge-on orientation in the pristine film state, confirmed by the sharp π–π stacking peak at 1.78 Å−1 in the in-plane (IP) direction, which corresponds to a π–π stacking distance of 3.53 Å. In both blend films with/without F4-TCNQ, the face-on orientation is dominant, judging from the strong (010) peaks in the OOP direction. However, the alky-chain stacking condition is slightly different in the two blend films. Comparatively, the (100) peak at 0.29 Å−1 and the (300) peak at 0.87 Å−1 in the IP direction for the F4-TCNQ processed film provide slightly smaller d-spacing values, 21.5 Å and 7.12 Å respectively, than that of the control film, 21.7 Å and 7.21 Å respectively. The distinct (300) peak confirms the formation of small nanocrystals when the solid additive F4-TCNQ was used. The shortened alkyl-chain stacking distance indicates stronger intermolecular interactions that benefit charge transport in the parallel direction, which results in increased electron mobility and thus high Jsc and PCE.
3. Conclusions
In summary, a new small molecule NFTI was designed and synthesized by incorporating a fused 2-alkylthieno[3,4-b]thiophene linkage unit. NFTI exhibited suitable energy levels as a molecular acceptor and strong absorption in the visible light region. The device based on the PBDB-T donor polymer and the NFTI molecular acceptor exhibited a PCE of 9.02%. The incorporation of the electron-rich 2-alkylthieno[3,4-b]thiophene linkage unit narrows the bandgap of the fluorene-cored molecular acceptor and contributes to obtaining effective non-fullerene solar cell devices with small energy loss, which suggests the effectiveness via the quinoidal-resonance-enhancement strategy in the D–A system.29,43 The work also shows that NFTI is a promising electron acceptor material for organic solar cells.4. Experimental
Materials and synthesis methods
All commercially obtained reagents were used as received. All the starting materials were obtained from commercial sources and used as-received without further purification. Anhydrous THF and toluene were distilled over Na/benzophenone prior to use. All the reactions dealing with air- or moisture-sensitive compounds were carried out in a dry reaction vessel under a nitrogen atmosphere. Proton nuclear magnetic resonance (1H NMR) and carbon nuclear magnetic resonance (13C NMR) spectra were obtained on BRUKER AVANCE 300 and BRUKER DMX 400 spectrometers. Chemical shifts for hydrogens are reported in parts per million (ppm, δ scale) downfield from tetramethylsilane and are referenced to the residual protons in the NMR solvent (CDCl3: δ 7.26). 13C NMR spectra were recorded at 100 or 126 MHz. Chemical shifts for carbons are reported in parts per million (ppm, δ scale) downfield from tetramethylsilane and are referenced to the carbon resonance of the solvent (CDCl3: δ 77.16). The data are presented as follows: chemical shift, multiplicity (s = singlet, d = doublet, t = triplet, m = multiplet and/or multiple resonances, br = broad), coupling constant in Hertz (Hz), and integration. EI-MS measurements were obtained on UK GCT-Micromass and Shimadzu G-MS-QP2010 spectrometers. MALDI measurements were obtained on MALDI-FT 9.4T, Bruker solariX, and MALDI-TOF MS Bruker Autoflex III instruments. Elemental analyses were performed using a Flash EA 1112 Series from ThermoQuest. UV-vis spectra were recorded on a Jasco V-570 spectrometer. Cyclic voltammetry (CV) was performed using a CHI620D potentiostat. All measurements were carried out in a one-compartment cell under a N2 atmosphere, equipped with a glassy-carbon electrode, a carbon counter electrode, and an Ag/AgCl reference electrode. The supporting electrolyte was a 0.1 mol L−1 dichloromethane solution of tetrabutylammonium perchlorate (TBAP). All potentials were corrected against Fc/Fc+. CV was measured with a scan rate of 100 mV s−1.![[thin space (1/6-em)]](https://www.rsc.org/images/entities/char_2009.gif) :
:![[thin space (1/6-em)]](https://www.rsc.org/images/entities/char_2009.gif) 1). After being degassed with argon for 15 min, tetrakis(triphenylphosphine)palladium(0) (73.6 mg, 7 mol%) was added. Then, the mixture was purged with argon for another 15 min, after which the reaction mixture was stirred at 90 °C for 60 h. The mixture was then cooled to room temperature and extracted with CH2Cl2. The organic phase was separated, dried over MgSO4 and then evaporated under reduced pressure. After flash chromatography on Al2O3 using petroleum ether/CH2Cl2 as the eluent, compound 1 was obtained as an orange oil in 55% yield (450 mg), which was directly used for the next step without further purification and characterization due to its relatively low stability.26
1). After being degassed with argon for 15 min, tetrakis(triphenylphosphine)palladium(0) (73.6 mg, 7 mol%) was added. Then, the mixture was purged with argon for another 15 min, after which the reaction mixture was stirred at 90 °C for 60 h. The mixture was then cooled to room temperature and extracted with CH2Cl2. The organic phase was separated, dried over MgSO4 and then evaporated under reduced pressure. After flash chromatography on Al2O3 using petroleum ether/CH2Cl2 as the eluent, compound 1 was obtained as an orange oil in 55% yield (450 mg), which was directly used for the next step without further purification and characterization due to its relatively low stability.26
Solar cell fabrication and characterization
The non-fullerene organic solar cells were fabricated in a traditional ITO/PEDOT:PSS/active layer/Ca (or FPI)/Al structure. Prior to device fabrication, patterned indium tin oxide (ITO) glass (1.5 cm × 1.5 cm, sheet resistance, 15 Ω □−1) was cleaned in an ultrasonic bath of detergent, deionized water, acetone and isopropanol, subsequently. After being treated for 20 min in an ultraviolet–ozone chamber, the cleaned ITO glass was spin-coated on a poly(3,4-ethylenedioxythiophene):poly(styrene sulfonate) (PEDOT:PSS, Baytron P VP AI 4083) layer (∼40 nm) and was dried at 150 °C for 20 min. After this, the photoactive blend was spin coated onto the surface of PEDOT:PSS from its chloroform solution (chloroform![[thin space (1/6-em)]](https://www.rsc.org/images/entities/char_2009.gif) :
:![[thin space (1/6-em)]](https://www.rsc.org/images/entities/char_2009.gif) DPE = 97
DPE = 97![[thin space (1/6-em)]](https://www.rsc.org/images/entities/char_2009.gif) :
:![[thin space (1/6-em)]](https://www.rsc.org/images/entities/char_2009.gif) 3 in volume) to form the active layer. To obtain the F4-TCNQ processed device, a separate F4-TCNQ solution was prepared in o-dichlorobenzene (1 mg mL−1) and was added to PBDB-T:NFTI solution (3% DPE in chloroform) with the desired amount. And then a ∼20 nm thick calcium layer was evaporated or alternatively, the FPI layer was spin-coated from a methanol solution (concentration: 0.5 mg mL−1) at 3000 rpm for 30 s onto the active layer. Finally, ∼60 nm thick aluminum (Al) was thermally evaporated in a vacuum chamber (10−4 Pa) to form the electrode. The active area of each device was 3.08 mm2, defined by a shadow mask. For photovoltaic measurements, the J–V curve was recorded by a Precision Source/Measure Unit (B2912A, Agilent Technologies) and an AAA grade solar simulator (XES-70S1, SAN-EI Electric Co. Ltd, 7 × 7 cm2 beam size) coupled with AM 1.5G solar spectrum filters was taken as the light source. The light power on the surface of the sample was calibrated to be 100 mW cm−2 using a standard monocrystalline silicon reference cell (SRC-1000-TC-QZ, VLSI Standards Inc., 2 × 2 cm2). The external quantum efficiency (EQE) was measured using a Solar Cell Spectral Response Measurement System (QE-R3011, Enlitech Co. Ltd) with the light intensity at each wavelength also calibrated by a standard single crystal Si photovoltaic cell.
3 in volume) to form the active layer. To obtain the F4-TCNQ processed device, a separate F4-TCNQ solution was prepared in o-dichlorobenzene (1 mg mL−1) and was added to PBDB-T:NFTI solution (3% DPE in chloroform) with the desired amount. And then a ∼20 nm thick calcium layer was evaporated or alternatively, the FPI layer was spin-coated from a methanol solution (concentration: 0.5 mg mL−1) at 3000 rpm for 30 s onto the active layer. Finally, ∼60 nm thick aluminum (Al) was thermally evaporated in a vacuum chamber (10−4 Pa) to form the electrode. The active area of each device was 3.08 mm2, defined by a shadow mask. For photovoltaic measurements, the J–V curve was recorded by a Precision Source/Measure Unit (B2912A, Agilent Technologies) and an AAA grade solar simulator (XES-70S1, SAN-EI Electric Co. Ltd, 7 × 7 cm2 beam size) coupled with AM 1.5G solar spectrum filters was taken as the light source. The light power on the surface of the sample was calibrated to be 100 mW cm−2 using a standard monocrystalline silicon reference cell (SRC-1000-TC-QZ, VLSI Standards Inc., 2 × 2 cm2). The external quantum efficiency (EQE) was measured using a Solar Cell Spectral Response Measurement System (QE-R3011, Enlitech Co. Ltd) with the light intensity at each wavelength also calibrated by a standard single crystal Si photovoltaic cell.
The space charge-limited current method was used to determine the hole and electron mobilities in a photovoltaic device. The hole-only device takes on an ITO/PEDOT:PSS/active layer/Au configuration while the electron-only device takes an Al/active layer/Al configuration. The active layers for the two single-carrier-transporting devices were spin-coated following the same conditions as those for real solar cell devices. The mobilities were determined by fitting the dark current to a SCLC model which is described as:38
AFM, TEM and 2D GIWAXS
Atomic force microscopy (AFM) images of the thin films were obtained on a NanoscopeIIIa AFM (Digital Instruments) operating platform in the tapping mode. Transmission electron microscopy (TEM) was performed using a JEOL 2200FS operating at an accelerating voltage of 160 kV. Grazing incidence X-ray scattering (GIXS) characterization of the thin films was performed at the PLS-II 9A USAXS beamline of the Pohang Accelerator Laboratory in Korea. X-rays coming from the in-vacuum undulator (IVU) were monochromated (wavelength λ = 1.10994 Å) using a double crystal monochromator and they focused both horizontally and vertically (450 (H) × 60 (V) μm2 in FWHM at the sample position) using K–B type mirrors. The GIWAXS sample stage was equipped with a 7-axis motorized stage for the fine alignment of the sample, and the incidence angle of the X-ray beam was set to be 0.13°–0.135° for the polymer, NFTI and their blend films. GIWAXS patterns were recorded using a 2D CCD detector (Rayonix SX165), and the X-ray irradiation time was 6–9 s, dependent on the saturation level of the detector. Diffraction angles were calibrated using a sucrose standard (monoclinic, P21, a = 10.8631 Å, b = 8.7044 Å, c = 7.7624 Å, β = 102.938 Å) and the sample-to-detector distance was ∼231 mm.Conflicts of interest
There are no conflicts to declare.Acknowledgements
The authors gratefully acknowledge the financial support from the National Basic Research Program of China (973 Program, 2014CB643502), the Strategic Priority Research Program of the Chinese Academy of Sciences (XDB12010200), and the National Natural Science Foundation of China (91333113, 21572234, 61505225).Notes and references
- G. Yu, J. Gao, J. C. Hummelen, F. Wudl and A. J. Heeger, Science, 1995, 270, 1789–1791 CAS.
- L. Lu, T. Zheng, Q. Wu, A. M. Schneider, D. Zhao and L. Yu, Chem. Rev., 2015, 115, 12666–12731 CrossRef CAS PubMed.
- B. C. Thompson and J. M. J. Frechet, Angew. Chem., Int. Ed., 2008, 47, 58–77 CrossRef CAS PubMed.
- J.-D. Chen, C. Cui, Y.-Q. Li, L. Zhou, Q.-D. Ou, C. Li, Y. Li and J.-X. Tang, Adv. Mater., 2015, 27, 1035–1041 CrossRef CAS PubMed.
- Y. Liu, J. Zhao, Z. Li, C. Mu, W. Ma, H. Hu, K. Jiang, H. Lin, H. Ade and H. Yan, Nat. Commun., 2014, 5, 5293–5310 CrossRef CAS PubMed.
- S. H. Liao, H. J. Jhuo, P. N. Yeh, Y. S. Cheng, Y. L. Li, Y. H. Lee, S. Sharma and S. A. Chen, Sci. Rep., 2014, 4, 6813 CrossRef CAS PubMed.
- Q. Wan, X. Guo, Z. Y. Wang, W. B. Li, B. Guo, W. Ma, M. J. Zhang and Y. F. Li, Adv. Funct. Mater., 2016, 26, 6635–6640 CrossRef CAS.
- J. C. Hummelen, B. W. Knight, F. Lepeq, F. Wudl, J. Yao and C. L. Wilkins, J. Org. Chem., 1995, 60, 532–538 CrossRef CAS.
- M. M. Wienk, J. M. Kroon, W. J. H. Verhees, J. Knol, J. C. Hummelen, P. A. van Hal and R. A. J. Janssen, Angew. Chem., Int. Ed., 2003, 42, 3371–3375 CrossRef CAS PubMed.
- Y. J. He, H. Y. Chen, J. H. Hou and Y. F. Li, J. Am. Chem. Soc., 2010, 132, 1377–1382 CrossRef CAS PubMed.
- S. Holliday, R. S. Ashraf, C. B. Nielsen, M. Kirkus, J. A. Rohr, C. H. Tan, E. Collado-Fregoso, A. C. Knall, J. R. Durrant, J. Nelson and I. McCulloch, J. Am. Chem. Soc., 2015, 137, 898–904 CrossRef CAS PubMed.
- Y. Lin and X. Zhan, Mater. Horiz., 2014, 1, 470 RSC.
- C. B. Nielsen, S. Holliday, H. Y. Chen, S. J. Cryer and I. McCulloch, Acc. Chem. Res., 2015, 48, 2803–2812 CrossRef CAS PubMed.
- Y. Lin, J. Wang, Z. G. Zhang, H. Bai, Y. Li, D. Zhu and X. Zhan, Adv. Mater., 2015, 27, 1170–1174 CrossRef CAS PubMed.
- L. Gao, Z. G. Zhang, H. Bin, L. Xue, Y. Yang, C. Wang, F. Liu, T. P. Russell and Y. Li, Adv. Mater., 2016, 28, 8288–8295 CrossRef CAS PubMed.
- W. Zhao, S. Li, H. Yao, S. Zhang, Y. Zhang, B. Yang and J. Hou, J. Am. Chem. Soc., 2017, 139, 7148–7151 CrossRef CAS PubMed.
- M. M. Li, Y. T. Liu, W. Ni, F. Liu, H. R. Feng, Y. M. Zhang, T. T. Liu, H. T. Zhang, X. J. Wan, B. Kan, Q. Zhang, T. P. Russell and Y. S. Chen, J. Mater. Chem. A, 2016, 4, 10409–10413 CAS.
- N. Qiu, H. Zhang, X. Wan, C. Li, X. Ke, H. Feng, B. Kan, H. Zhang, Q. Zhang, Y. Lu and Y. Chen, Adv. Mater., 2017, 29, 1604964 CrossRef PubMed.
- S. Holliday, R. S. Ashraf, A. Wadsworth, D. Baran, S. A. Yousaf, C. B. Nielsen, C. H. Tan, S. D. Dimitrov, Z. Shang, N. Gasparini, M. Alamoudi, F. Laquai, C. J. Brabec, A. Salleo, J. R. Durrant and I. McCulloch, Nat. Commun., 2016, 7, 11585 CrossRef CAS PubMed.
- Y. H. Liu, Z. Zhang, S. Y. Feng, M. Li, L. L. Wu, R. Hou, X. J. Xu, X. B. Chen and Z. S. Bo, J. Am. Chem. Soc., 2017, 139, 3356–3359 CrossRef CAS PubMed.
- Y. Li, L. Zhong, B. Gautam, H.-J. Bin, J.-D. Lin, F.-P. Wu, Z. Zhang, Z.-Q. Jiang, Z.-G. Zhang, K. Gundogdu, Y. Li and L.-S. Liao, Energy Environ. Sci., 2017, 10, 1610–1620 CAS.
- H. Yao, L. Ye, H. Zhang, S. Li, S. Zhang and J. Hou, Chem. Rev., 2016, 116, 7397–7457 CrossRef CAS PubMed.
- L. Xue, J. He, X. Gu, Z. Yang, B. Xu and W. Tian, J. Phys. Chem. C, 2009, 113, 12911–12917 CAS.
- S. S. Chen, H. T. Yao, Z. K. Li, O. M. Awartani, Y. H. Liu, Z. Wang, G. F. Yang, J. Q. Zhang, H. Ade and H. Yan, Adv. Energy Mater., 2017, 7, 1602304 CrossRef.
- C. Zhang and X. Zhu, Acc. Chem. Res., 2017, 50, 1342–1350 CrossRef CAS PubMed.
- S. J. Xu, Z. C. Zhou, H. J. Fan, L. B. Ren, F. Liu, X. Z. Zhu and T. P. Russell, J. Mater. Chem. A, 2016, 4, 17354–17362 CAS.
- Z. Zhou, S. Xu, W. Liu, C. Zhang, Q. Hu, F. Liu, T. P. Russell and X. Zhu, J. Mater. Chem. A, 2017, 5, 3425–3433 CAS.
- F. Liu, G. L. Espejo, S. Qiu, M. M. Oliva, J. Pina, J. S. Seixas de Melo, J. Casado and X. Zhu, J. Am. Chem. Soc., 2015, 137, 10357–10366 CrossRef CAS PubMed.
- C. Zhang, H. Li, J. Z. Wang, Y. F. Zhang, Y. Qiao, D. Z. Huang, C. A. Di, X. W. Zhan, X. Z. Zhu and D. B. Zhu, J. Mater. Chem. A, 2015, 3, 11194–11198 CAS.
- F. Liu, Z. Zhou, C. Zhang, T. Vergote, H. Fan, F. Liu and X. Zhu, J. Am. Chem. Soc., 2016, 138, 15523–15526 CrossRef CAS PubMed.
- F. Liu, Z. Zhou, C. Zhang, J. Zhang, Q. Hu, T. Vergote, F. Liu, T. P. Russell and X. Zhu, Adv. Mater., 2017, 29, 1606574 CrossRef PubMed.
- F. Liu, J. Zhang, Z. Zhou, J. Zhang, Z. Wei and X. Zhu, J. Mater. Chem. A, 2017, 5, 16573–16579 CAS.
- G. Zhang, G. Yang, H. Yan, J. H. Kim, H. Ade, W. Wu, X. Xu, Y. Duan and Q. Peng, Adv. Mater., 2017, 29, 1606054 CrossRef PubMed.
- D. P. Qian, L. Ye, M. J. Zhang, Y. R. Liang, L. J. Li, Y. Huang, X. Guo, S. Q. Zhang, Z. A. Tan and J. H. Hou, Macromolecules, 2012, 45, 9611–9617 CrossRef CAS.
- P. D. Homyak, J. Tinkham, P. M. Lahti and E. B. Coughlin, Macromolecules, 2013, 46, 8873–8881 CrossRef CAS.
- C. Z. Li, C. C. Chueh, H. L. Yip, K. M. O’Malley, W. C. Chen and A. K. Y. Jen, J. Mater. Chem., 2012, 22, 8574–8578 RSC.
- Y. Zhang, H. Zhou, J. Seifter, L. Ying, A. Mikhailovsky, A. J. Heeger, G. C. Bazan and T. Q. Nguyen, Adv. Mater., 2013, 25, 7038–7044 CrossRef CAS PubMed.
- P. N. Murgatroyd, J. Phys. D: Appl. Phys., 1970, 3, 151–156 Search PubMed.
- Y. Guo, Y. Li, O. Awartani, J. Zhao, H. Han, H. Ade, D. Zhao and H. Yan, Adv. Mater., 2016, 28, 8483–8489 CrossRef CAS PubMed.
- V. D. Mihailetchi, J. Wildeman and P. W. M. Blom, Phys. Rev. Lett., 2005, 94, 126602 CrossRef CAS PubMed.
- M. Yang, Y. Zhou, Y. Zeng, C. S. Jiang, N. P. Padture and K. Zhu, Adv. Mater., 2015, 27, 6363–6370 CrossRef CAS PubMed.
- Y. Y. Zhou, M. J. Yang, W. W. Wu, A. L. Vasiliev, K. Zhu and N. P. Padture, J. Mater. Chem. A, 2015, 3, 8178–8184 CAS.
- S. j. Xu, Z. Zhou, W. Liu, Z. Zhang, F. Liu, H. Yan and X. Zhu, Adv. Mater., 2017, 29, 1704510 CrossRef PubMed.
Footnote |
| † Electronic supplementary information (ESI) available: Molecular structure of PBDB-T, FPI, device optimization procedures, SCLC mobility, TEM, NMR and MS of all new compounds. See DOI: 10.1039/c7qm00585g |
| This journal is © the Partner Organisations 2018 |

