FRET-mediated near infrared whispering gallery modes: studies on the relevance of intracavity energy transfer with Q-factors†
Osamu
Oki
a,
Soh
Kushida
a,
Annabel
Mikosch
b,
Kota
Hatanaka
c,
Youhei
Takeda
 c,
Satoshi
Minakata
c,
Junpei
Kuwabara
c,
Satoshi
Minakata
c,
Junpei
Kuwabara
 ad,
Takaki
Kanbara
 ad,
Thang D.
Dao
e,
Satoshi
Ishii
e,
Tadaaki
Nagao
e,
Alexander J. C.
Kuehne
 b,
Felix
Deschler
f,
Richard H.
Friend
f and
Yohei
Yamamoto
 *ad
*ad
aDivision of Materials Science, Faculty of Pure and Applied Sciences, University of Tsukuba, 1-1-1 Tennodai, Tsukuba, Ibaraki 305-8573, Japan. E-mail: yamamoto@ims.tsukuba.ac.jp
bDWI-Leibniz Institute for Interactive Materials, RWTH Aachen University, Forckenbeckstraße 50, 52076 Aachen, Germany
cDepartment of Applied Chemistry, Graduate School of Engineering, Osaka University, 2-1 Yamadaoka, Suita, Osaka 565-0871, Japan
dTsukuba Research Center for Energy Materials Science (TREMS), University of Tsukuba, 1-1-1 Tennodai, Tsukuba, Ibaraki 305-8573, Japan
eNano-System Photonics Group, Nano-System Organization Unit, National Institute for Materials Science (NIMS), 1-1 Namiki, Tsukuba, Ibaraki 305-0044, Japan
fCavendish Laboratory, University of Cambridge, JJ Thomson Avenue, CB3 0HE Cambridge, UK
First published on 27th November 2017
Abstract
Near infrared (NIR) optical microsphere resonators are prepared by coassembly of energy-donating and accepting conjugated polymers. In the microspheres, fluorescence resonance energy transfer occurs, leading to sharp and periodic photoluminescence from whispering gallery modes in the NIR region with Q-factors as high as 600.
Near infrared (NIR) emitting materials represent powerful tools for biosensing and light sources for bioimaging due to the high transparency of biological organisms in this spectral window.1 Therein, NIR luminescent colloidal probes with sharp emission lines are often utilized. Recently, polymer whispering gallery mode (WGM) microresonators with narrow luminescence and laser emission have been reported.2 Furthermore, π-conjugated organic and polymer microparticles, in some cases doped with rare-earth metals, were shown to exhibit resonant emission and lasing in the visible and NIR region.2,3 Such organic microresonators find applications for barcoding in live cells, where lasing with a unique spectral profile makes it possible to distinguish each cell.4 However, NIR emitters often suffer from low luminescence efficiency because of the small energy gap between the highest-occupied and lowest-unoccupied molecular orbitals (HOMO and LUMO, respectively), which causes non-radiative thermal deactivation.5 Furthermore, aggregation of molecules often causes serious quenching of the NIR emission. The absence of high-performance organic and polymeric lasers in the NIR spectral regime hinders the development of new biomedical imaging probes as well as NIR communication sources. Advancing polymeric microsphere lasers into the NIR spectral region would open up numerous applications in biological systems.
Fluorescence resonance energy transfer (FRET) is an energy transfer mechanism that yields down-converted photoluminescence (PL) with high efficiency.6 Because the effective distance of FRET is typically within 10 nm,6 molecules that interchange energy have to be blended homogeneously without macroscopic phase separation.7 Recently, we reported color conversion of WGM PL in microsphere resonators consisting of two blended π-conjugated polymers. By utilizing FRET, effective red-shifted WGM PL was achieved in the microsphere resonators.8
In this communication, we realize FRET in blended conjugated polymer microspheres that leads to NIR emission from a WGM cavity. The polymers we used in this study, named P1 and P2, act as an energy donor and acceptor, respectively. P2 displays PL in the red-to-NIR region in solution but hardly fluoresces in the solid state because of the aggregation quenching. By contrast, microspheres formed by coassembly of P1 and a small fraction of P2 exhibit clear WGM PL in the NIR spectral region, resulting from efficient intrasphere FRET from P1 to P2. The utilization of FRET inside a microresonator is useful to efficiently extract NIR light with narrow line width.
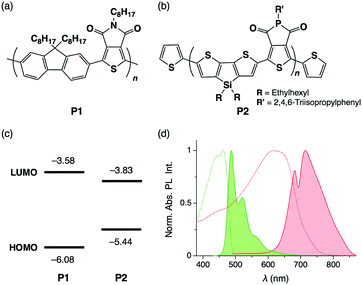
The π-conjugated polymers, P1 (poly[(9,9-dioctylfluorene-2,7-diyl)-alt-(5-octylthieno[3,4-c]pyrrole-4,6-dione-1,3-diyl)] with number-average molecular weight (Mn) of 24 kg mol−1, Fig. 1a) and P2 (poly[(5-(2,4,6-triisopropylphenyl)thieno[3,4-c]phosphole-4,6-dione)-alt-(4,4-bis(2-ethylhexyl)-silolo-[3,2-b:4,5-b′]dithiophene)], Mn = 6.5 kg mol−1, Fig. 1b) were synthesized according to reported procedures.9 The HOMO and LUMO energy levels are −6.08 and −3.58 eV for P1 and −5.44 and −3.83 eV for P2, respectively, with respect to the vacuum level (Fig. 1c). As shown in the photoabsorption and PL spectra of P1 and P2 in CHCl3, the PL band of P1 largely overlaps with the absorption band of P2, indicating that efficient FRET from P1 to P2 is possible (Fig. 1d). Indeed, in cast films prepared by spin coating of P1 and P2 in CHCl3 solution, PL from P1 is mostly quenched even when the weight fraction of P2 (fP2) is only 0.02 (Fig. S1, ESI†).
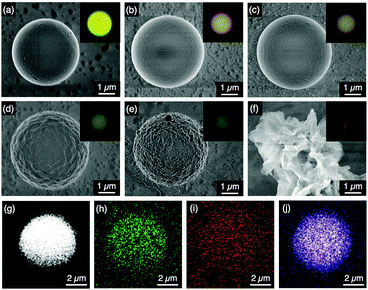
Self-assembly of P1 and P2 and coassembly of their blends into WGM microsphere resonators were carried out by slow diffusion of MeOH vapour into their CHCl3 solutions (see the Experimental section).2,10 The total initial concentration of polymers P1 and/or P2 was set at 0.5 mg mL−1. After three days of vapour diffusion at 25 °C, the solution changed to a suspension, and the polymers were precipitated. Scanning electron microscopy (SEM) shows that P1 (fP2 = 0) forms well-defined microspheres with a typical diameter of 5 μm (Fig. 2a),2a,8,11 while P2 (fP2 = 1) gave irregular aggregates (Fig. 2f). For the P1/P2 blend, well-defined microspheres with smooth surface morphology could be obtained within a fP2 range of 0.01–0.05 (Fig. 2b and c). However, in the case of the coassembly with fP2 greater than 0.06, the surface morphology of the resulting spheres deteriorated (Fig. 2d and e). Polymer blends tend to phase separate due to their small mixing entropy.7 In the case of fP2 ≥ 0.06, microspheres with rough surfaces are obtained with characteristic features inherent to phase segregation. On the other hand, in the case of fP2 ≤ 0.05, P1 and P2 are well mixed, and segregation of P2 is suppressed due to its small fraction. In fact, energy dispersive X-ray spectrometry (EDS) mapping of the microsphere with fP2 = 0.04 shows that signals of Si and P from P2 are homogeneously distributed throughout the entire microsphere. This result indicates that P2 is well dispersed in a single microsphere (Fig. 2g–j). The signals of each element are much clearer for microspheres with fP2 = 0.07, yet it is hard to recognize the phase separation of P1 and P2, because the resolution of the apparatus is not sufficient (Fig. S3, ESI†).
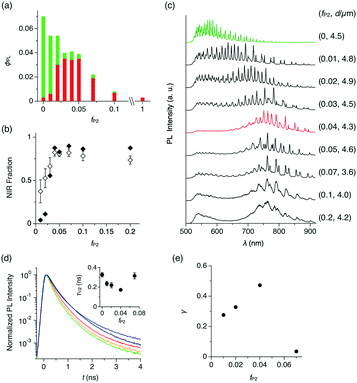
The change of PL quantum yield (ϕPL) with fP2 further indicates that P2 is well dispersed in the P1 matrix. Upon excitation at 470 nm, ϕPL of the microspheres decreases monotonically with increasing fP2 (Fig. 3a). However, the fraction of the PL in the red and NIR region (λ = 650–950 nm) increases with increasing fP2, and at fP2 ≥ 0.03, the PL spectrum is the same as for pure P2 (Fig. 3b, closed squares). These results show that efficient energy transfer takes place from P1 to P2. When fP2 is greater than 0.07, ϕPL decreases largely, indicating that the aggregation of P2 causes concentration quenching of the NIR PL from P2. The excitation spectrum of a cast film of microspheres (fP2 = 0.05) shows that PL at 650 nm is mostly generated by photoabsorption of P1, further supporting that efficient energy transfer from P1 to P2 occurs inside the microspheres (Fig. S2, ESI†).
To quantify the energy transfer, we measure PL spectra of individual microspheres (λex = 470 nm, see the Experimental section and Fig. S4, ESI†). For microspheres with fP2 = 0–0.2, characteristic spectral modulation from the WGM cavity can be observed, indicating that the generated PL is confined inside of the microspheres and self-interferes (Fig. 3c).2,8,12 As fP2 increases, the spectral series of WGM modes shift from the visible to the NIR region, and at fP2 = 0.04, WGM PL is observed mostly in the NIR region at 700–900 nm (Fig. 3c, red). According to the area intensity, more than 80% of the PL originates from P2 in the microsphere with fP2 of 0.04 (Fig. 3b, open squares). At fP2 greater than 0.07, the NIR PL slightly decreases and the PL in the visible region reappears (Fig. 3c), possibly caused by the meso- and macroscopic phase segregation of P1 and P2 in the microsphere (Fig. 2d and e).
We performed time-resolved PL spectroscopy, which further supports the intrasphere energy transfer. As fP2 increases from 0 to 0.04, the PL half lifetime (τ1/2) at 540 nm (PL from P1) monotonically decreases from 0.327 to 0.172 ns (Fig. 3d), while τ1/2 at 675–730 nm (PL from P2) is almost constant at around 0.6 ns (Fig. S5, ESI†). Further increase of fP2 to 0.07 results in an increase of τ1/2 at 540 nm to 0.315 ns.
The energy transfer efficiency (γ) in the single microsphere is evaluated with eqn (1),
| γ = 1 − τB/τD | (1) |
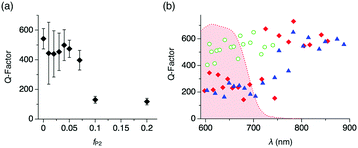
We further carry on to determine the performance of the WGM resonator by evaluating the Q-factor. The average Q-factor is defined as the peak wavelength divided by the full-width at the half maximum of the observed WGM PL peaks (Qav). For the microspheres with fP2 ≤ 0.07 and d ∼ 5 μm, Qav is around 400 (Fig. 4a). With increasing fP2 ≥ 0.1, Qav decreases greatly to ∼100, which results from the increased surface roughness that causes scattering losses of the confined PL. It is noteworthy that the Q-factor shows wavelength dependency. The WGM PL lines of the microspheres with fP2 = 0 display Q-factors around 500 (Fig. 4b and Fig. S6, ESI† green).13 By contrast, WGMs of the microspheres with fP2 = 0.01 and 0.02 exhibit Q-factors around 200 in the visible range (600–750 nm) and as large as 600 in the NIR region (>800 nm, Fig. 4b and Fig. S6, ESI† red and blue). The Q-factor is described as follows:
| Q−1 = Qrad−1 + Qscat−1 + Qabs−1 | (2) |
| Qabs−1 = αλ/2nπ | (3) |
On the other hand, Qrad−1 and Qscat−1 of the compared microspheres are assumed not differ greatly, because microspheres with identical diameters (∼5 μm) and similar degrees of surface roughness are applied here. Qrad is indeed size dependent,14b which is clearly visible when plotting Q versus the particle diameter (Fig. S8, ESI†). As a result of the reabsorption loss, WGM lines in the visible range display smaller Q values (∼200) than those in the NIR range, where they reach as high as 600. This value is of similar level as previously reported NIR WGMs of self-assembled organic resonators.3
Conclusions
We fabricate whispering gallery mode (WGM) microresonators by self-assembly of an energy donating conjugated polymer doped with a small portion of energy accepting, NIR-emitting polymer. Due to efficient energy transfer (FRET) from the donor to acceptor polymers inside the microspheres, WGM in the NIR region appears upon photoexcitation at the perimeter of the microsphere. The observed Q-factor is as high as 600 in the NIR region, at which the absorption loss by the energy-accepting polymer is almost dismissed. The NIR WGM resonators will be valuable for applications in sensing and imaging in biological systems.15Experimental section
Self-assembly of P1 and P2 and coassembly of their blends
Typically, a 5 mL vial containing a CHCl3 solution of P1, P2 or their blends with a total concentration and amount of 0.5 mg mL−1 and 2 mL, respectively, was placed in a 50 mL vial containing 5 mL of MeOH. The outside vial was capped and then allowed to stand for 3 days at 25 °C. The vapour of the nonsolvent was slowly diffused into the solution, resulting in precipitation of the polymers through the supersaturated state.μ-PL measurements
μ-PL measurements were carried out using a μ-PL measurement system (Fig. S4, ESI†).8 An optical microscope was used with a long-distance 100× objective (NA = 0.8) to identify suitable particles and determine their diameters. For measurements, a WITec μ-PL system was used with a model Alpha 300S microscope combined with a Princeton Instruments model Action SP2300 monochromator (grating: 300 grooves mm−1) and an Andor iDus model DU-401A BR-DD-352 CCD camera cooled to −60 °C. The PL spectrum was measured at a resolution of 0.27 nm. The edge of a single sphere was photoexcited at 25 °C under ambient conditions by a diode pulsed laser (a PicoQuant model LDH-D-C-470B with a PDL 828 ‘Sepia II’ driver) with the wavelength, power, integration time, frequency, pulse duration and spot size of 470 nm, 1.5 μW, 1 s, 2.5 MHz, 70 ps, and ∼1 μm, respectively. Time-resolved PL decay experiments on individual isolated microspheres were carried out on the samples sealed under nitrogen in a glove box using a PicoHarp 300 TCSPC module from PicoQuant hooked to a Leica TCS SP8 microscope equipped with a pulsed White Light Laser.Author contribution
YY and YT designed experiment, KH, YT, SM, JK, TK synthesized the polymers, OO and SK conducted self-assembly, OO, AM, TD, SI, TN, AK, FD, RF conducted μ-PL and time-resolved PL measurements, and YY and OO prepared the manuscript.Conflicts of interest
There are no conflicts to declare.Acknowledgements
The authors acknowledge Prof. Tatsuya Nabeshima, Masaki Yamamura, and Takashi Nakamura of University of Tsukuba for PL quantum yield experiments. This work was supported by a Grant-in-Aid for Scientific Research on Innovative Areas “π-System Figuration” (JP17H05141, JP17H05142, JP17H05155), Scientific Research (A) (JP16H02081), and Joint International Research (JP15KK0182) from Japan Society for the Promotion of Science (JSPS), University of Tsukuba Pre-strategic initiative “Ensemble of light with matters and life”, Asahi Glass Foundation, and the Deutsche Forschungsgemeinschaft DFG (KU 2738/3-2).Notes and references
- (a) E. A. Owens, M. Henary, G. E. Fakhri and H. S. Choi, Acc. Chem. Res., 2016, 49, 1731 CrossRef CAS PubMed; (b) V. Pansare, S. Hejazi, W. Faenza and R. K. Prud’homme, Chem. Mater., 2012, 24, 812 CrossRef CAS PubMed; (c) Y. Koide, Y. Urano, K. Hanaoka, W. Piao, M. Kusakabe, N. Saito, T. Terai, T. Okabe and T. Nagano, J. Am. Chem. Soc., 2012, 134, 5029 CrossRef CAS PubMed.
- (a) K. Tabata, D. Braam, S. Kushida, L. Tong, J. Kuwabara, T. Kanbara, A. Beckel, A. Lorke and Y. Yamamoto, Sci. Rep., 2014, 10, 5902 Search PubMed; (b) S. Ciftci, A. Mikosch, B. Haehnle, L. Witczak and A. J. C. Kuehne, Chem. Commun., 2016, 52, 14222 RSC; (c) S. Kushida, D. Okada, F. Sasaki, Z.-H. Lin, J.-S. Huang and Y. Yamamoto, Adv. Opt. Mater., 2017, 5, 1700123 CrossRef.
- (a) X. Wang, Q. Liao, H. Li, S. Bai, Y. Wu, X. Lu, H. Hu, Q. Shi and H. Fu, J. Am. Chem. Soc., 2015, 137, 9289 CrossRef CAS PubMed; (b) D. Venkatakrishnarao and R. Chandrasekar, Adv. Opt. Mater., 2016, 4, 112 CrossRef CAS; (c) D. Venkatakrishnarao, M. A. Mohiddon and R. Chandrasekar, Adv. Opt. Mater., 2017, 5, 1600613 CrossRef; (d) Yemineni S. L. Narayana, D. Venkatakrishnarao, A. Biswas, M. A. Mohiddon, N. Viswanathan and R. Chandrasekar, ACS Appl. Mater. Interfaces, 2016, 8, 952–958 CrossRef CAS PubMed.
- M. Schubert, A. Steude, P. Liehm, N. M. Kronenberg, M. Karl, E. C. Campbell, S. J. Powis and M. C. Gather, Nano Lett., 2015, 15, 5647 CrossRef CAS PubMed.
- (a) M. Shimizu, R. Kaki, Y. Takeda, T. Hiyama, N. Nagai, H. Yamagishi and H. Furutani, Angew. Chem., Int. Ed., 2012, 51, 4095 CrossRef CAS PubMed; (b) J. Massin, W. Dayoub, J.-C. Mulatier, C. Aronica, Y. Bretonniere and C. Andraud, Chem. Mater., 2011, 23, 862 CrossRef CAS; (c) O. Fenwick, J. Sprafke, J. Binas, D. Kondratuk, F. D. Stasio, H. L. Anderson and F. Cacialli, Nano Lett., 2011, 11, 2451 CrossRef CAS PubMed.
- (a) V. T. Förster, Ann. Phys., 1948, 6, 55 CrossRef; (b) J. P. S. Farinha and J. M. Martinho, J. Phys. Chem. C, 2008, 112, 10591 CrossRef CAS.
- C. Pan, K. Sugiyasu and M. Takeuchi, Chem. Commun., 2014, 50, 11814 RSC.
- S. Kushida, D. Braam, T. D. Dao, H. Saito, K. Shibasaki, S. Ishii, T. Nagao, A. Saeki, J. Kuwabara, T. Kanbara, M. Kijima, A. Lorke and Y. Yamamoto, ACS Nano, 2016, 10, 5543 CrossRef CAS PubMed.
- (a) H. Saito, J. Kuwabara and T. Kanbara, J. Polym. Sci., Part A: Polym. Chem., 2015, 53, 2198 CrossRef CAS; (b) Y. Takeda, K. Hatanaka, T. Nishida and S. Minakata, Chem. – Eur. J., 2016, 22, 10360 CrossRef CAS PubMed.
- T. Adachi, L. Tong, J. Kuwabara, T. Kanbara, A. Saeki, S. Seki and Y. Yamamoto, J. Am. Chem. Soc., 2013, 135, 870 CrossRef CAS PubMed.
- S. Kushida, O. Oki, H. Saito, J. Kuwabara, T. Kanbara, M. Tashiro, M. Katouda, Y. Imamura and Y. Yamamoto, J. Phys. Chem. Lett., 2017, 10, 4580 CrossRef PubMed.
- S. Kushida, D. Braam, C. Pan, T. Dao, K. Tabata, K. Sugiyasu, M. Takeuchi, S. Ishii, T. Nagao, A. Lorke and Y. Yamamoto, Macromolecules, 2015, 48, 3928 CrossRef CAS.
- (a) S. Schiller, Appl. Opt., 1993, 32, 2181 CrossRef CAS PubMed; (b) L. L. Martín, P. Haro-González, I. R. Martín, D. Navarro-Urrios, D. Alonso, C. Pérez-Rodríguez, D. Jaque and N. E. Capuj, Opt. Lett., 2011, 36, 615 CrossRef PubMed.
- (a) I. Alvarado-Rodrigues and E. Yablonovitch, J. Appl. Phys., 2002, 92, 6399 CrossRef; (b) M. L. Gorodetsky, A. A. Savchenkov and V. S. Ilchenko, Opt. Lett., 1996, 21, 453 CrossRef CAS PubMed.
- M. R. Foreman, J. D. Swaim and F. Vollmer, Adv. Opt. Photonics, 2015, 7, 168 CrossRef CAS PubMed.
Footnote |
| † Electronic supplementary information (ESI) available. See DOI: 10.1039/c7qm00498b |
| This journal is © the Partner Organisations 2018 |


