Electrochemical sensor based on novel two-dimensional nanohybrids: MoS2 nanosheets conjugated with organic copper nanowires for simultaneous detection of hydrogen peroxide and ascorbic acid
Dapeng
Li
ab,
Xueying
Liu
ab,
Ran
Yi
ab,
Jiaxian
Zhang
ab,
Zhiqiang
Su
 *ab and
Gang
Wei
 *c
*c
aState Key Laboratory of Chemical Resource Engineering, Beijing University of Chemical Technology, 100029 Beijing, China. E-mail: suzq@mail.buct.edu.cn
bBeijing Key Laboratory of Advanced Functional Polymer Composites, Beijing University of Chemical Technology, China
cFaculty of Production Engineering, University of Bremen, D-28359 Bremen, Germany. E-mail: wei@uni-bremen.de
First published on 7th November 2017
Abstract
There has been increasing interest in the use of molybdenum disulfide (MoS2) for the synthesis and application of functional hybrid nanomaterials. Here, for the first time, we prepared MoS2 nanosheets that were modified with organic copper (OCu) nanowires by a facile two-step hydrothermal synthesis. Multi-characterization techniques such as scanning electron microscopy, transmission electron microscopy, and atomic force microscopy were used to observe the conjugation of OCu with MoS2 and the morphology of the fabricated MoS2–OCu nanohybrids. In addition, other methods such as X-ray photoelectron spectroscopy, Fourier transform infrared spectroscopy, and X-ray diffraction were utilized to understand the structure and properties of the prepared MoS2–OCu nanohybrids. Finally, the synthesized MoS2–OCu nanohybrids were further utilized to fabricate multi-functional electrochemical sensors for highly sensitive detection of hydrogen peroxide (H2O2) and ascorbic acid (AA). The obtained results indicate that the synthesized novel MoS2–OCu nanohybrids exhibit excellent electrocatalytic activity towards both analytes, and present potential applications for detecting H2O2 and AA with high stability, sensitivity, and selectivity.
1. Introduction
Electrochemical sensors are novel devices that have been widely applied in various fields such as biomedicine, environmental science, and food analysis due to their quick current response, wide detection range, high stability, and universal detection of different analytes.1–4 Nowadays, many small molecules and macromolecules, including glucose, ascorbic acid (AA), hydrogen peroxide (H2O2), dopamine (DA), DNA, and protein, have been detected by various electrochemical sensors or biosensors.5–8 Among them, H2O2, as one of the most important substances of many bio-related reactions in environmental and biological fields, is an important target for biological analysis. Therefore, it is essential to analyze and detect H2O2 in a precise and convenient way. AA is another familiar compound that is present in almost all organisms. It assists with maintaining normal metabolism and is necessary for life and health. Hence, it is also necessary to determine the content of AA in a biological system.Previously, various methods, such as spectrophotometry,9,10 fluorescence spectroscopy,11,12 and electrochemistry,6 have been utilized to detect H2O2 and AA. Among these methods, the electrochemical method has been thought of as one of the most effective methods to detect H2O2 and AA due to its high sensitivity, good selectivity, and high stability. The electrochemical sensors can be divided into enzymatic biosensors and non-enzymatic sensors, which have been fabricated and used for various high-performance detection applications.3,13 Previous studies indicated that non-enzymatic electrochemical sensors can be employed in a wider range of applications in various fields as compared to enzymatic biosensors due to their higher stability, increased sensitivity, and easier fabrication process.14,15
In order to design high performance non-enzymatic electrochemical sensors, the modification of electrodes with highly active material is a basic but important step. In recent years, two-dimensional (2D) nanomaterials, such as graphene, that possess unique chemical and physical properties, have shown promising prospects in the fields of nanotechnology, materials science, analytical science, and biomedicine.16,17 With the development of graphene-like materials, transition-metal dichalcogenides (TMDs), another type of 2D material that includes WS2, TiS2, and others, have aroused intensive interest due to their unique structure and properties.18–20 As a typical 2D layered material, molybdenum disulfide (MoS2) possesses excellent thermal stability and high electrocatalytic activity, which are desirable properties for its use in various applications such as sensors,21 electrocatalysts,22 supercapacitors,23 and energy storage devices.24 For instance, recently Wang et al. fabricated an electrochemical H2O2 sensor with high sensitivity and selectivity based on ultra-small MoS2 nanoparticles.25
To improve the sensing performance of MoS2-based non-enzymatic electrochemical sensors, the combination of MoS2 with metal oxides, noble metals, or carbon materials has been proven to be an ideal strategy.26 In our previous studies, MoS2-based electrochemical sensors were fabricated that showed enhanced electrocatalytic activity and sensing performances towards a few analytes.21,27 For example, we have decorated MoS2 nanosheets with platinum nanoparticles (PtNPs) and utilized the synthesized MoS2–PtNP nanohybrids as electrode materials to fabricate an electrochemical H2O2 sensor.27 The experimental results indicated that the created MoS2–PtNP-based H2O2 sensor exhibits high sensitivity, good reproducibility, and long-term stability. In another work, we successfully fabricated 3D coral-like structural MoS2–Cu2O porous nanohybrids, which were utilized as a bifunctional material for electrochemical sensor and oxygen reduction reaction (ORR) applications.21 Due to the combination of p-type Cu2O nanoparticles and n-type MoS2 nanosheets, the created MoS2–Cu2O nanohybrids exhibit great potential in both electrochemical non-enzymatic H2O2 detection and ORR catalysis.21 In other studies, MoS2 has been also decorated with prussian blue nanocubes,28 gold nanoparticles,29 and others30 to fabricate electrochemical sensors. All these experiments proved that MoS2 is an excellent candidate nanomaterial for creating electrochemical sensors for chemical and biological molecule determinations.
For organic–inorganic nanocomposites, the polymer chains insert into the layered inorganic materials and the mobility of starch chains is reduced, which can improve the dimensional stability of materials. A combination of inorganic materials with organic materials also has unique properties in the field of electrochemistry.31,32 In this work, novel organic copper (OCu) nanowires were synthesized and decorated onto the surface of MoS2 nanosheets through a two-step hydrothermal reaction. Furthermore, the as-prepared MoS2–OCu nanohybrids were used to modify glassy carbon electrodes (GCEs) for fabricating both electrochemical H2O2 and AA sensors. It is expected that the MoS2–OCu nanohybrid-based non-enzymatic electrochemical sensors will show enhanced performances for detecting both H2O2 and AA, and there will be more potential applications in materials science and analytical science for the synthesized OCu nanowires. In addition, it is likely that this work will supply new ideas to readers so that they can design and apply new types of electrochemical sensors and biosensors in several related areas.
2. Experimental section
2.1 Reagents and materials
Sulphur molybdenum powder, N-methyl pyrrolidone (NMP, ≥99.9% purity), AA, o-phenetidine, uric acid (UA), and dopamine (DA) were purchased from J&K Scientific Ltd, China. Nafion solution was purchased from Sigma-Aldrich Company, China. NaOH, ethanol, H2O2 (30% aqueous solution), disodium hydrogen phosphate (Na2HPO4), acetic acid (AC), and sodium dihydrogen phosphate (NaH2PO4) were purchased from the Beijing Chemical Co., Ltd, China. The water used in this study was purified by a Millipore reverse osmosis system (18.2 MΩ cm).2.2 Synthesis of MoS2 nanosheets and MoS2–OCu nanohybrids
MoS2 nanosheets were prepared using the liquid-phase exfoliation method. In brief, bulk MoS2 powder was dispersed in NMP (7.5 mg mL−1) for 4 h using a horn-probe tip sonicator (Sonics Vibra-cell VCX-650W ultrasonic processor) operating at 285 W with an on (6 s) and off (2 s) pulse. The obtained raw dispersion was centrifuged for 60 min at 1500 rpm to remove the unexfoliated MoS2. Then, the supernatant was decanted and centrifuged for another 90 min at 4500 rpm. The sediment was then collected for subsequent synthesis.MoS2–OCu nanohybrids were synthesized via a two-step hydrothermal process. In brief, 1.6 mmol Cu(AC)2 was dissolved in 64 mL distilled water, and then 80 mL of 0.04 M o-phenetidine solution was added to the reaction system. Subsequently, 16 mL 0.05 M AC was quickly added. The mixture was maintained at 90 °C for 10 h under stirring. The sediment was collected by filtration. In the second step, 80 mL NMP and MoS2 was mixed with the sediment at 50 °C for 24 h under stirring. The obtained MoS2–OCu products were collected by centrifugation, washed with ethanol several times, and dried at air and room temperature for future use.
2.3 Fabrication of MoS2-, OCu, and MoS2–OCu-modified electrodes and electrochemical experiments
Firstly, a GCE with a diameter of 3.0 mm was polished with alumina slurry. After that, the polished GCE was washed several times with distilled water and ethanol in an ultrasonic bath, and then dried at room temperature. In order to prepare the MoS2- (OCu and MoS2–OCu)-modified GCE, 10 mg MoS2 (OCu and MoS2–OCu), 100 μL Nafion (0.1%), and 1 mL ethanol were blended in a glass test tube and then transferred to an ultrasonic bath for 10 min. Afterwards, 10 μL of the mixture solution was dropped onto the surface of the GCE and dried at room temperature. These modified GCEs were then used for both electrochemical amperometric response (I–T) and cyclic voltammogram (CV) measurements with an electrochemical workstation (Chenhua CHI760D, Shanghai, China) at room temperature.A three-electrode system was used with these modified GCEs as working electrodes, with a potassium chloride (KCl)-saturated calomel electrode as the reference electrode, and a Pt electrode as the auxiliary electrode. For the H2O2 sensing application, 0.1 M phosphate buffer solution (PBS, pH 7.4) was selected as the test solution. The PBS solution was prepared by mixing 0.1 M NaH2PO4 and 0.1 M Na2HPO4. The PBS solution was deoxygenated with pure N2 for 10 min before every electrochemical experiment. The test solution for the AA sensor application was a 0.1 M NaOH solution. The amperometric response tests were performed with constant stirring.
2.4 Experimental techniques
The scanning electron microscopy (SEM) images were recorded with a JSM-6700F scanning electron microscope (JEOL). Atomic force microscopy (AFM) images were obtained using a MultiMode 8 (Bruker Nano) atomic force microscope. A Tecnai G220 transmission electron microscope was used at an accelerating voltage of 200 kV to obtain transmission electron microscopy (TEM) images. Magnified TEM images were collected on a JEM-2100F field emission transmission electron microscope operated at 200 kV. Fourier transform infrared spectroscopy (FT-IR, Nicolet 6700, ThermoFisher Scientific Inc., Waltham, MA), X-ray diffraction (XRD, Rigaku D/max-2500 VB+/PC), and X-ray photoelectron spectroscopy (XPS, ThermoVG, ESCALAB 250) were utilized to measure the structures and characteristics of both MoS2 nanosheets and MoS2–OCu nanohybrids.3. Results and discussion
3.1 Synthetic mechanism of MoS2–OCu nanohybrids
Fig. 1 shows the synthetic process of MoS2–OCu nanohybrids through a two-step hydrothermal method. Bulk MoS2 was initially exfoliated to MoS2 nanosheets by the ultrasonic exfoliation method in NMP solution. It is well known that liquid-phase exfoliation is a facile method to obtain a range of layered 2D materials such as graphene and TMDs from a monolayer to few-layer nanosheets.33 The layered materials can be effectively exfoliated in solvents with a surface tension closely matching the surface energy of these materials, and NMP has previously been proven to be a good solvent for the liquid-phase exfoliation of MoS2.34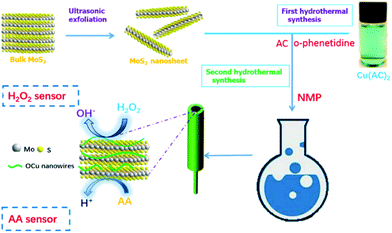 | ||
| Fig. 1 Schematic depiction of the two-step hydrothermal synthesis of MoS2–OCu nanohybrids and electrochemical sensing mechanisms. | ||
In the hydrothermal reaction, AC, o-phenetidine, and Cu(AC)2 were added to promote the chemical synthesis of OCu nanowires. O-Phenetidine underwent a polymerization reaction and generated poly(o-phenetidine), AC readily protonates poly(o-phenetidine), and carboxylic groups strongly coordinate Cu2+ ions, resulting in the formation of polymer chain-associated Cu2+ ions.35
We suggest that the association of polymers with Cu2+ is also ascribed to the chemical interaction between Cu2+ and the amine ligand group (–NH–) (Fig. 2).36 The obtained metal organic complex was then transferred to another flask with NMP and MoS2 nanosheets. Once OCu nanowires take part in the system, they spontaneously assemble on the surfaces of 2D MoS2 nanosheets through van der Waals interaction to form MoS2–OCu nanohybrids, as shown in Fig. 1.
 | ||
| Fig. 2 Molecular structures and synthesis mechanism for OCu nanowires. The complexes of Cu2+ with carboxylic acids are associated with protonated polymer chains. | ||
3.2 Morphological characterizations of MoS2 nanosheets and MoS2–OCu nanohybrids
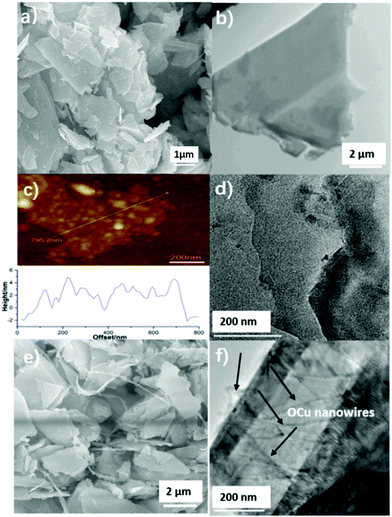
The morphological structure of the as-prepared MoS2 nanosheets is shown in Fig. 3a–d. Fig. 3a displays a typical SEM image that clearly reveals that the formed MoS2 nanosheets are stacked together. In order to examine the detailed structure of the MoS2 nanosheets, the prepared MoS2 nanosheets were further characterized with TEM and AFM. It can be seen in Fig. 3b that the as-prepared MoS2 sheets have a lamellar structure with multi-layers. The typical AFM image of the synthesized MoS2 nanosheets is displayed in Fig. 3c, which further confirms that MoS2 has a lamellar structure and the height of the MoS2 nanosheets is approximately 2–5 nm. A high-resolution TEM (HRTEM) edge image of MoS2 was also obtained, in which two levels of lamellar structure can be seen (Fig. 3d).Fig. 3e presents a typical SEM image of the hydrothermally synthesized MoS2–OCu nanohybrids. A comparison of the images without (Fig. 3a) and with (Fig. 3e) OCu nanowires reveals that the conjugation of OCu nanowires onto the MoS2 nanosheets reduced the stacking and increased the dispersity of the nanosheets. The modified OCu nanowires can also be clearly found in the magnified TEM image of MoS2–OCu nanohybrids (Fig. 3f), which illustrates that MoS2 nanosheets are covered with many OCu nanowires, as indicated by the arrows.
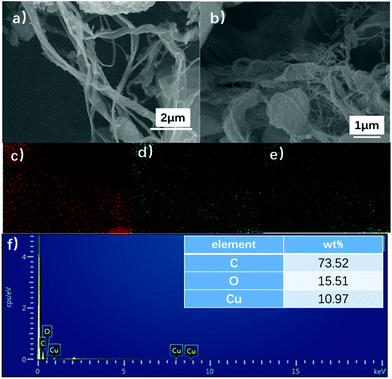
To understand the structure of OCu nanowires, the pure OCu nanowires that did not undergo conjugation with MoS2 nanosheets were measured with SEM. Typical images are provided in Fig. 4a and b, which show that the synthesized OCu nanowires are twisted with a length from a few to tens μm and a diameter of 20–40 nm. The elemental composition of the OCu nanowires was characterized by elemental mapping and is presented in Fig. 4c–e. The signals of three elements (Cu, O, and C) are clearly detected. Fig. 4f displays the energy dispersive X-ray spectroscopy (EDX) results for OCu nanowires, proving the presence of Cu, O, and C.
3.3 Characterizations of MoS2–OCu nanohybrids
The structure and properties of the prepared MoS2 nanosheets and MoS2–OCu nanohybrids were further studied with XRD and XPS techniques. Fig. 5a and b present the XPS spectra of MoS2 nanosheets and MoS2–OCu nanohybrids, respectively. It can be seen that both samples show bands at 162, 229, 285, 395, and 533 eV, which could be assigned to the characteristic peaks of S 2p, Mo 3d, C 1s, N 1s, and O 1s, respectively. We suggest that the binding energy between Mo and S is very strong after the addition of OCu, and therefore, OCu cannot change the crystallinity of MoS2. Additionally, in Fig. 3b, two new peaks appeared at 953 and 933 eV, which are ascribed to the characteristic bands of Cu 2p1/2 and Cu 2p3/2, respectively. The obtained XPS data indicate that MoS2 nanosheets were successfully modified by OCu.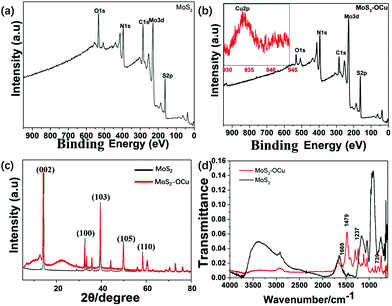 | ||
| Fig. 5 Structural characterizations of MoS2 and MoS2-OCu nanohybrids: (a, b) XPS spectra, (c) XRD patterns, and (d) FT-IR spectra. | ||
Fig. 5c displays the XRD patterns of MoS2 nanosheets and MoS2–OCu nanohybrids. It can be found that both samples contain the lattice planes of (002), (100), (103), (105), and (110), representing the broad diffraction peaks of MoS2 nanosheets.37 However, in the XRD pattern of MoS2–OCu nanohybrids, an obviously broader peak (22°) occurred, illustrating that an additional amorphous structure was attached to the MoS2 nanosheets. In order to determine the structure of MoS2–OCu, the synthesized MoS2 nanosheets and MoS2–OCu nanohybrids were measured with FT-IR, and the corresponding spectra are shown in Fig. 5d. Compared with MoS2, the spectrum of MoS2–OCu reveals three obvious absorption peaks at 1479 (–CH2–), 1237 (C–O–C), and 739 cm−1 (two substituted benzene rings). The above XRD and FT-IR results demonstrate that the synthesized MoS2–OCu nanohybrids are OCu-containing compounds.
3.4 Non-enzymatic electrochemical H2O2 sensor
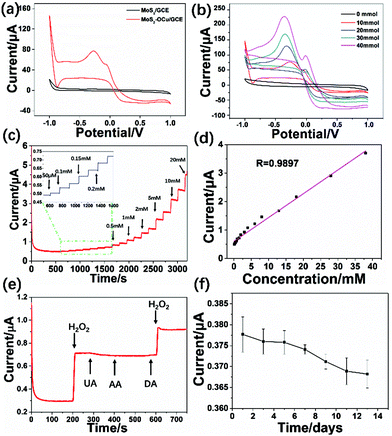
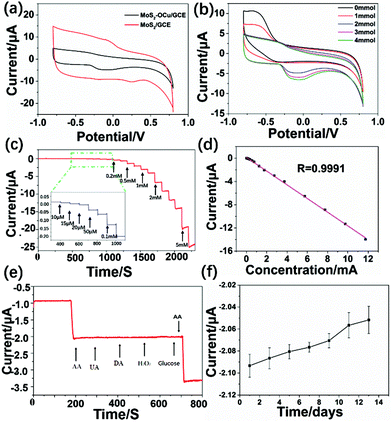
The created MoS2–OCu nanohybrids can be applied as an electrode material to modify GCEs and then to fabricate an electrochemical non-enzymatic sensor. Therefore, firstly we used the MoS2–OCu-modified GCE (MoS2–OCu/GCE) to fabricate an electrochemical sensor for detecting H2O2. A control experiment with the MoS2/GCE was also carried out in order to prove that this type of material can improve the performance of the sensors. In this work, it is expected that the fabricated electrochemical H2O2 sensor should show enhanced electrochemical sensing performance compared to some previously reported sensors.Fig. 6 shows the electrochemical detection of H2O2 with the fabricated MoS2–OCu/GCE-based sensor. Fig. 6a presents the CV data for both the MoS2/GCE and MoS2–OCu/GCE with the addition of 10 mM H2O2 under a scan of 100 mV s−1. It can be seen that the fabricated MoS2/GCE did not show redox processes, while for the fabricated MoS2–OCu/GCE, there is a strong current response with a clear reduction peak. The broad reduction peak begins at approximately −0.2 V and reached a maximum at −0.3 V due to the reduction of H2O2. The current responses of this electrode were examined at different H2O2 concentrations from 0 to 40 mM in order to further investigate the electrochemical behaviour of the fabricated MoS2–OCu/GCE, as shown in Fig. 6b. The obtained result proved that the redox peak current clearly increases with increasing H2O2 concentration.
Hence, an applied potential at −0.3 V was selected for the current–time (I–T) measurement in this work. Fig. 5c displays a typical I–T curve of the fabricated MoS2–OCu/GCE by successive addition of H2O2 at different concentrations in PBS. It can be seen that the fabricated MoS2–OCu/GCE displays a steady response over a long-term test after the addition of H2O2 at different concentrations. Fig. 6d shows the corresponding calibration curve, and a regular response to H2O2 can be observed. The linear range (LR) of the fabricated H2O2 sensor is from 0.085 to 38.0 mM (R = 0.9897, S/N = 3), and the limit of detection (LOD) was calculated to be 0.0767 μM. The LOD can be defined using the equation LOD = 3σ/S, where σ is the standard deviation of the response, and S is the slope of the curve.
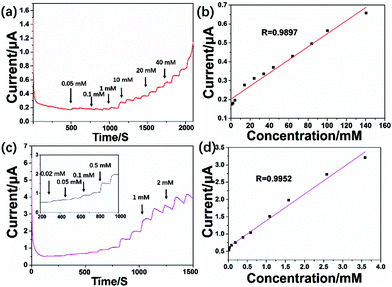
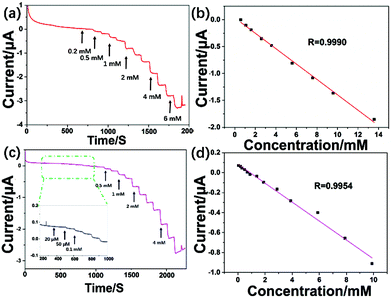
In order to investigate the electrochemical reaction effect of MoS2–OCu in sensing applications, both MoS2 and OCu were used for the individual fabrication of electrochemical sensors. Fig. 7 shows the electrochemical detection of H2O2 with the fabricated MoS2/GCE- and OCu/GCE-based sensors. It can be seen that the MoS2/GCE and OCu/GCE also display a steady response over a long-term test after addition of H2O2 at different concentrations. According to Fig. 7a and c, the MoS2-based sensor is not stable at low analyte concentrations, but the OCu-based sensor exhibits better stability. Fig. 7b and d give the corresponding calibration curves. It is clear that the LR of the fabricated MoS2-based H2O2 sensor is from 0.95 to 43.9 mM (R = 0.9897), and the LOD was calculated to be 0.85 μM. For the OCu-based H2O2 sensor, the LR is only from 0.015 to 3.58 mM (R = 0.9952), and the LOD is 0.038 μM. We suggest that combining MoS2 with OCu nanowires can reduce its LOD and expand its LR. Synergistic effects between MoS2 and OCu can improve the performance of the electrochemical sensor.
Compared with previous reports describing electrochemical H2O2 sensors, our fabricated MoS2–OCu-based H2O2 sensor exhibits a lower LOD and wider LR, as shown in Table 1.
The selectivity of the MoS2–OCu/GCE was measured under the potential of −0.30 V. Fig. 6e shows that the experiment tested the amperometric response when adding three other relevant electroactive species, UA, DA, and AA. It was found that there was no obvious interference, and a response occurred after successive addition of 3 mM AA, UA, and DA, but a stable electrical response could be seen after adding 2 mM of H2O2, indicating that our electrochemical sensor possesses high selectivity when detecting H2O2. Finally, Fig. 6f shows the long-term stability of the MoS2–OCu/GCE over 14 days. The fabricated GCE was then stored in air at room temperature and tested every 2 days. It can be seen from the image that the current response still maintained more than 95.9% of its initial value in response to 2 mM H2O2 after 14 days, indicating that the stability of our electrochemical H2O2 sensor is acceptable. The decrease in the value of the current response for the H2O2 sensor may have possibly occurred because of the removal of material from the GCE and electrochemical corrosion of the working electrode during multiple tests.
3.5 Non-enzymatic electrochemical ascorbic acid sensor
The synthesized MoS2–OCu nanohybrids were further used to modify GCEs and fabricate a non-enzymatic electrochemical AA sensor. Fig. 8a presents the CV data for both the MoS2/GCE and MoS2–OCu/GCE in the absence of 1 mM AA in 0.1 M NaOH, and it was found that both oxidation processes can be seen in the MoS2/GCE and MoS2–OCu/GCE. For the MoS2–OCu/GCE, there is an obvious current response with a broad oxidation peak, with the oxidation process occurring from +0.2 to −0.3 V due to the oxidation of AA. The current responses of the MoS2–OCu/GCE were tested at different AA concentrations from 0 to 4 mM to investigate the electrochemical behavior of the fabricated MoS2–OCu/GCE, as shown in Fig. 8b. The above result indicates that the oxidation peak current obviously increases with the increasing AA concentration, and therefore, the fabricated MoS2–OCu/GCE could be potentially used as an electrochemical sensor.Therefore, we chose an applied potential at −0.25 V for the I–T experiment in this test. Fig. 8c displays the obtained I–T curve of the fabricated sensor under successive addition of AA at different concentrations in the NaOH system. The fabricated MoS2–OCu/GCE displays a stable response over the long-term test upon the addition of AA solution at different concentrations. Fig. 8d shows the calibration curve, and a regular response to AA can be seen. The LR of the fabricated AA sensor is from 0.015 to 11.75 mM (R = 0.9991, S/N = 3), and the LOD is calculated to be 0.0222 μM. MoS2 and OCu were also individually used for fabricating AA sensors. Both sensors displayed a steady response over a long-term test after addition of AA at different concentrations (Fig. 9). For the MoS2-based AA sensor, the LR is from 0.585 to 13.6 mM with a LOD of 0.21 mM (R = 0.9990). The LR of the OCu-based AA sensor is from 0.07 to 9.1 mM with a LOD of 0.031 mM (R = 0.9954). Comparing these three sensors, we can draw a conclusion that the introduction of OCu can reduce the LOD of the sensor and increase its sensitivity when the analyte concentration is low. All the results proved that there are synergistic effects of the sensors that can be used to improve the sensing performance in the field of electrochemical sensors.
Compared with previous studies on electrochemical AA sensors, our fabricated MoS2–OCu sensor also shows a wider LR and lower LOD in the detection of AA, as is shown in Table 2.
| Materials | LR (mM) | LOD (μM) | Ref. |
|---|---|---|---|
| N-Doped graphene | 0.005–1.3 | 2.2 | 7 |
| Graphene | 0.4–6 | 0.12 | 41 |
| o-Aminophenol | 0.002–0.2 | 0.86 | 42 |
| Protein–AuNC | 0.015–0.1 | 0.2 | 43 |
| Cu4(OH)6SO4 | 0.017–6.4 | 6.4 | 44 |
| Fe2O3/Au | 0.025–10 | 1 | 45 |
| Copper vanadate | 0.001–2 | 0.9 | 46 |
| C-MWCNT/PANI | 0.002–0.206 | 1.1 | 47 |
| MoS2–OCu | 0.015–11.75 | 0.022 | This work |
The anti-interference test of the fabricated MoS2–OCu/GCE was observed at the potential of −0.25 V. There was no obvious interference, and a response can be seen after successive addition of 3 mM UA, DA, H2O2, and glucose (Fig. 8e). However, a stable electrical response occurs after adding 1 mM AA, indicating that our AA sensor possesses high selectivity when detecting AA. Finally, we tested the long-term stability of the MoS2–OCu/GCE over 14 days (Fig. 8f). The obtained result indicates that 98.1% of the initial value of the catalytic current response still has been maintained when 2 mM AA was added after 14 days, indicating that our electrochemical AA sensor possesses good stability.
4. Conclusions
In summary, we successfully decorated MoS2 nanosheets with OCu nanowires to fabricate the novel MoS2–OCu nanohybrid. We found that the MoS2 nanosheets act as active materials and provide improved electrochemical activities for the fabricated non-enzymatic electrochemical H2O2 and AA sensors. First, the large surface area of the MoS2 nanosheets ensures sufficient reactive active sites, making the nanosheet an ideal active material as an electrochemical substrate. Second, the synthesized OCu nanowires act as spacers to prevent MoS2 nanosheets from restacking and increase the surface area and active sites of the MoS2 nanosheets. Because of these two attributes, the synthesized MoS2–OCu nanohybrids are ideal potential electrode materials that can be used in the fabrication of both H2O2 and AA sensors with a wider LR and lower LOD. A very low LOD for H2O2 (0.0767 μM) and AA (0.0222 μM) was found in this study. It is expected that further applications of OCu nanowires in materials science, analytical science, and nanotechnology will be explored, and the two-step hydrothermal synthesis strategy shown in this work will be valuable for guiding the design and synthesis of other functional hybrid nanomaterials with 1D, 2D, and 3D structures.Conflicts of interest
There are no conflicts to declare.Acknowledgements
We gratefully acknowledge the financial support from the National Natural Science Foundation of China (NSFC, grant no. 51573013) and Deutsche Forschungsgemeinschaft (DFG) under grant WE 5837/1-1.Notes and references
- P. Zhang, X. Zhao, X. Zhang, Y. Lai, X. Wang, J. Li, G. Wei and Z. Su, ACS Appl. Mater. Interfaces, 2014, 6, 7563–7571 CAS.
- P. Zhang, X. Zhang, S. Zhang, X. Lu, Q. Li, Z. Su and G. Wei, J. Mater. Chem. B, 2013, 1, 6525 RSC.
- Y. Ma, M. G. Zhao, B. Cai, W. Wang, Z. Z. Ye and J. Y. Huang, Biosens. Bioelectron., 2014, 59, 384–388 CrossRef CAS PubMed.
- J. H. James, O. David, E. L. Paul, M. W. George and S. W. Mark, Science, 1991, 254, 501–502 Search PubMed.
- Z. Ouyang, J. Li, J. Wang, Q. Li, T. Ni, X. Zhang, H. Wang, Q. Li, Z. Su and G. Wei, J. Mater. Chem. B, 2013, 1, 2415 RSC.
- J. Ding, K. Zhang, G. Wei and Z. Su, RSC Adv., 2015, 5, 69745–69752 RSC.
- Z. H. Sheng, X. Q. Zheng, J. Y. Xu, W. J. Bao, F. B. Wang and X. H. Xia, Biosens. Bioelectron., 2012, 34, 125–131 CrossRef CAS PubMed.
- H. Peng, C. Soeller, N. Vigar, P. A. Kilmartin, M. B. Cannell, G. A. Bowmaker, R. P. Cooney and J. Travas-Sejdic, Biosens. Bioelectron., 2005, 20, 1821–1828 CrossRef CAS PubMed.
- J. Guan, J. Peng and X. Jin, Anal. Methods, 2015, 7, 5454–5461 RSC.
- X. Wang, Q. Han, S. Cai, T. Wang, C. Qi, R. Yang and C. Wang, Analyst, 2017, 142, 2500–2506 RSC.
- M. Xu, J. M. Han, Y. Zhang, X. Yang and L. Zang, Chem. Commun., 2013, 49, 11779–11781 RSC.
- S. Huang, F. Zhu, Q. Xiao, W. Su, J. Sheng, C. Huang and B. Hu, RSC Adv., 2014, 4, 46751–46761 RSC.
- D. Li, W. Zhang, X. Yu, Z. Wang, Z. Su and G. Wei, Nanoscale, 2016, 8, 19491–19509 RSC.
- P. Si, Y. Huang, T. Wang and J. Ma, RSC Adv., 2013, 3, 3487 RSC.
- H. Zhu, L. Li, W. Zhou, Z. Shao and X. Chen, J. Mater. Chem. B, 2016, 4, 7333–7349 RSC.
- M. Zhang, Y. Li, Z. Su and G. Wei, Polym. Chem., 2015, 6, 6107–6124 RSC.
- E. B. Bahadır and M. K. Sezgintürk, Trends Anal. Chem., 2016, 76, 1–14 CrossRef.
- W. Zhang, P. Zhang, Z. Su and G. Wei, Nanoscale, 2015, 7, 18364–18378 RSC.
- B. Radisavljevic, A. Radenovic, J. Brivio, V. Giacometti and A. Kis, Nat. Nanotechnol., 2011, 6, 147–150 CrossRef CAS PubMed.
- Y. M. Chhowalla, H. S. Shin, G. Eda, L. Li, K. P. Loh and H. Zhang, Nat. Chem., 2013, 5, 263–275 CrossRef PubMed.
- X. Zhao, Y. Li, Y. Guo, Y. Chen, Z. Su and P. Zhang, Adv. Mater. Interfaces, 2016, 3, 1600658 CrossRef.
- Y. Cheng, S. Lu, F. Liao, L. Liu, Y. Li and M. Shao, Adv. Funct. Mater., 2017, 27, 1700359 CrossRef.
- Y. X. Wang, S. L. Chou, D. Wexler, H. K. Liu and S. X. Dou, Chemistry, 2014, 20, 9607–9612 CrossRef CAS PubMed.
- P. Zhang, X. Lu, Y. Huang, J. Deng, L. Zhang, F. Ding, Z. Su, G. Wei and O. G. Schmidt, J. Mater. Chem. A, 2015, 3, 14562–14566 CAS.
- T. Wang, H. Zhu, J. Zhuo, Z. Zhu, P. Papakonstantinou, G. Lubarsky, J. Lin and M. Li, Anal. Chem., 2013, 85, 10289–10295 CrossRef CAS PubMed.
- J. Ping, Z. Fan, M. Sindoro, Y. Ying and H. Zhang, Adv. Funct. Mater., 2017, 27, 1605817 CrossRef.
- D. Lin, Y. Li, P. Zhang, W. Zhang, J. Ding, J. Li, G. Wei and Z. Su, RSC Adv., 2016, 6, 52739–52745 RSC.
- S. Su, X. Y. Han, Z. W. Lu, W. Liu, D. Zhu, J. Chao, C. H. Fan, L. H. Wang, S. P. Song, L. X. Weng and L. H. Wang, ACS Appl. Mater. Interfaces, 2017, 9, 12773–12781 CAS.
- J. Chao, M. Zou, C. Zhang, H. Sun, D. Pan, H. Pei, S. Su, L. Yuwen, C. Fan and L. Wang, Nanotechnology, 2015, 26, 274005 CrossRef PubMed.
- H. Sun, J. Chao, X. Zuob, S. Su, X. Liu, L. Yuwen, C. Fan and L. Wang, RSC Adv., 2014, 4, 27625–27629 RSC.
- C. Zhu, G. Yang, H. Li, D. Du and Y. Lin, Anal. Chem., 2015, 87, 230–249 CrossRef CAS PubMed.
- S. Fu, C. Zhu, J. Song, M. Engelhard, H. Xia, D. Du and Y. Lin, ACS Appl. Mater. Interfaces, 2016, 8, 22196–22200 CAS.
- A. O'Neill, U. Khan and J. N. Coleman, Chem. Mater., 2012, 24, 2414–2421 CrossRef.
- J. N. Coleman, M. Lotya, A. O'Neill, S. D. Bergin, P. J. King, U. Khan, K. Young, A. Gaucher, S. De, R. J. Smith, I. V. Shvets, S. K. Arora, G. Stanton, H. Y. Kim, K. Lee, G. T. Kim, G. S. Duesberg, T. Hallam, J. J. Boland, J. J. Wang, J. F. Donegan, J. C. Grunlan, G. Moriarty, A. Shmeliov, R. J. Nicholls, J. M. Perkins, E. M. Grieveson, K. Theuwissen, D. W. McComb, P. D. Nellist and V. Nicolosi, Science, 2011, 331, 568–571 CrossRef CAS PubMed.
- J. Shi, J. Li, X. Huang and Y. Tan, Nano Res., 2011, 4, 448–459 CrossRef CAS.
- Y. W. Tan, X. Xue, Q. Peng, H. Zhao, T. Wang and Y. Li, Nano Lett., 2007, 7, 3723–3728 CrossRef CAS.
- Y. Liu, X. He, D. Hanlon, A. Harvey, J. N. Coleman and Y. Li, ACS Nano, 2016, 10, 8821–8828 CrossRef CAS PubMed.
- Y. Li, P. Zhang, Z. Ouyang, M. Zhang, Z. Lin, J. Li, Z. Su and G. Wei, Adv. Funct. Mater., 2016, 26, 2122–2134 CrossRef CAS.
- C. Xu, J. Wang and J. Zhou, Sens. Actuators, B, 2013, 182, 408–415 CrossRef CAS.
- X. Du, Y. Chen, W. Dong, B. Han, M. Liu, Q. Chen and J. Zhou, Oncotarget, 2016, 8, 13039–13047 Search PubMed.
- G. P. Keeley, A. O'Neill, N. McEvoy, N. Peltekis, J. N. Coleman and G. S. Duesberg, J. Mater. Chem., 2010, 20, 7864 RSC.
- H. M. Nassef, L. Civit, A. Fragoso and C. K. O'Sullivan, Analyst, 2008, 133, 1736–1741 RSC.
- X. Wang, P. Wu, X. Hou and Y. Lv, Analyst, 2013, 138, 229–233 RSC.
- C. Xia and W. Ning, Analyst, 2011, 136, 288–292 RSC.
- Y. Yin, J. Zhao, L. Qin, Y. Yang and L. He, RSC Adv., 2016, 6, 63358–63364 RSC.
- L. Pei, N. Lin, T. Wei, H. Liu and H. Yu, J. Mater. Chem. A, 2015, 3, 2690–2700 CAS.
- N. Chauhan, J. Narang and C. S. Pundir, Analyst, 2011, 136, 1938–1945 RSC.
| This journal is © the Partner Organisations 2018 |

