Study of the interactions of influencing parameters on electrocatalytic determination of dopamine by a carbon paste electrode based on Fe(II)–clinoptilolite nanoparticles†
Niloufar
Ghasemi
ab and
Alireza
Nezamzadeh-Ejhieh
 *abc
*abc
aDepartment of Chemistry, Shahreza Branch, Islamic Azad University, P.O. Box 311-86145, Shahreza, Isfahan, Iran. E-mail: arnezamzadeh@iaush.ac.ir; Fax: +98 31-53291018; Tel: +98 31-53292515
bYoung Researchers and Elite Club, Shahreza Branch, Islamic Azad University, Shahreza, Iran
cRazi Chemistry Research Center (RCRC), Shahreza Branch, Islamic Azad University, Isfahan, Iran. Tel: +98 31-53292500
First published on 23rd November 2017
Abstract
In this study, after ion exchange of clinoptilolite nanoparticles (CLN) in Fe(II) solution, the prepared Fe(II)–CLN was used for the modification of a carbon paste electrode (CPE). The resultant Fe(II)–CLN–CPE showed an electrocatalytic effect on dopamine (DA) in the voltammetric analysis. Despite of the common studies, the focus of this work is to study of the interaction effects of influencing variables on the electrode response in DA determination. Hence, an experimental design was subjected to this study using response surface methodology (RSM). Under the optimal conditions, a linear response in the range from 0.1 to 47 μmol L−1 DA with a detection limit of 0.01 μmol L−1 DA was obtained in the square wave voltammetric analysis.
1. Introduction
Dopamine (DA: 3,4-dihydroxyphenethylamine), comprising a catecholamine group, plays an important role in the central nervous, hormonal, renal, and cardiovascular systems. In the brain, dopamine acts as a neurotransmitter (a chemical is released by neurons or nerve cells for sending signals to other nerve cells) and a motor control (to control the release of various hormones). In addition, dopamine acts as a local chemical messenger outside of the nervous system. It inhibits norepinephrine release in blood vessels and at normal concentrations, it acts as a vasodilator. DA increases sodium excretion and urine output in the kidneys. It can reduce insulin production in the pancreas. Dopamine reduces gastrointestinal motility and hence protects the intestinal mucosa in the digestive system. Finally, it reduces the activity of lymphocytes in the immune system. Hence, an imbalance in the dose of DA in the human body causes numerous diseases, including schizophrenia and Parkinson's disease. Loss of dopamine-secreting neurons in an area of the midbrain (which is called the substantia nigra) causes Parkinson's disease (a degenerative condition causing tremor and motor impairment).1,2According to the above discussion, monitoring of the dosage of DA in blood or urine is very important because its amount can be considered as important early warning signs for diseases of the central nervous system. Thus far, many analytical methods such as spectrophotometry3 and electrochemistry have been widely used for determination of dopamine. Among them, electrochemical methods based on chemically modified electrodes have attracted the most interest because of its low-cost, high sensitivity and selectivity.4–7 Despite many reported studies for the determination of DA in the mixture with ascorbic acid, uric acid etc.,8,9 this work focused on the study of the interaction effects of the influencing parameters on the voltammetric determination of dopamine. By knowing these interactions, we can optimize the conditions for increasing the selectivity of the method for the quantitative determination of DA in real samples. Hence, we constructed a modified carbon paste electrode with Fe(II)-exchanged clinoptilolite as an effective electrocatalyst for the voltammetric determination of DA. In general, zeolite modified electrodes (ZMEs) have an important difference with other chemically modified electrodes (CMEs) because all features of ZMEs depend on the ion exchange step, which should be conducted before any redox process. After the preliminary studies for confirming the constructed electrode for the DA determination, the experiments were designed by response surface methodology (RSM) to study the interactions between the selected experimental parameters as the most important influencing factors.
2. Experimental
2.1. Materials, solutions and preparations
Dopamine, ferrous ammonium sulfate hexahydrate, graphite powder, Nujol oil and other chemicals used in our study (analytical grade) were obtained from Merck or Aldrich companies. The natural clinoptilolite zeolite belongs to the Semnan province of Iran (Afrandtooska Co.). Doubly distilled water was used throughout this study. A daily prepared 0.001 mol L−1 of dopamine (stock solution) was used for the preparation of diluted solutions (serial dilution method was used). The human serum samples were prepared from the laboratory of Al Zahra Hospital (Isfahan, Iran).The clinoptilolite microparticles (CLM) were converted to nanoparticles (CLN) via a ball-mill process. Both CLM and CLN powders were heated to 70 °C (as the aqueous suspensions) on a magnetic stirrer and maintained at this temperature for 8 h (repeated 3 times) to remove the water-soluble and magnetic impurities. The solid fractions were separated by centrifugation at >13![[thin space (1/6-em)]](https://www.rsc.org/images/entities/char_2009.gif) 000 rpm.
000 rpm.
To perform the ion exchange process for the preparation of Fe(II)–CLN (or Fe(II)–CLM), 0.2 g of each powder was added to 10 mL of a 0.7 mol L−1 Fe(II) solution (containing 1% NH2OH·HCl to prevent the oxidation of Fe(II) cations) and the mixture was agitated for 12 h (duplicated runs were done). The resultant Fe(II)–CLN or Fe(II)–CLM was separated by centrifugation of the suspensions and washed with a 2% HCl solution to remove the surface-adsorbed species. Finally, the product was washed with water to remove the adsorbed chloride ions.
A mixture of Nujol oil and graphite powder containing 10 wt% of organic oil was thoroughly mixed in an agate mortar (30 min). For the preparation of the modified carbon paste (CP), an adequate amount of Fe(II)–CLN was added to about 0.008 g of the prepared CP. The resultant composite was mixed thoroughly to obtain the modified Fe(II)–CLN–CP. For the preparation of Fe(II)–CLN–CPE, the resultant paste was forced into an insulin syringe and well-packed by mechanical force. The electrical contact was achieved by insertion of a Cu-rod into the opposite end of the syringe.
2.2. Apparatus and procedure
The XRD pattern of Fe(II)–CLN was recorded by a X'PertPro XRD analytical diffractometer (Ni-filtere, CuKα radiation at 1.5406 Å, accelerating voltage: 40 kV, i: 30 mA; Netherlands). A potentiostat/galvanostat (Autolab, PGSTAT-101, EcoChemie, Netherlands) equipped with a NOVA 1.8 software was used for performing the voltammetric measurements. The voltammetric cell contained a three-electrode system including an Ag/AgCl, the Fe(II)–CLN–CPE, and a platinum rod as the reference, working, and auxiliary electrodes, respectively. The working solution was purged with a N2 gas (with a high purity of 99.99%) for 5 min before the voltammetric runs. The electrode surface was renewed by polishing its surface on a glassy paper and then rinsed with water.2.3. Experimental design
To design the experiments, the Design Expert version 9.0.5.1 software was used. The most important influencing experimental variables in the square wave voltammetric measurements used in the RSM method for designing the experiments together with the corresponding levels are summarized in Table 1.| Factors | −1 level | +1 level | −α | +α |
|---|---|---|---|---|
| A: pH | 2 | 5 | 0.5 | 6.5 |
| B: modifier (%) | 15 | 25 | 10 | 30 |
| C: step potential (mV) | 8.25 | 22.75 | 1 | 30 |
| D: amplitude (mV) | 32.5 | 77.5 | 10 | 100 |
3. Results and discussions
3.1. Characterization of samples
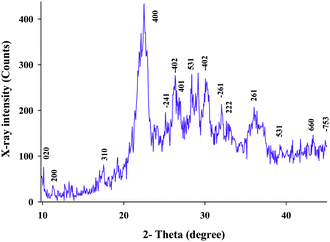
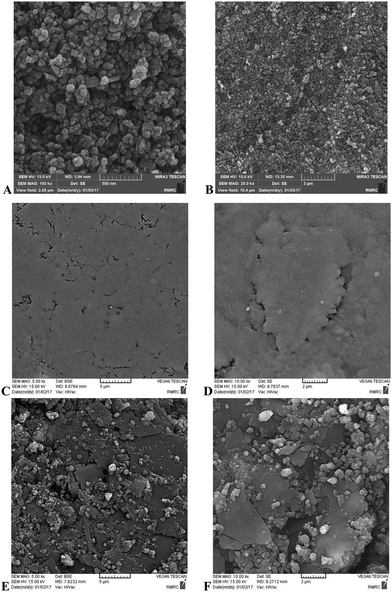
Fig. 1 shows the recorded XRD pattern for the Fe(II)-exchanged zeolite sample. The XRD peaks were in accordance with the references, which confirmed that this pattern agreed with that of clinoptilolite according to JCPDS no. 39-1383 and the literature.10 All hkl planes of clinoptilolite were assigned. The pattern confirms that the crystallite phase of clinoptilolite was retained after the Fe(II)-exchange process. An average crystallite size of 25 nm was estimated for the sample using the Scherer equation.11The SEM images of Fe(II)–CLN are shown in Fig. 2(A and B), confirming the production of nanoparticles during the mechanical ball-mill process. When these images were compared with those of the raw CPE (Fig. 2C and D) and the modified CPE (Fig. 2E and F), the well-dispersed Fe(II)–CLN particles through the CPE matrix can be observed.
3.2. Cyclic voltammetric (CV) experiments
| Fe(z)2+ + 2C(s)+ → 2C(z)+ + Fe(i)2+ | (1) |
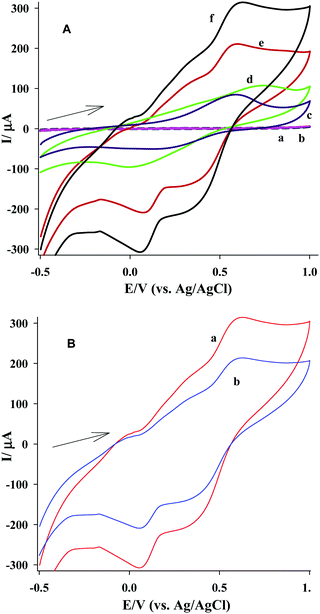
These Fe(II) cations can be oxidized/reduced at forward/backward scans and create well-resolved redox peak currents. When H+ acts an exchangeable cation, higher amounts of Fe(II) can reached the electrode-solution interface because of the higher mobility of protons with respect to sodium or potassium cations (effective ionic radius: H3O+ [1 Å] < Na+ [1.7 Å] < K+ [2 Å]). In general, a higher charge density of the exchangeable cations present in the solution causes the higher ion exchange ability with zeolites. In addition, the presence of Lewis basic sites in zeolites increases the selectivity of zeolite towards protons. The mechanism for accepting of cations by zeolites can also change the selectivity of zeolites towards the cationic species. Sodium and potassium cations can bond to zeolites via electrostatic interactions, while protons can bond through the hydrogen bonding, which is much stronger than the electrostatic force.15 Hence, among the tested cations, the reaction (1) is more favorable in the presence of protons in the solution.
As we know, there are different ion exchange sites in zeolites. Some of them are present on the surface of zeolites; hence, the Fe(II) cations present in such surface ion exchange sites can rapidly participate in the electro-oxidation process at smaller positive potentials. The Fe(II) cations present in the entrance of the pores of zeolite can be oxidized at the second step and finally the Fe(II) cations present in the inner ion exchange sites of zeolite can participate in the electro-oxidation process because longer times were needed for them to locate at the electrode surface via the ion exchange. Hence, different redox peaks were observed for the process.
| Fe(i)2+ → Fe(i)3+ + e− | (2) |
As shown in Fig. 3B, the modified CPE with nanoparticles of zeolite created higher peak currents than those created by the Fe(II)–CLM–CPE. This can be related to a higher surface area of nanoparticles and more accessible internal ion exchange sites of zeolite because of a reduced path length in nanoparticles.
Comparison of the voltammograms ‘e’ and ‘f’ in Fig. 3A reveals that by adding dopamine to the supporting electrolyte, the peak current of the Fe(II) cations increased. This behavior can be interpreted by the electrocatalytic reaction taking place between the produced Fe(III) cations in the forward scan and the DA molecules at the electrode-solution interface (reaction (3)). This reaction provides higher amounts of Fe(II) at the electrode-solution interface, causing an increase in the peak current of Fe(II). This increase in the anodic peak current was used for the quantitative determination of DA by the square wave voltammetry (see subsequent sections). Simultaneously, when this homogeneous reaction took place at the electrode-solution interface, the ion exchange and oxidation processes also took place via the reactions (1) and (2). In general, carrying out these reactions simultaneously caused an accumulation of more Fe(III) cations at the electrode-solution interface before they can diffuse to the bulk solution, causing the increase in the cathodic peak current with respect to the case where no DA was present in the solution.
| 2Fe(i)3+ + DA(i) → 2Fe(i)2+ + DA(i)2+ + 2H+ | (3) |
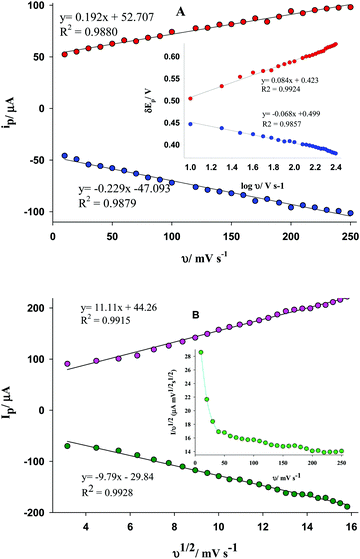
| Ip = n2F2AΓν/4RT | (4) |
The inset of Fig. 4A shows a linear relationship between ΔEp (ΔEp = Epc − Eo′ or Epa − Eo′) versus log(ν). Using the slopes of these equations (−2.303RT/αnF = −0.068 and 2.303RT/(1 − α)nF = 0.084) and the Laviron equation,16αc and αa (charge transfer coefficients) were estimated to be about 0.87 and 0.93, respectively. In addition, the mean values of ks (the apparent charge transfer rate constant) for the cathodic and anodic reactions were estimated to be about 5.1 × 10⁻⁴ and 2.24 × 10⁻³ s−1, respectively.
As shown in Fig. 4B, both anodic and cathodic peak currents have a linear relationship with the square root of the scan rate in the presence of DA. This agrees with a diffusion-controlled reaction.17 Moreover, in the presence of DA, the increase in the peak current of Fe(II) oxidation depends on the diffusion of DA to the electrode-solution interface from the bulk solution. To confirm the electrocatalytic process for the system, the plot of normalized anodic current (ip/ν) versus the potential scan rate is shown in the inset of Fig. 4B, confirming the electrocatalytic process.18
To confirm these observations, the plots of lg(i)–lg(v) were constructed at different scan rates (for the anodic peak current). Based on the slope of the equation of lg(i) = n·lg(v) + m, if the n value approaches 1.0, it is an adsorption-controlled electrochemical process; while if the n value approaches 0.5, it is a diffusion-controlled electrochemical process. The equations of y = 1.41 + 0.87x (r2= 0.9959) and y = 1.32 + 0.43x (r2 = 0.9972) were obtained in the absence and the presence of DA, confirming the surface-confined and the diffusion-controlled processes for these solutions, respectively.
3.3. Designing the experiments
To design the experiments, the levels defined for the selected factors (Table 1) were subjected to the software (Design Expert 9.0.5.1). For this, 30 runs were suggested by the software (including 24 experiments plus 6 central points) in order to estimate the experimental error. Hence, the square wave voltammetric experiments were conducted at the conditions suggested for each run in the absence and the presence of DA. The response variable Y (Y = Δi as the difference between the anodic peak currents in the absence and the presence of DA) was calculated (see TSM. 1, ESI†).The β0, βi, βii, βij, and ε coefficients (intercept of the independent term, linear, squared, interaction coefficients, and the experimental error, respectively) of the quadratic equation (eqn (5)) were determined by the software as shown in eqn (6). A synergistic effect can be expected for the terms with a plus sign.
| Y = β0 + ∑βixi + ∑βiixi2 + ∑βijxixj + ε | (5) |
| Y = 22.57 − 7.88A − 1.08B + 0.11C + 0.13D − 0.09A × B − 0.11A × C − 0.12A × D + 0.01B × C + 2.46 × 10⁻³B × D − 3.94 × 10⁻⁴C × D + 1.81A2 + 0.03B2 + 7.03 × 10⁻³C2 + 3.89 × 10⁻³D2 | (6) |
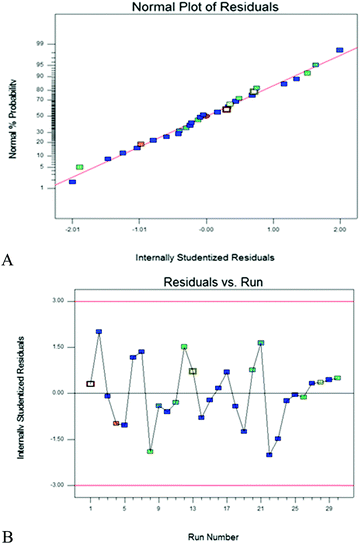
Fig. 5A and B show the plots of the normal probability of internal residuals and residuals versus runs, respectively. Both plots confirm the normal distribution of the residuals in different runs and all experimental runs (99.7%) have the residuals between ±3σ. This confirms the effectiveness of the model for processing the data.
The F-value of the model (Table 2) is 379.48, which was obtained by applying the analysis of the variance (ANOVA) on the results. The value is smaller than the critical value of F0.05,14,15 = 2.42, confirming the effective processing of the data by the applied model at a 95% confidence interval. When the lack of fit term (LOF) is not significant (its F-value of 0.89 is smaller than F0.05,15,5 = 4.62), it indicates that the random errors are the reason for variation between the obtained data. As shown at the bottom of Table 2, the R-square and adjusted R-square are 0.9972 and 0.9946, respectively, confirming the good regression of the data by the model. A similar value between the adjusted-R2 and the R-square confirms that all of the selected factors are important in the created response.
| Source | Sum of sq. | df | Mean sq. | F values | p values |
|---|---|---|---|---|---|
| Std. dev 0.71, mean 7.35, C.V.% 9.70, PRESS 32.11, R-squared 0.9972, adj. R-squared 0.9946, pred R-square 0.9881, AdeqPrecisio 65.468.a Significant.b Not significant. | |||||
| Model | 2700.59 | 14 | 192.90 | 379.48 | <0.0001a |
| A-pH | 1427.76 | 1 | 1427.76 | 2808.78 | <0.0001 |
| B-mod% | 21.59 | 1 | 21.59 | 42.48 | <0.0001 |
| C-step pot. | 30.39 | 1 | 30.39 | 59.79 | <0.0001 |
| D-ampl. | 426.83 | 1 | 426.83 | 839.68 | <0.0001 |
| AB | 7.37 | 1 | 7.37 | 14.50 | 0.0017 |
| AC | 22.45 | 1 | 22.45 | 44.17 | <0.0001 |
| AD | 248.62 | 1 | 248.62 | 489.11 | <0.0001 |
| BC | 2.71 | 1 | 2.71 | 5.32 | 0.0357 |
| BD | 1.22 | 1 | 1.22 | 2.39 | 0.1427 |
| CD | 0.066 | 1 | 0.066 | 0.13 | 0.7234 |
| A2 | 453.34 | 1 | 453.34 | 891.83 | <0.0001 |
| B2 | 17.47 | 1 | 17.47 | 34.36 | <0.0001 |
| C2 | 3.75 | 1 | 3.75 | 7.37 | 0.0160 |
| D2 | 106.17 | 1 | 106.17 | 208.86 | <0.0001 |
| Residual | 7.62 | 15 | 0.51 | — | — |
| Lack of fit | 4.89 | 10 | 0.49 | 0.89 | 0.5900b |
| Pure error | 2.73 | 5 | 0.55 | — | — |
| Cor total | 2708.21 | 29 | — | — | — |
The applicability of the model was tested by carrying out some of the measurements at the conditions suggested by a selected run (pH 2, step potential = 22.75 mV, amplitude = 77.50 mV, modifier% = 22.22%, frequency = 15 Hz, and CDA = 0.26 mM). The average of the observed results was 28.7 ± 0.2 (n = 3), which agrees with the predicted response (28.91 ± 0.85).
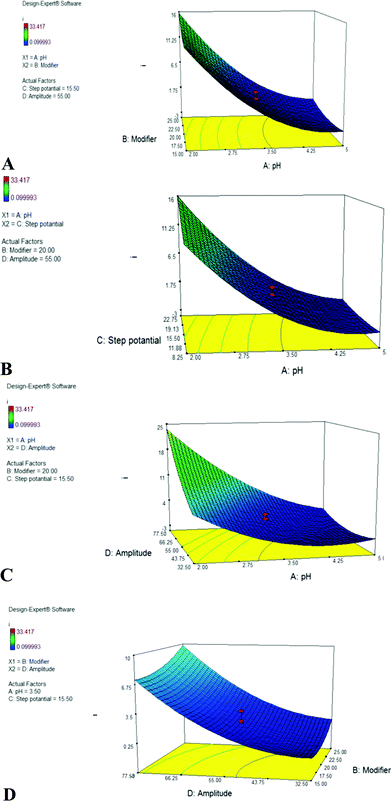
The visualized interaction effects of the binary factors (while the others were fixed) can be shown by the 3D response surfaces (Fig. 6). In general, in all cases, including the effect of pH, more strong acidic pHs (about 2–2.5) have an important role in the peak current. Moreover, based on the ion exchange reaction (reaction (1)), at such acidic pHs more Fe(II) cations can reach the electrode surface. In addition, such acidic pHs retain the Fe(II) cations in the ionic form and prevent them from hydrolysis. Hence, when a lower modifier percentage was used in the modified CPE, strong acidic pH solutions were more favorable for bringing sufficient Fe(II) at the electrode surface, but higher dosages of the modifier were more suitable (Fig. 6A).
The effect of pH on the direct electro-oxidation of DA has been studied in the literature. For example, it has been shown that by increasing the pH from 3 to 8, the anodic peak current of dopamine on a modified catechol-glassy carbon electrode was slightly increased. In general, the direct oxidation of DA is a two-electron process, which evolves two protons.19 In contrast, DA is extremely unstable in the alkaline media. Hence, neutral and weak acidic pHs appear to be more suitable for the direct electro-oxidation of DA. In another study, the best peak current was obtained for the DA electro-oxidation on the surface of a cysteine-glassy carbon electrode at pH about 4–4.5 and then decreased.20 DA has acidic dissociation constants of pKa1 (H3DA+) = 8.71 (phenol), pKa1 (H2DA) = 10.90 (amine), and pKa1 (HAD−) = 13.68 (phenol). These values indicate that the protonated and neutral forms of DA are more favorable forms for the electro-oxidation. Moreover, the deprotonated DA species are more stable due to their higher resonance. Based on these observations, the pH range about 3–5 appears to be more suitable for the direct electro-oxidation of DA. However, in this study, the peak current of the Fe(II) electro-oxidation increased in the presence of DA at strong acidic pH of about 2 because pH 2 severely favored the reaction (1) and hence the reaction (2). At this pH, the protonated forms of DA are present in the solution, which are more suitable for the oxidation by the Fe(III) cations.
When the step potential was increased (Fig. 6B), the best response was obtained at the acidic pHs. In the square wave voltammetry, the product of the step potential at a given frequency controls the scan rate. At lower scan rates or lower step potentials, the Fe(II) cations that reach the electrode surface can diffuse to the bulk solution before the potential reaches an adequate value for oxidizing the Fe(II) cations. Hence, faster scan rates are needed to oxidize the Fe(II) cations before they can move away from the electrode surface.
Such effects are observed in the interactions of pH-amplitude (Fig. 6C). As shown in Fig. 6D, in the entire range of modifier percentage, a higher amplitude value is more suitable because it provides a suitable potential for the rapid Fe(II) oxidation, preventing the diffusion of Fe(II) to the bulk solution.
3.4. Characteristics of the electrode
The preliminary studies confirmed that the electrode response corresponds to the DA concentration in the solution. Hence, the as-prepared electrode was used for the quantitative analysis of DA by square wave voltammetry at the optimized conditions suggested by RSM (step potential = 22.5 mV, amplitude = 77.5 mV, frequency = 15 Hz, and 25% of the modifier in HCl at pH 2). As shown in Fig. 7, a linear response was obtained for the peak current and the DA concentration in the range from 0.1 to 47 μmol L−1 DA with a calibration equation of y = 178.4 + 4.9CDA (R2 = 0.9919). The limit of detection (LOD) of the method was 0.01 μmol L−1 DA by replicate measurements on the blank solution and the slope of the calibration curve.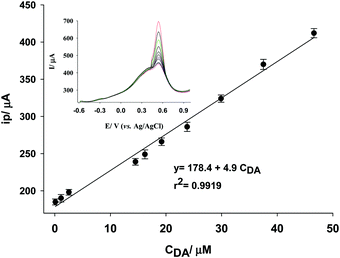 | ||
| Fig. 7 Typical calibration curve and corresponding SqW voltammograms for quantitative determination of DA by Fe(II)–CLN–CPE (HCl pH 2, 25% of the modifier). | ||
The electrode had a reasonable repeatability because the relative standard deviation within treatments was about 2.8% based on 10 replicate measurements. The responses of 3 independent electrodes with a similar composition were statistically evaluated (by ‘g-test’) for testing the deviations between treatments. The smaller experimental g-value of 0.48 than its critical value of g0.05,3,5 = 0.7885 confirms that the electrodes have a good reproducibility for DA determination. The long-term stability of the electrode was also tested during 3 months and the standard deviations of each class or determination (between 3 days for a week, weakly for 3 weeks, and monthly for 2 months) were statistically compared. The experimental g-value of 0.38 was smaller than its critical value of g0.05,3,7 = 0.5612, confirming that the electrode responses in this period have no significant difference.
The interference of some chemical species on the determination of DA by the proposed method was studied. The results are summarized in Table 3. The mentioned values were a ratio of the concentration of the interfering species to DA (0.26 mmol L−1), which caused a maximum 3% error in the voltammetric determination of DA by the proposed method. As shown in Table 3, ascorbic acid and uric acid exhibited no interference in the DA determination even when their concentration was 100 times greater than that of DA because the suggested condition by the model suppressed the interference effects of such compounds. Sucrose and tryptophan also have only a small interference with respect to uric and ascorbic acids.
| Species | C Interf./CDA |
|---|---|
| Sucrose | 200 |
| Tryptophan | 150 |
| Fructose | 100 |
| Ascorbic acid | 100 |
| Phenylalanine | 50 |
| Uric acid | 100 |
| Mg2+ | 750 |
| Ca2+ | 500 |
| Na+ | 1000 |
To study the applicability of the proposed electrode for the DA determination in the real samples, some human serums were used for the recovery experiment. As shown in Table 4, reasonable results were obtained, confirming that the response of the electrode in the DA determination was relatively free from the matrix effects.
| Serums samples | C DA (μmol L−1) | Recovery (%) | |
|---|---|---|---|
| Added | Founded | ||
| 1 | 0 | 31.6 ± 0.3 | — |
| 5.0 | 36.7 ± 0.4 | 102 | |
| 10.0 | 41.8 ± 0.3 | 102 | |
| 20.0 | 52.8 ± 0.4 | 106 | |
| 2 | 0 | 20.2 ± 0.3 | — |
| 5.0 | 25.3 ± 0.2 | 102 | |
| 10.0 | 29.9 ± 0.3 | 97 | |
| 20.0 | 41.1 ± 0.4 | 104.5 | |
| 3 | 0 | 3.5 ± 0.05 | — |
| 5.0 | 8.7 ± 0.06 | 104 | |
| 10.0 | 13.4 ± 0.07 | 99 | |
| 20.0 | 23.4 ± 0.08 | 99.5 | |
The characteristics of the proposed Fe(II)–CLN–CPE electrode were compared with some previously published works in the DA determination and the results are summarized in Table 5.19–28 It can be noted that the proposed electrode is comparable with those fabricated in other studies, but this electrode had the advantages of ease of preparation and cost-effectiveness (Table 5).
| Electrode | Linear range (μM) | DL (μM) | Ref. |
|---|---|---|---|
| rGO–poly(Cu-AMT)/GCE | 0.01–40 | 0.003 | 21 |
| MIPETD/GCE | 0.02–0.1 | 0.004 | 22 |
| GNPs/MWCNTs | 0.48–5.7 | 0.07 | 23 |
| NiFe2O4–MWCNT/GCE | 0.05–100 | 0.02 | 24 |
| Pd@Au/N,S-MGA-5 | 0.01–40 | 0.003 | 25 |
| AuNPS–PTAP/GCE | 0.15–1.5 | 0.017 | 26 |
| RGO–TiN/GCE | 1.0–80 | 0.012 | 27 |
| N-G/NiTsPc/GCE | 0.1–200 | 0.1 | 28 |
| Au/Gr–AuAg | 0.3–300 | 0.2 | 29 |
| Au/NPSS | 3.0–2000 | 0.07 | 30 |
| Fe(II)–NClin–CPE | 0.1–47 | 0.01 | This work |
4. Conclusions
Based on the experimental results, it can be concluded that clinoptilolite retained its ion exchange property when it was fully combined into a carbon paste matrix. Hence, the exited Fe(II) cations from the zeolite channels can be transferred to the surface of the modified Fe(II)–CLN–CPE electrode via the ion exchange process with the protons from HCl as a supporting electrolyte and participate in a redox process. This electrode showed an electrocatalytic effect in the presence of DA. The pH of the supporting electrolyte had the most important influence on the electrode response because it affected the ion exchange extent and hence the amount of Fe(II) as the electroactive species at the electrode surface. In addition, the acidic pHs prevent the hydrolysis of Fe(II) at the electrode surface and affect its voltammetric response.Conflicts of interest
There are no conflicts to declare.References
- Y. Chih and M. Yang, J. Taiwan Inst. Chem. Eng., 2014, 45, 33–839 CrossRef.
- J. Moncrieff, The myth of the chemical cure, A critique of psychiatric drug treatment. Palgrave MacMillan, Basingstoke, UK, 2008, ISBN 0-230-57432-7 Search PubMed.
- M. Rohani Moghadam, Sh. Dadfarnia, A. M. Haji Shabani and P. Shahbazikhah, Anal. Biochem., 2011, 410, 289–295 CrossRef CAS PubMed.
- T. Thomas, Ronald J. Mascarenhas and B. E. Kumara Swamy, J. Mol. Liq., 2012, 174, 70–75 CrossRef CAS.
- Y. Wang, S. Hamid, X. Zhang, N. Akhtar, X. Zhang and T. He, New J. Chem., 2017, 41, 1591–1597 RSC.
- Y. Wang, S. Hamid, X. Zhang, N. Akhtar, X. Zhang and T. He, New J. Chem., 2017, 41, 1591–1597 RSC.
- B. Kaur, B. Satpati and R. Srivastava, New J. Chem., 2015, 39, 1115–1124 RSC.
- P. Gao, H. Ma, J. Yang, D. Wu, Y. Zhang, B. Du, D. Fan and Q. Wei, New J. Chem., 2015, 39, 1483–1487 RSC.
- B. Kaur, B. Satpati and R. Srivastava, New J. Chem., 2015, 39, 1115–1124 RSC.
- K. Koyama and Y. Takeuchi, Z. Kristallogr., 1977, 145, 216–239 CAS.
- M. Bordbar, Seyed M. Vasegh, S. Jafari and A. YeganehFaal, Iran. J. Catal., 2015, 5, 135–141 Search PubMed.
- B. Kaur, R. Srivastava and B. Satpati, New J. Chem., 2015, 39, 5137–5149 RSC.
- Michael J. Stephenson, Martin P. Attfield, Stuart M. Holmes and Robert A. W. Dryfe, J. Solid State Electrochem., 2015, 19, 1985–1992 CrossRef CAS.
- S. Kavian, Seyed N. Azizi and Sh. Ghasemi, J. Mol. Liq., 2016, 218, 663–669 CrossRef CAS.
- M. W. Munthali, M. A. Elsheikh, E. Johan and N. Matsue, Molecules, 2014, 19, 20468–20481 CrossRef PubMed.
- E. Laviron, J. Electroanal. Chem., 1979, 101, 19–28 CrossRef CAS.
- A. Nozad Golikand, S. M. Golabi, M. Ghannadi Maragheh, L. Irannejad and M. Asgaria, J. Iran. Chem. Soc., 2077, 4, 304–309 CrossRef.
- M. H. Sheikh-Mohseni and A. Nezamzadeh-Ejhieh, Electrochim. Acta, 2014, 147, 572–581 CrossRef CAS.
- Z. Pourghobadi and D. Neamatollahi, J. Serb. Chem. Soc., 2017, 82(9), 1053–1061 CrossRef.
- C. A. Martínez-Huitle, M. Cerro-Lopez and M. A. Quiroz, Mater. Res., 2009, 12, 375–384 CrossRef.
- Y. Li, Y. Gu, B. Zheng, L. Luo, C. Li, X. Yan, T. Zhang, N. Lu and Z. Zhang, Talanta, 2017, 162, 80–89 CrossRef PubMed.
- L. Kiss, V. David, I. G. David, P. Lazăr, C. Mihailciuc, I. Stamatin, A. Ciobanu, C. D. Ştefănescu, L. Nagy, G. Nagy and A. A. Ciucu, Talanta, 2016, 160, 489–498 CrossRef CAS PubMed.
- F. R. Caetanoa, L. B. Felippea, A. J. G. Zarbinb, M. F. Bergamini and L. H. Marcolino-Junior, Sens. Actuators, B, 2017, 243, 43–50 CrossRef.
- A. A. Ensafi, B. Arashpour, B. Rezaei and A. R. Allafchian, Mater. Sci. Eng., C, 2014, 39, 78–85 CrossRef CAS PubMed.
- R. Li, T. Yang, Z. Li, Z. Gu, G. Wang and J. Liu, Anal. Chim. Acta, 2017, 954, 1–9 CrossRef PubMed.
- E. A. Khudaish, F. Al-Nofli, J. A. Rather, M. Al-Hinaai, K. Laxman, H. H. Kyaw and S. Al-Harthy, J. Electroanal. Chem., 2016, 761, 80–88 CrossRef CAS.
- Y. Haldorai, A. T. Ezhil Vilian, M. Rethinasabapathy, Y. S. Huh and Y.-K. Han, Sens. Actuators, B, 2017, 247, 61–69 CrossRef CAS.
- H. Xu, J. Xiao, L. Yan, L. Zhu and B. Liu, J. Electroanal. Chem., 2016, 779, 92–98 CrossRef CAS.
- S. Pruneanu, A. R. Biris, F. Pogacean, C. Socaci, M. Coros, M. C. Rosu, F. Watanabe and A. S. Biris, Electrochim. Acta, 2015, 154, 197–204 CrossRef CAS.
- B. Rezaei, E. Havakeshian and A. A. Ensaf, Sens. Actuators, B, 2015, 213, 484–492 CrossRef CAS.
Footnote |
| † Electronic supplementary information (ESI) available. See DOI: 10.1039/c7nj03579a |
| This journal is © The Royal Society of Chemistry and the Centre National de la Recherche Scientifique 2018 |

