Luminescence and energy transfer in β-NaGdF4:Eu3+,Er3+ nanocrystalline samples from a room temperature synthesis†
Gabriella
Tessitore
 *a,
Anja-Verena
Mudring
 b and
Karl W.
Krämer
 a
a
aUniversity of Bern, Department of Chemistry and Biochemistry, Freiestrasse 3, 3012 Bern, Switzerland. E-mail: Gabriella.Tessitore@dcb.unibe.ch
bDepartment of Materials and Environmental Chemistry, Stockholm University, Svante Arrhenius väg 16 C, 106 91 Stockholm, Sweden
First published on 21st November 2017
Abstract
Phase pure hexagonal β-NaGdF4:Eu3+,Er3+ samples of less than 10 nm in crystallite size were synthesized in anhydrous ethylene glycol within 24 hours at room temperature. The materials were characterized by powder X-ray diffraction, electron microscopy, and luminescence spectroscopy. After Gd3+ excitation at 273 nm Eu3+ luminescence from the 5DJ states dominates over Gd3+ 6PJ emission and only weak Er3+ emissions could be observed due to strong Gd→Eu and weak Gd→Er energy transfer. Excitation at 377 nm results in Er3+ 2H9/2 and Eu3+ 5DJ emissions. The concentration dependence of the Er3+ and Eu3+ luminescence intensities points to independent behavior of the dopant ions without Er→Eu or Eu→Er energy transfer. Eu3+ excitation at 394 nm results in Eu3+ 5DJ emissions only and confirms the absence of Eu→Er energy transfer. Eu3+ luminescence from the 5DJ states prevails for all investigated excitations. The optimum Eu3+ doping level is close to 5%. Significant Er3+ luminescence was observed for 377 nm excitation only. The strong 2H9/2 and weak 4S3/2 Er3+ emissions indicate small losses by multiphonon relaxation and a good quality of the nanomaterial. Er co-doping hinders the energy migration on the Gd3+ and Eu3+ sublattices which results in higher Gd3+/Eu3+ and Eu3+ 5D1/5D0 emission ratios.
1. Introduction
Hexagonal β-NaREF4 (RE3+ = rare earth) is an excellent host lattice for luminescent materials.1–6 The rare earth ions occupy two sites with nine-fold coordination, one of them half occupied by Na+.7 The absence of an inversion centre on the rare earth sites and the microscopic disorder give rise to line broadening and an enhanced spectroscopic overlap. The high coordination number of nine results in long RE–F distances and a low effective phonon energy which decreases the multiphonon relaxation in this lattice.Synthesis of phase pure β-NaREF4 nanomaterials is challenging. At high temperatures, β-NaREF4 crystallizes from solutions in a two-step process according to the Ostwald phase rule.8 First, metastable cubic α-NaREF4 is formed which may transform to the thermodynamically stable β-NaREF4 or persist as a metastable, kinetically stabilized phase. Luminescence from α-NaREF4 is significantly weaker than from β-NaREF4.9 The thermodynamic stability of β-NaREF4 decreases for smaller RE3+ ionic radii.10 Thus, the synthesis of highly luminescent material requires an accurate optimization in order to obtain phase pure β-NaREF4.
Several synthetic pathways are reported in the literature which show a high selectivity for the β-NaREF4 phase and a good size control of the nanoparticles.11–14 Most commonly, octadecene is used as a solvent with oleic acid or oleylamine as surfactants and the synthesis is performed at high temperatures. Recently, room temperature syntheses of fluoride nanoparticles were investigated.15–19 They provide several advantages since they can be performed in conventional solvents, e.g. water, ethylene glycol, or diethylene glycol, and require no heating. Several room temperature syntheses for phase pure β-NaREF4 nanoparticles were reported.15,16,19 However, the obtained particle size distribution is often broad due to a weak size control. With the help of surfactants it is possible to improve the size control. Ionic liquids were successfully employed in the room temperature synthesis of β-NaGdF4:Eu3+ nanoparticles with 2 nm crystallite size in aqueous solutions.16 A small crystallite size was recently achieved for the synthesis of β-NaGdF4:Eu3+ and Er3+ nanocrystalline samples in ethylene glycol19 and KGdF4:Ce3+,Ln3+ (Ln = Tb or Eu) nanoparticles in water and diethylene glycol solutions.18 The nanocrystallites obtained from both syntheses form aggregates smaller than 100 nm. The crystallite size is less than 10 nm without addition of further surfactants, e.g. ionic liquids. It was observed that the F− concentration from NH4F in the ethylene glycol synthesis affects the aggregate size.19 Here, we extend the room temperature synthesis in ethylene glycol,19 developed by us towards β-NaGdF4:Eu3+,Er3+ co-doped nanoparticles. The absence of water during the synthesis constitutes a distinct advantage for the synthesis of luminescence materials. It minimizes OH− impurities and the luminescence quenching resulting thereof. A synthesis under dry conditions is also beneficial for a good repeatability of the results, as suggested by comparison with the literature.19
Phosphor materials with Gd3+, Eu3+, and Er3+ are interesting in several aspects. LiGdF4:Eu3+![[thin space (1/6-em)]](https://www.rsc.org/images/entities/char_2009.gif) 20 and LiGdF4:Er3+
20 and LiGdF4:Er3+![[thin space (1/6-em)]](https://www.rsc.org/images/entities/char_2009.gif) 21 are quantum cutters. For Gd3+ or Er3+ excitation, one high energy photon in the VUV can be converted in two lower energy photons. Also, β-NaGdF4:Eu3+ shows quantum cutting.16,22,23 However, the excitation energy of 6.1 eV is too low for Xe (7.3 eV) and too high for Hg discharge lamps (4.9 eV) which limits potential applications.24 For LiGdF4:Er3+ the dense energy level diagram of Er3+, the efficient energy migration between Gd3+ ions, and the weak absorption of the Gd3+ 6PJ→8S7/2 emission by Er3+ ions reduces the quantum cutting efficiency.21,25 Ternary systems (with respect to the rare earth ion) may enhance the energy transfer from Gd3+ ions. The best known nanomaterial is α-NaGdF4:1.5% Er3+,0.3% Tb3+.26 LiGdF4:Er3+,Tb3+ might be feasible as phosphor for Xe discharge lamps.24
21 are quantum cutters. For Gd3+ or Er3+ excitation, one high energy photon in the VUV can be converted in two lower energy photons. Also, β-NaGdF4:Eu3+ shows quantum cutting.16,22,23 However, the excitation energy of 6.1 eV is too low for Xe (7.3 eV) and too high for Hg discharge lamps (4.9 eV) which limits potential applications.24 For LiGdF4:Er3+ the dense energy level diagram of Er3+, the efficient energy migration between Gd3+ ions, and the weak absorption of the Gd3+ 6PJ→8S7/2 emission by Er3+ ions reduces the quantum cutting efficiency.21,25 Ternary systems (with respect to the rare earth ion) may enhance the energy transfer from Gd3+ ions. The best known nanomaterial is α-NaGdF4:1.5% Er3+,0.3% Tb3+.26 LiGdF4:Er3+,Tb3+ might be feasible as phosphor for Xe discharge lamps.24
The development of LEDs reduced the need for lamp phosphors.27–29 UV-A LEDs show efficient emission around 365 nm, which can excite white emission from Er3+, Eu3+ co-doped materials.30–32 Another pathway for white emission focuses on upconversion in Yb3+, Er3+, Eu3+ co-doped materials.33–38 Between 360–380 nm, Er3+ has a strong 4I15/2→4G11/2 absorption at 377 nm and a weaker 4I15/2→4G9/2 and 2KJ absorption at 364 nm,39 which may result in blue and green Er3+ emissions. In combination with red emission from the Eu3+ 5DJ states, white light may be obtained. β-NaGdF4:Eu3+,Er3+ co-doped nanoparticles can also be excited via Gd3+ at 273 nm. Here, we investigate the luminescence of β-NaGdF4:Eu3+,Er3+ co-doped nanoparticles upon UV excitation of Gd3+, Er3+, and Eu3+ ions.
2. Experimental
A room temperature synthesis of hexagonal β-NaGdF4 nanocrystallites in ethylene glycol was recently reported by the authors.19 This synthesis was modified and optimized for Eu3+ and Er3+ co-doped β-NaGdF4 nanocrystallites in the present work. The fluoride nanomaterials were prepared from rare earth acetates, NaCl, and NH4F in anhydrous ethylene glycol. Anhydrous rare earth acetates were synthesized from the respective rare earth oxides RE2O3 (Eu2O3, Gd2O3, Er2O3, Metall Rare Earth Limited, 5 N), see Experimental section with powder X-ray diffraction (XRD) patterns and thermogravimetric analyses in Fig. S1 and S2 of ESI,† respectively. The anhydrous acetates were stored in a dry nitrogen glovebox. Four different 1.1 M rare earth acetate mother solutions were prepared in anhydrous ethylene glycol (EG) (Sigma Aldrich, 99.8%) containing Gd3+, 1% or 5% of Eu3+ or Er3+, and NaCl (Merck, reagent grade), see Table S1 of ESI.† A 10.6 wt% solution of NH4F (Alfa Aesar, 96%) in EG was used as fluoride source. Two series of materials were prepared with Gd![[thin space (1/6-em)]](https://www.rsc.org/images/entities/char_2009.gif) :
:![[thin space (1/6-em)]](https://www.rsc.org/images/entities/char_2009.gif) Eu + Er molar ratios of 99
Eu + Er molar ratios of 99![[thin space (1/6-em)]](https://www.rsc.org/images/entities/char_2009.gif) :
:![[thin space (1/6-em)]](https://www.rsc.org/images/entities/char_2009.gif) 1 or 95
1 or 95![[thin space (1/6-em)]](https://www.rsc.org/images/entities/char_2009.gif) :
:![[thin space (1/6-em)]](https://www.rsc.org/images/entities/char_2009.gif) 5. The Eu
5. The Eu![[thin space (1/6-em)]](https://www.rsc.org/images/entities/char_2009.gif) :
:![[thin space (1/6-em)]](https://www.rsc.org/images/entities/char_2009.gif) Er molar ratios were 1
Er molar ratios were 1![[thin space (1/6-em)]](https://www.rsc.org/images/entities/char_2009.gif) :
:![[thin space (1/6-em)]](https://www.rsc.org/images/entities/char_2009.gif) 0, 0.8
0, 0.8![[thin space (1/6-em)]](https://www.rsc.org/images/entities/char_2009.gif) :
:![[thin space (1/6-em)]](https://www.rsc.org/images/entities/char_2009.gif) 0.2, 0.6
0.2, 0.6![[thin space (1/6-em)]](https://www.rsc.org/images/entities/char_2009.gif) :
:![[thin space (1/6-em)]](https://www.rsc.org/images/entities/char_2009.gif) 0.4, 0.4
0.4, 0.4![[thin space (1/6-em)]](https://www.rsc.org/images/entities/char_2009.gif) :
:![[thin space (1/6-em)]](https://www.rsc.org/images/entities/char_2009.gif) 0.6, 0.2
0.6, 0.2![[thin space (1/6-em)]](https://www.rsc.org/images/entities/char_2009.gif) :
:![[thin space (1/6-em)]](https://www.rsc.org/images/entities/char_2009.gif) 0.8, and 0
0.8, and 0![[thin space (1/6-em)]](https://www.rsc.org/images/entities/char_2009.gif) :
:![[thin space (1/6-em)]](https://www.rsc.org/images/entities/char_2009.gif) 1 for 1% doped samples or 5
1 for 1% doped samples or 5![[thin space (1/6-em)]](https://www.rsc.org/images/entities/char_2009.gif) :
:![[thin space (1/6-em)]](https://www.rsc.org/images/entities/char_2009.gif) 0, 4
0, 4![[thin space (1/6-em)]](https://www.rsc.org/images/entities/char_2009.gif) :
:![[thin space (1/6-em)]](https://www.rsc.org/images/entities/char_2009.gif) 1, 3
1, 3![[thin space (1/6-em)]](https://www.rsc.org/images/entities/char_2009.gif) :
:![[thin space (1/6-em)]](https://www.rsc.org/images/entities/char_2009.gif) 2, 2
2, 2![[thin space (1/6-em)]](https://www.rsc.org/images/entities/char_2009.gif) :
:![[thin space (1/6-em)]](https://www.rsc.org/images/entities/char_2009.gif) 3, 1
3, 1![[thin space (1/6-em)]](https://www.rsc.org/images/entities/char_2009.gif) :
:![[thin space (1/6-em)]](https://www.rsc.org/images/entities/char_2009.gif) 4, and 0
4, and 0![[thin space (1/6-em)]](https://www.rsc.org/images/entities/char_2009.gif) :
:![[thin space (1/6-em)]](https://www.rsc.org/images/entities/char_2009.gif) 5 for 5% doped samples. The Na
5 for 5% doped samples. The Na![[thin space (1/6-em)]](https://www.rsc.org/images/entities/char_2009.gif) :
:![[thin space (1/6-em)]](https://www.rsc.org/images/entities/char_2009.gif) RE molar ratio of the reaction mixture was 2
RE molar ratio of the reaction mixture was 2![[thin space (1/6-em)]](https://www.rsc.org/images/entities/char_2009.gif) :
:![[thin space (1/6-em)]](https://www.rsc.org/images/entities/char_2009.gif) 1 for all samples. The reaction solutions were prepared from the mother solutions as indicated in Table S1 (ESI†). In a typical reaction, 0.5 mL of rare earth acetate solution was mixed with 2.5 mL of NH4F solution under stirring for 24 hours in a nitrogen atmosphere. This corresponds to a 12-fold molar excess of fluoride and a 9 wt% NH4F in the total 3 mL EG. The nanoparticles were separated by centrifugation at 3000 rpm for 5 minutes. The product was washed three times with technical grade methanol and ethanol. After each washing step the nanoparticles were collected by centrifugation. Finally, the product was dried under vacuum.
1 for all samples. The reaction solutions were prepared from the mother solutions as indicated in Table S1 (ESI†). In a typical reaction, 0.5 mL of rare earth acetate solution was mixed with 2.5 mL of NH4F solution under stirring for 24 hours in a nitrogen atmosphere. This corresponds to a 12-fold molar excess of fluoride and a 9 wt% NH4F in the total 3 mL EG. The nanoparticles were separated by centrifugation at 3000 rpm for 5 minutes. The product was washed three times with technical grade methanol and ethanol. After each washing step the nanoparticles were collected by centrifugation. Finally, the product was dried under vacuum.
Samples were characterized by powder XRD and transmission electron microscopy (TEM) with respect to phase purity and size, respectively. Luminescence and excitation spectra were measured from the powder samples, see Experimental section of ESI.†
3. Results and discussion
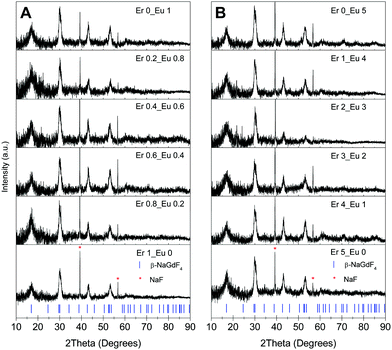
Nanocrystalline hexagonal β-NaGdF4:x% Eu3+,y% Er3+ samples were obtained in high phase purity at room temperature, as it is demonstrated by the XRD patterns in Fig. 1 for various Eu3+ and Er3+ concentrations. The calculated β-NaGdF4 peak positions are reported at the bottom of Fig. 1 as blue ticks. The diffraction peaks are indexed by the hexagonal β-NaGdF4 phase crystallizing with space group P![[6 with combining macron]](https://www.rsc.org/images/entities/char_0036_0304.gif) . The refined lattice parameters are a = 6.0304(9) Å and c = 3.6111(7).7 Two sharp impurity lines at diffraction angles of 38.8° and 56.1° are readily assigned to the (200) and (220) reflections of NaF40 and marked by red asterisks in Fig. 1. The absence of the strongest (111) diffraction peak of the cubic α-NaGdF4 phase at 28.1° confirms the absence of the cubic NaGdF4 polymorph in all samples. The spectroscopic response is not altered by the NaF impurity, which only dilutes the samples. On the contrary, repeated washings or the use of water for a complete NaF removal can influence the sample purity and quench a large share of the luminescence.
. The refined lattice parameters are a = 6.0304(9) Å and c = 3.6111(7).7 Two sharp impurity lines at diffraction angles of 38.8° and 56.1° are readily assigned to the (200) and (220) reflections of NaF40 and marked by red asterisks in Fig. 1. The absence of the strongest (111) diffraction peak of the cubic α-NaGdF4 phase at 28.1° confirms the absence of the cubic NaGdF4 polymorph in all samples. The spectroscopic response is not altered by the NaF impurity, which only dilutes the samples. On the contrary, repeated washings or the use of water for a complete NaF removal can influence the sample purity and quench a large share of the luminescence.
The broad width of the XRD peaks indicates the nanometer particle size of the materials. From the line width the crystallite size of the β-NaGdF4:Eu3+,Er3+ samples was estimated by the Scherrer equation:
 | (1) |
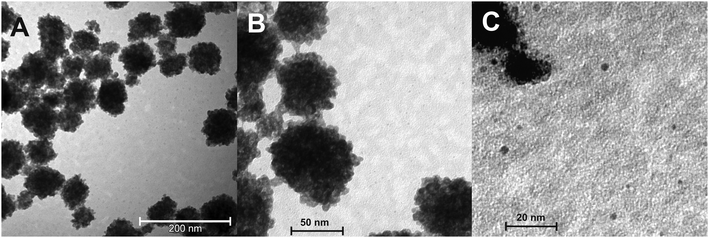
TEM micrographs provide more details on the nanocrystal size and shape. Fig. 2 shows an overview on the particle size of β-NaGdF4:5% Eu3+. Fig. S3 of ESI† depicts TEM micrographs of further representative samples. As proven by XRD, the crystallite size is below 10 nm, see Fig. 2C. The nanocrystals form larger aggregates upon drying. Their size ranges between 50 and 100 nm, see Fig. 2. The aggregate size increases with the NH4F concentration from 3 to 9 wt% in the EG solutions.19 The optimum concentration of 9 wt% NH4F for a pure hexagonal phase and improved luminescence19 was used in this work for all samples.
Individual nanocrystals of 2–3 nm size are shown in Fig. 2C. The dopant concentration has no detectable influence on the crystallite size. When up to 5% Eu3+ ions substitute for Gd3+, only a negligible influence on the stability of the hexagonal phase is expected as their ionic radii are very close (1.120 Å and 1.107 Å, respectively, for a nine-fold coordination).41 The smaller Er3+ ions (1.062 Å)41 can induce a variation in crystallite size and shape due to the decreasing stability of the hexagonal phase along the trivalent rare earth cation series. However, within error limits, no change in crystallite size was detectable from the TEM micrographs of the β-NaGdF4:Eu3+,Er3+ nanocrystallites. Comparable aggregates of particles were observed in the room temperature synthesis of KGdF4:Ce3+/Ln3+ in water with diethylene glycol as co-solvent.18
3.1. β-NaGdF4:Eu3+ and β-NaGdF4:Er3+ nanocrystallites
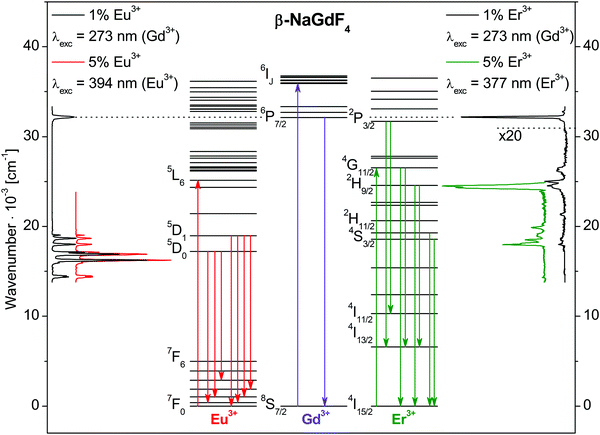
Emission spectra of β-NaGdF4:Eu3+ and β-NaGdF4:Er3+ nanocrystallites are shown in Fig. 3 together with the energy level diagrams of Eu3+, Gd3+, and Er3+. Excitation and emission transitions are indicated by arrows in the diagrams. All observed bands are assigned to 4f–4f intraconfigurational transitions of the respective rare earth ion. The spectra were collected for dopant concentrations of 1% and 5%.After Gd3+ 8S7/2→6IJ excitation at 36![[thin space (1/6-em)]](https://www.rsc.org/images/entities/char_2009.gif) 630 cm−1 (273 nm), β-NaGdF4:1% Eu3+ shows the typical Eu3+ emission bands due to the 5DJ→7FJ transitions between 14
630 cm−1 (273 nm), β-NaGdF4:1% Eu3+ shows the typical Eu3+ emission bands due to the 5DJ→7FJ transitions between 14![[thin space (1/6-em)]](https://www.rsc.org/images/entities/char_2009.gif) 000 and 19
000 and 19![[thin space (1/6-em)]](https://www.rsc.org/images/entities/char_2009.gif) 000 cm−1. The intensity of the Gd3+ 6P7/2→8S7/2 emission band at 32
000 cm−1. The intensity of the Gd3+ 6P7/2→8S7/2 emission band at 32![[thin space (1/6-em)]](https://www.rsc.org/images/entities/char_2009.gif) 260 cm−1 (310 nm) is weak due to an efficient Gd3+→Eu3+ energy transfer.
260 cm−1 (310 nm) is weak due to an efficient Gd3+→Eu3+ energy transfer.
For direct Eu3+ 7F0→5L6 excitation at 25![[thin space (1/6-em)]](https://www.rsc.org/images/entities/char_2009.gif) 380 cm−1 (394 nm), β-NaGdF4:5% Eu3+ shows identical Eu3+ emissions as for Gd3+ excitation, see the traces on the left hand side of Fig. 3. The Eu3+ 5D0→7F2 emission at 16
380 cm−1 (394 nm), β-NaGdF4:5% Eu3+ shows identical Eu3+ emissions as for Gd3+ excitation, see the traces on the left hand side of Fig. 3. The Eu3+ 5D0→7F2 emission at 16![[thin space (1/6-em)]](https://www.rsc.org/images/entities/char_2009.gif) 260 cm−1 (615 nm) has the strongest intensity. Emissions are detected from the 5D0 and 5D1 states. Most prominent are the 5D0→7FJ transitions with J = 1 and 4 at 16
260 cm−1 (615 nm) has the strongest intensity. Emissions are detected from the 5D0 and 5D1 states. Most prominent are the 5D0→7FJ transitions with J = 1 and 4 at 16![[thin space (1/6-em)]](https://www.rsc.org/images/entities/char_2009.gif) 920 cm−1 (591 nm) and 14
920 cm−1 (591 nm) and 14![[thin space (1/6-em)]](https://www.rsc.org/images/entities/char_2009.gif) 368 cm−1 (696 nm), respectively. Significantly less intensity is observed for the 5D1→7FJ transitions. They will be addressed in more detail in the following sections. The emission spectra are comparable to those reported in the literature for β-NaGdF4:Eu3+ nanoparticles9,16,22,42,43 and bulk material.6,23
368 cm−1 (696 nm), respectively. Significantly less intensity is observed for the 5D1→7FJ transitions. They will be addressed in more detail in the following sections. The emission spectra are comparable to those reported in the literature for β-NaGdF4:Eu3+ nanoparticles9,16,22,42,43 and bulk material.6,23
For Gd3+ excitation at 273 nm, β-NaGdF4:1% Er3+ shows predominantly Gd3+ 6P7/2→8S7/2 emission at 32![[thin space (1/6-em)]](https://www.rsc.org/images/entities/char_2009.gif) 260 cm−1 (310 nm) and minor Er3+ emissions, see the right hand side of Fig. 3. The Gd3+→Er3+ energy transfer is less efficient than for Gd3+→Eu3+, in good agreement with reports in literature.20,21 The Er3+ emissions range from 17
260 cm−1 (310 nm) and minor Er3+ emissions, see the right hand side of Fig. 3. The Gd3+→Er3+ energy transfer is less efficient than for Gd3+→Eu3+, in good agreement with reports in literature.20,21 The Er3+ emissions range from 17![[thin space (1/6-em)]](https://www.rsc.org/images/entities/char_2009.gif) 500 to 26
500 to 26![[thin space (1/6-em)]](https://www.rsc.org/images/entities/char_2009.gif) 500 cm−1. Er3+ 2P3/2→4I13/2 and 2P3/2→4I11/2 emissions are observed at 25
500 cm−1. Er3+ 2P3/2→4I13/2 and 2P3/2→4I11/2 emissions are observed at 25![[thin space (1/6-em)]](https://www.rsc.org/images/entities/char_2009.gif) 063 cm−1 (399 nm) and 21
063 cm−1 (399 nm) and 21![[thin space (1/6-em)]](https://www.rsc.org/images/entities/char_2009.gif) 368 cm−1 (468 nm), respectively. The Er3+ 2P3/2→4I15/2 transition is visible only as a shoulder of the Gd3+ 6P7/2→8S7/2 band. The band at 24
368 cm−1 (468 nm), respectively. The Er3+ 2P3/2→4I15/2 transition is visible only as a shoulder of the Gd3+ 6P7/2→8S7/2 band. The band at 24![[thin space (1/6-em)]](https://www.rsc.org/images/entities/char_2009.gif) 510 cm−1 (408 nm) is assigned to the 2H9/2→4I15/2 transition, while only minor emissions from the 2H11/2 and 4S3/2 states are recorded at 18
510 cm−1 (408 nm) is assigned to the 2H9/2→4I15/2 transition, while only minor emissions from the 2H11/2 and 4S3/2 states are recorded at 18![[thin space (1/6-em)]](https://www.rsc.org/images/entities/char_2009.gif) 349 cm−1 (545 nm) and 19
349 cm−1 (545 nm) and 19![[thin space (1/6-em)]](https://www.rsc.org/images/entities/char_2009.gif) 011 cm−1 (526 nm), respectively. A direct Er3+ excitation of β-NaGdF4:5% Er3+ into the 4G11/2 state at 26
011 cm−1 (526 nm), respectively. A direct Er3+ excitation of β-NaGdF4:5% Er3+ into the 4G11/2 state at 26![[thin space (1/6-em)]](https://www.rsc.org/images/entities/char_2009.gif) 525 cm−1 (377 nm) results in stronger Er3+ emissions, see the green trace on the right hand side of Fig. 3. The 2H9/2→4I15/2 and 2H9/2→4I13/2 transitions show the highest intensities at 24
525 cm−1 (377 nm) results in stronger Er3+ emissions, see the green trace on the right hand side of Fig. 3. The 2H9/2→4I15/2 and 2H9/2→4I13/2 transitions show the highest intensities at 24![[thin space (1/6-em)]](https://www.rsc.org/images/entities/char_2009.gif) 510 cm−1 (408 nm) and 17
510 cm−1 (408 nm) and 17![[thin space (1/6-em)]](https://www.rsc.org/images/entities/char_2009.gif) 986 cm−1 (556 nm), respectively. Also the green emissions 2H11/2 and 4S3/2→4I15/2 increase in intensity. For comparison, emission spectra of bulk β-NaGdF4:5% Er3+ with micrometer particle size are shown in Fig. S4 of ESI† for Gd3+ and Er3+ excitation, as well as normalized luminescence spectra of bulk β-NaGdF4 with 1% and 5% Er3+ in Fig. S5 (ESI†).
986 cm−1 (556 nm), respectively. Also the green emissions 2H11/2 and 4S3/2→4I15/2 increase in intensity. For comparison, emission spectra of bulk β-NaGdF4:5% Er3+ with micrometer particle size are shown in Fig. S4 of ESI† for Gd3+ and Er3+ excitation, as well as normalized luminescence spectra of bulk β-NaGdF4 with 1% and 5% Er3+ in Fig. S5 (ESI†).
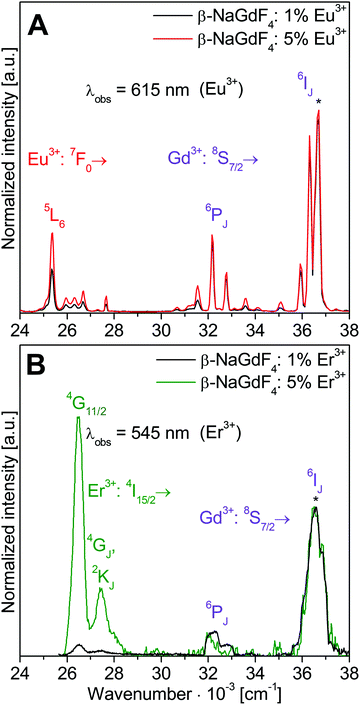
Fig. 4 shows excitation spectra of nanocrystalline β-NaGdF4:Eu3+ and Er3+ samples with 1% and 5% doping monitoring the Eu3+ and Er3+ emissions, respectively. Spectra are normalized to the Gd3+ 8S7/2→6IJ transition at 36![[thin space (1/6-em)]](https://www.rsc.org/images/entities/char_2009.gif) 630 cm−1 (273 nm). Absorption and emission via Eu3+ and Er3+ dopant bands increase with the doping level and allow a clear distinction from Gd3+ bands. In Fig. 4A the Eu3+ 5D0→7F2 emission at 16
630 cm−1 (273 nm). Absorption and emission via Eu3+ and Er3+ dopant bands increase with the doping level and allow a clear distinction from Gd3+ bands. In Fig. 4A the Eu3+ 5D0→7F2 emission at 16![[thin space (1/6-em)]](https://www.rsc.org/images/entities/char_2009.gif) 260 cm−1 (615 nm) is monitored. Bands are assigned to direct Eu3+ as well as Gd3+ excitations followed by Gd3+→Eu3+ energy transfer. Eu3+ excitation bands range from 24
260 cm−1 (615 nm) is monitored. Bands are assigned to direct Eu3+ as well as Gd3+ excitations followed by Gd3+→Eu3+ energy transfer. Eu3+ excitation bands range from 24![[thin space (1/6-em)]](https://www.rsc.org/images/entities/char_2009.gif) 500 to 28
500 to 28![[thin space (1/6-em)]](https://www.rsc.org/images/entities/char_2009.gif) 000 cm−1 and 30
000 cm−1 and 30![[thin space (1/6-em)]](https://www.rsc.org/images/entities/char_2009.gif) 000 to 35
000 to 35![[thin space (1/6-em)]](https://www.rsc.org/images/entities/char_2009.gif) 500 cm−1. The intensity of the Eu3+ emission roughly doubles when the doping is increased from 1% to 5% Eu3+, in good agreement with an enhanced absorption according to the Lambert–Beer law. The prominent Eu3+ 7F0→5L6 excitation is observed at 25
500 cm−1. The intensity of the Eu3+ emission roughly doubles when the doping is increased from 1% to 5% Eu3+, in good agreement with an enhanced absorption according to the Lambert–Beer law. The prominent Eu3+ 7F0→5L6 excitation is observed at 25![[thin space (1/6-em)]](https://www.rsc.org/images/entities/char_2009.gif) 380 cm−1 (394 nm). The strongest excitation band at 36
380 cm−1 (394 nm). The strongest excitation band at 36![[thin space (1/6-em)]](https://www.rsc.org/images/entities/char_2009.gif) 630 cm−1 (273 nm) is attributed to the Gd3+ 8S7/2→6IJ transition. Weaker Gd3+ excitations are due to 8S7/2→6PJ transitions at 32
630 cm−1 (273 nm) is attributed to the Gd3+ 8S7/2→6IJ transition. Weaker Gd3+ excitations are due to 8S7/2→6PJ transitions at 32![[thin space (1/6-em)]](https://www.rsc.org/images/entities/char_2009.gif) 468 cm−1 (308 nm) and 32
468 cm−1 (308 nm) and 32![[thin space (1/6-em)]](https://www.rsc.org/images/entities/char_2009.gif) 787 cm−1 (305 nm), reflecting the lower absorption coefficients of 6PJ compared to 6IJ states.39
787 cm−1 (305 nm), reflecting the lower absorption coefficients of 6PJ compared to 6IJ states.39
Normalized excitation spectra of the Er3+ 4S3/2→4I15/2 emission at 18![[thin space (1/6-em)]](https://www.rsc.org/images/entities/char_2009.gif) 349 cm−1 (545 nm) in β-NaGdF4 doped with 1 and 5% Er3+ are depicted in Fig. 4B. The low intensity of the Er3+ emission required a wider slit width which reduces the resolution of these spectra and results in broader peak width compared to Fig. 4A. The Er3+ excitation bands range from 26
349 cm−1 (545 nm) in β-NaGdF4 doped with 1 and 5% Er3+ are depicted in Fig. 4B. The low intensity of the Er3+ emission required a wider slit width which reduces the resolution of these spectra and results in broader peak width compared to Fig. 4A. The Er3+ excitation bands range from 26![[thin space (1/6-em)]](https://www.rsc.org/images/entities/char_2009.gif) 000 to 28
000 to 28![[thin space (1/6-em)]](https://www.rsc.org/images/entities/char_2009.gif) 000 cm−1. Further bands at higher energy were too weak to be detected. The two Er3+ excitations at 26
000 cm−1. Further bands at higher energy were too weak to be detected. The two Er3+ excitations at 26![[thin space (1/6-em)]](https://www.rsc.org/images/entities/char_2009.gif) 525 cm−1 (377 nm) and 27
525 cm−1 (377 nm) and 27![[thin space (1/6-em)]](https://www.rsc.org/images/entities/char_2009.gif) 473 cm−1 (364 nm) originate from 4I15/2→4GJ and 2KJ transitions with 4I15/2→4G11/2 being strongest. Increasing the doping from 1% to 5% Er3+ results in a distinct enhancement of the direct Er3+ excitations. The weaker emission from Er3+ compared to Eu3+ doped samples indicates smaller absorption coefficients, an increased non-radiative relaxation due to smaller energy gaps between the excited states of Er3+, and a less efficient energy transfer from Gd3+.
473 cm−1 (364 nm) originate from 4I15/2→4GJ and 2KJ transitions with 4I15/2→4G11/2 being strongest. Increasing the doping from 1% to 5% Er3+ results in a distinct enhancement of the direct Er3+ excitations. The weaker emission from Er3+ compared to Eu3+ doped samples indicates smaller absorption coefficients, an increased non-radiative relaxation due to smaller energy gaps between the excited states of Er3+, and a less efficient energy transfer from Gd3+.
3.2. β-NaGdF4:Eu3+,Er3+ co-doped nanoparticles
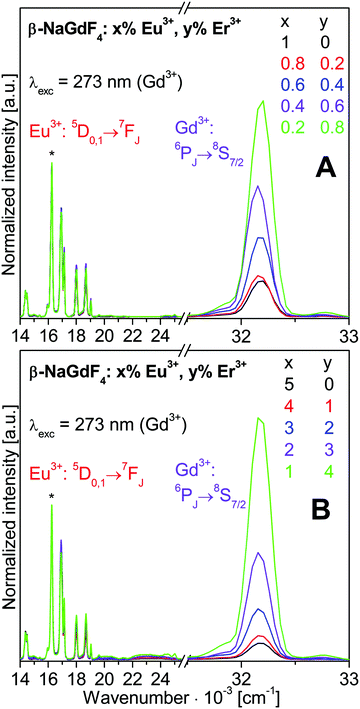
![[thin space (1/6-em)]](https://www.rsc.org/images/entities/char_2009.gif) 630 cm−1 (273 nm). The spectra are normalized to the strongest Eu3+ emission 5D0→7F2 at 16’260 cm−1 (615 nm). The Eu3+, Gd3+, and Er3+ emissions were already addressed in Section 3.1.
630 cm−1 (273 nm). The spectra are normalized to the strongest Eu3+ emission 5D0→7F2 at 16’260 cm−1 (615 nm). The Eu3+, Gd3+, and Er3+ emissions were already addressed in Section 3.1.
The intensity distribution among the Eu3+ emissions is close to identical for all the spectra shown in Fig. 5. Small variations of the 5D1vs.5D0 emission intensities are discussed in more detail with Fig. 6. Most obvious in Fig. 5 is a strong decrease of the Gd3+ emission intensity with increasing Eu3+ doping. The changes of the luminescence intensities with doping are resolved in Fig. 7.
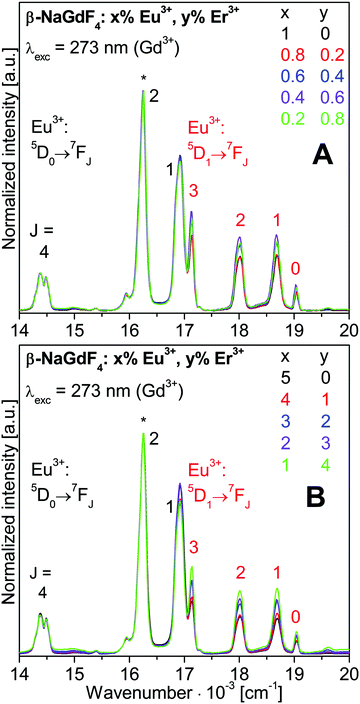 | ||
Fig. 6 Expanded Eu3+ luminescence spectra from Fig. 5. Spectra are normalized to the Eu3+ 5D0→7F2 emission at 615 nm (16![[thin space (1/6-em)]](https://www.rsc.org/images/entities/char_2009.gif) 260 cm−1), marked by an asterisk. 260 cm−1), marked by an asterisk. | ||
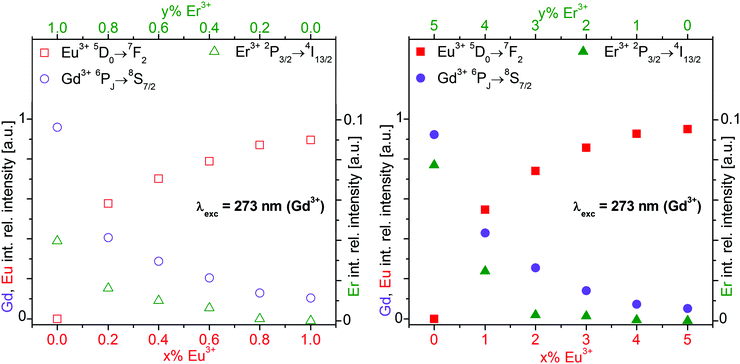 | ||
| Fig. 7 Integrated relative intensity of the Eu3+ 5D0→7F2 (red square), Gd3+ 6PJ→8S7/2 (purple circle), and Er3+ 2P3/2→4I13/2 (green triangle) luminescence of the β-NaGdF4:x% Eu3+,y% Er3+ nanocrystalline samples shown in Fig. 5. The empty (filled) symbols refer to 1% (5%) total doping with x% Eu3+ and y = 1 − x (y = 5 − x)% Er3+. Gd3+ was excited at 273 nm. | ||
The Eu3+ emissions from the 5D0 and 5D1 to the 7FJ states are labelled in Fig. 6. The 5D1→7FJ transitions with J = 0, 1, 2, and 3 are also clearly assigned. They correspond to the bands at 19![[thin space (1/6-em)]](https://www.rsc.org/images/entities/char_2009.gif) 011 cm−1 (526 nm), 18
011 cm−1 (526 nm), 18![[thin space (1/6-em)]](https://www.rsc.org/images/entities/char_2009.gif) 657 cm−1 (536 nm), 18
657 cm−1 (536 nm), 18![[thin space (1/6-em)]](https://www.rsc.org/images/entities/char_2009.gif) 018 cm−1 (555 nm), and 17
018 cm−1 (555 nm), and 17![[thin space (1/6-em)]](https://www.rsc.org/images/entities/char_2009.gif) 123 cm−1 (584 nm). Further weaker bands are the 5D0→7F0 and 5D0→7F3 transitions at 17
123 cm−1 (584 nm). Further weaker bands are the 5D0→7F0 and 5D0→7F3 transitions at 17![[thin space (1/6-em)]](https://www.rsc.org/images/entities/char_2009.gif) 270 cm−1 (579 nm) and 15
270 cm−1 (579 nm) and 15![[thin space (1/6-em)]](https://www.rsc.org/images/entities/char_2009.gif) 385 cm−1 (650 nm), respectively, and the 5D1→7F4 transition at 15
385 cm−1 (650 nm), respectively, and the 5D1→7F4 transition at 15![[thin space (1/6-em)]](https://www.rsc.org/images/entities/char_2009.gif) 950 cm−1 (627 nm). Much lower intensities show the 5D2→7FJ transitions with J = 0, 2, and 3 which correspond to bands at 21
950 cm−1 (627 nm). Much lower intensities show the 5D2→7FJ transitions with J = 0, 2, and 3 which correspond to bands at 21![[thin space (1/6-em)]](https://www.rsc.org/images/entities/char_2009.gif) 505 cm−1 (465 nm), 20
505 cm−1 (465 nm), 20![[thin space (1/6-em)]](https://www.rsc.org/images/entities/char_2009.gif) 492 cm−1 (488 nm), and 19
492 cm−1 (488 nm), and 19![[thin space (1/6-em)]](https://www.rsc.org/images/entities/char_2009.gif) 608 cm−1 (510 nm). The energy gap of 1
608 cm−1 (510 nm). The energy gap of 1![[thin space (1/6-em)]](https://www.rsc.org/images/entities/char_2009.gif) 740 cm−1 between the 5D1 and 5D0 states corresponds to 5 times the effective phonon energy of the β-NaGdF4 host lattice. This gives rise to a competition between radiative and non-radiative relaxation from the 5D1 state.
740 cm−1 between the 5D1 and 5D0 states corresponds to 5 times the effective phonon energy of the β-NaGdF4 host lattice. This gives rise to a competition between radiative and non-radiative relaxation from the 5D1 state.
Interestingly, the relative emission from the 5D1vs. the 5D0 state decreases with increasing Eu3+ doping, as previously observed for β-NaGdF4:Eu3+ samples.6,9,19 Higher Eu3+ concentrations enhance the energy migration between Eu3+ ions. Cross relaxation rates may increase between 5DJ and 7FJ states and reduce the population of higher 5DJ states in favour of 5D0. On the contrary, the co-doping with Er3+ ions increases the relative 5D1 emission. The Er3+ ions hinder the energy migration on the Eu3+ sublattice and retain a higher 5D1 population.
Normalized integrated intensities are reported in Fig. 7 for the Gd3+ 6PJ→8S7/2, Eu3+ 5D0→7F2, and Er3+ 2P3/2→4I13/2 emissions upon Gd3+ excitation at 273 nm. These transitions were chosen avoiding any overlap of emissions from different ions. The Gd3+ and Eu3+ intensities are displayed vs. the Eu3+ concentration on the bottom axis. Since the Er3+ emission is much weaker than the others, its intensity is displayed ten-fold expanded on the right hand axis vs. the Er3+ concentration on the top axis. The normalized integrated intensities in Fig. 7 were obtained from the luminescence spectra in Fig. S6 of ESI† which correspond to the normalized emission spectra in Fig. 5. The integrated intensities are displayed on a logarithmic scale in Fig. S7 of ESI.† According to the Lambert–Beer law, the absorbance A of a sample is proportional to the absorption coefficient ε, the concentration c, and the sample thickness d. In our standard luminescence setup, the excitation energy and d are fixed. The absorption coefficients ε of the rare earth ions are determined by the host lattice β-NaREF4. Therefore, the logarithm of the absorbed number of photons is proportional to the concentration of the respective ion. Ideally, the absorption results in the emission of a photon from the same ion. Any deviation indicates additional decay pathways such as energy transfer or multiphonon relaxation.
With increasing Eu3+ doping, the Gd3+ emission intensity (purple circle) is strongly reduced and the Eu3+ emission (red square) increases due to Gd3+→Eu3+ energy transfer, see Fig. 7. The Eu3+ emission increases up to 5% doping where it almost reaches a plateau. The optimum Eu3+ doping is expected in the vicinity of 5%. For 10% Eu3+ doping the emission intensity is already lower than for 5% due to concentration quenching.19 The total Gd3+ and Eu3+ emission is approximately constant, as shown in Fig. S7 (ESI†). Sample to sample variations of the total luminescence intensity due to experimental errors are strongly reduced in the normalized data of Fig. 7, which yields clear trends along the series. The Er3+ emission (green triangle) increases with Er3+ concentration, but it is much weaker than the Gd3+ and Eu3+ emissions. Both the Gd3+→Er3+ and Eu3+→Er3+ energy transfers are inefficient for 273 nm excitation. However, Er3+ co-doping has another important effect: the relative Gd3+vs. Eu3+ emission is higher in the presence of Er3+ than without. A comparison of the spectra in Fig. 5 reveals a much stronger relative Gd3+ emission for β-NaGdF4:1% Eu3+,4% Er3+ (Fig. 5B, green trace) than for β-NaGdF4:1% Eu3+ (Fig. 5A, black trace). In Fig. 7 the Gd3+/Eu3+ emission intensity ratios of these samples are about 45/55 and 10/90, respectively. Er3+ acts as a neutral scatterer, as discussed above for the Eu3+ 5D1vs.5D0 emission ratio. Co-doping reduces the energy migration on the Gd3+ and Eu3+ sublattices, decreases the Gd3+→Eu3+ energy transfer, and therefore retains the excitation energy on Gd3+. An optically inactive ion, such as Y3+, is likely to yield comparable results.
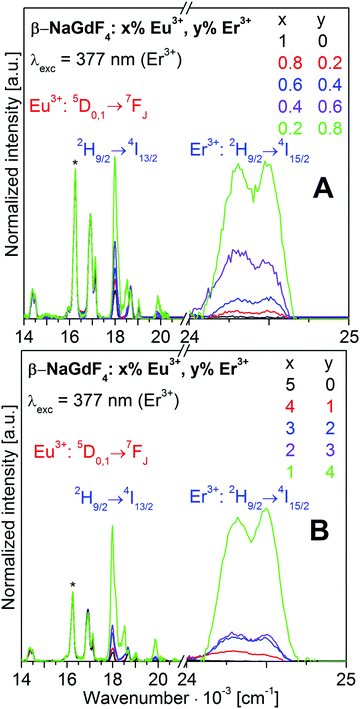
![[thin space (1/6-em)]](https://www.rsc.org/images/entities/char_2009.gif) 525 cm−1 (377 nm). The spectra are normalized to the Eu3+ 5D0→7F2 emission, marked by an asterisk. The corresponding luminescence spectra are shown in Fig. S8 of ESI.† In Fig. S9 (ESI†), the low energy part of Fig. 8 is expanded for a better separation of the Eu3+ and Er3+ emissions. Fig. 9 shows the integrated intensities of the Eu3+ 5D0→7F2 and Er3+ 2H9/2→4I15/2 emissions on a logarithmic scale. These intensities were obtained from Fig. S8 (ESI†).
525 cm−1 (377 nm). The spectra are normalized to the Eu3+ 5D0→7F2 emission, marked by an asterisk. The corresponding luminescence spectra are shown in Fig. S8 of ESI.† In Fig. S9 (ESI†), the low energy part of Fig. 8 is expanded for a better separation of the Eu3+ and Er3+ emissions. Fig. 9 shows the integrated intensities of the Eu3+ 5D0→7F2 and Er3+ 2H9/2→4I15/2 emissions on a logarithmic scale. These intensities were obtained from Fig. S8 (ESI†).
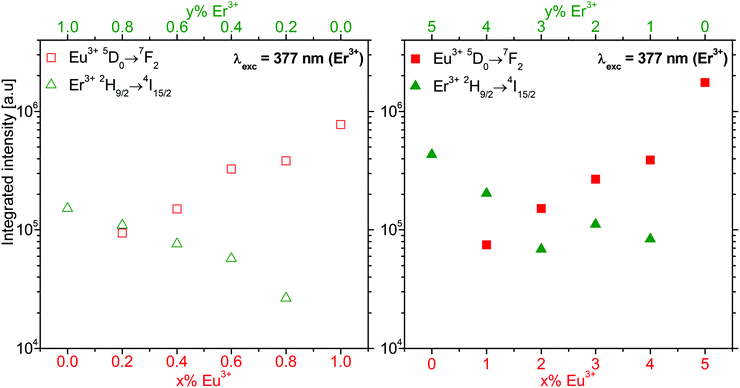 | ||
Fig. 9 Integrated intensity of the Eu3+ 5D0→7F2 (red square) and Er3+ 2H9/2→4I15/2 (green triangle) luminescence of β-NaGdF4:x% Eu3+,y% Er3+ nanocrystalline samples shown in Fig. S8 (ESI†). The empty (filled) symbols refer to a 1% (5%) total doping for x% Eu3+ and y = 1 − x (y = 5 − x)% Er3+. Er3+ was excited at 377 nm (26![[thin space (1/6-em)]](https://www.rsc.org/images/entities/char_2009.gif) 525 cm−1). The integrated intensity is reported on a logarithmic scale. 525 cm−1). The integrated intensity is reported on a logarithmic scale. | ||
Er3+ excitation at 377 nm results in strong Er3+ emission from the 2H9/2, 2H11/2, and 4S3/2 states, see Fig. 8. A minor emission at 19![[thin space (1/6-em)]](https://www.rsc.org/images/entities/char_2009.gif) 881 cm−1 (503 nm) is ascribed to the Er3+ 4G11/2→4I13/2 transition. At 377 nm Eu3+ is also directly excited, see Fig. 3. The resulting Eu3+ 5DJ→7FJ emissions are shown on an expanded scale in Fig. S9 (ESI†). A comparison with Fig. 6 reveals the additional overlapping Er3+ emissions labelled a–c in Fig. S9 (ESI†).
881 cm−1 (503 nm) is ascribed to the Er3+ 4G11/2→4I13/2 transition. At 377 nm Eu3+ is also directly excited, see Fig. 3. The resulting Eu3+ 5DJ→7FJ emissions are shown on an expanded scale in Fig. S9 (ESI†). A comparison with Fig. 6 reveals the additional overlapping Er3+ emissions labelled a–c in Fig. S9 (ESI†).
Since the luminescence spectra in Fig. 8 are normalized to the Eu3+ 5D0→7F2 emission, the strongly varying intensity of the Er3+ emissions allow a conclusive assignment of the Er3+ states. Their energies are reported in Table 1. The Eu3+ energies for β-NaGdF4:Eu3+ nanocrystallites were reported elsewhere.18 Both Er3+ and Eu3+ emission intensities increase with doping. On the logarithmic scale of Fig. 9, they show a close to linear dependence on the concentration. This indicates the absence of significant energy transfer between Er3+ and Eu3+ ions. Both dopant ions behave rather independently and their luminescence intensity correlates with the respective absorption. For the same doping level, the Eu3+ 5D0→7F2 emission shows an approximately five-times higher intensity than the Er3+ 2H9/2→4I15/2 emission upon excitation at 377 nm.
| State | Energy [cm−1] |
|---|---|
| 2P3/2 | 31![[thin space (1/6-em)]](https://www.rsc.org/images/entities/char_2009.gif) 587 587 |
| 4G9/2, 2KJ | 27![[thin space (1/6-em)]](https://www.rsc.org/images/entities/char_2009.gif) 473 473 |
| 4G11/2 | 26![[thin space (1/6-em)]](https://www.rsc.org/images/entities/char_2009.gif) 525 525 |
| 2H9/2 | 24![[thin space (1/6-em)]](https://www.rsc.org/images/entities/char_2009.gif) 510 510 |
| 2H11/2 | 19![[thin space (1/6-em)]](https://www.rsc.org/images/entities/char_2009.gif) 011 011 |
| 4S3/2 | 18![[thin space (1/6-em)]](https://www.rsc.org/images/entities/char_2009.gif) 349 349 |
| 4I11/2 | 10![[thin space (1/6-em)]](https://www.rsc.org/images/entities/char_2009.gif) 219 219 |
| 4I13/2 | 6524 |
| 4I15/2 | 0 |
In contrast to our observations in β-NaGdF4:Eu3+,Er3+, efficient Er3+→Eu3+ energy transfer was reported in NaLa(WO4)2:x% Eu3+,3% Er3+ phosphors upon excitation at 378 nm with variable Eu3+ doping.31 Increasing the Eu3+ concentration enhanced the Eu3+ and quenched the Er3+ luminescence.
![[thin space (1/6-em)]](https://www.rsc.org/images/entities/char_2009.gif) 380 cm−1 (394 nm) are shown in Fig. S10 and S11 of ESI,† respectively. The integrated intensities of the Eu3+ 5D0→7F2 emission at 16
380 cm−1 (394 nm) are shown in Fig. S10 and S11 of ESI,† respectively. The integrated intensities of the Eu3+ 5D0→7F2 emission at 16![[thin space (1/6-em)]](https://www.rsc.org/images/entities/char_2009.gif) 260 cm−1 are reported in Fig. S12 of ESI.† On a logarithmic scale, the integrated intensity shows a linear dependence on the Eu3+ doping, as expected from the Lambert–Beer law in the absence of energy transfer. The spectra in Fig. S10 (ESI†) consist of Eu3+ emissions from the 5D0 and 5D1 states, similar to Fig. 6. With increasing Eu3+ doping, the emission from 5D1 decreases relatively to that of 5D0. Co-Doping with Er3+ counteracts that trend because the energy migration on the Eu3+ sublattice is reduced, as it was discussed in Section 3.2.1. A comparison to Fig. S9 (ESI†) reveals a very weak Er3+ 4S3/2→4I15/2 emission at 545 nm (18
260 cm−1 are reported in Fig. S12 of ESI.† On a logarithmic scale, the integrated intensity shows a linear dependence on the Eu3+ doping, as expected from the Lambert–Beer law in the absence of energy transfer. The spectra in Fig. S10 (ESI†) consist of Eu3+ emissions from the 5D0 and 5D1 states, similar to Fig. 6. With increasing Eu3+ doping, the emission from 5D1 decreases relatively to that of 5D0. Co-Doping with Er3+ counteracts that trend because the energy migration on the Eu3+ sublattice is reduced, as it was discussed in Section 3.2.1. A comparison to Fig. S9 (ESI†) reveals a very weak Er3+ 4S3/2→4I15/2 emission at 545 nm (18![[thin space (1/6-em)]](https://www.rsc.org/images/entities/char_2009.gif) 350 cm−1) for β-NaGdF4:1% Eu3+,4% Er3+ in Fig. S11B (ESI†). The virtual absence of Er3+ emissions upon Eu3+ excitation proves a negligible Eu3+→Er3+ energy transfer for 394 nm excitation.
350 cm−1) for β-NaGdF4:1% Eu3+,4% Er3+ in Fig. S11B (ESI†). The virtual absence of Er3+ emissions upon Eu3+ excitation proves a negligible Eu3+→Er3+ energy transfer for 394 nm excitation.
4. Conclusions
A room temperature synthesis for phase pure hexagonal β-NaGdF4 nanocrystalline samples was established. A crystallite size below 10 nm was determined by X-ray diffraction and electron microscopy. The energy transfer between Gd3+, Eu3+, and Er3+ ions was investigated depending on the excitation wavelength. For Gd3+ excitation at 273 nm, the Gd3+→Eu3+ energy transfer is very efficient and Eu3+ luminescence dominates the spectra. At 377 nm, both Er3+ and Eu3+ are excited. For identical dopant concentration, the Eu3+ emission is about five-times more intense than the Er3+ emission. The concentration dependence of the luminescence indicates an independent optical behaviour of both ions without any significant Er3+→Eu3+ or Eu3+→Er3+ energy transfer. Eu3+ excitation at 394 nm confirms the absence of Eu3+→Er3+ energy transfer and only Eu3+ luminescence is observed. Er3+ co-doping hinders the energy migration on the Gd3+ and Eu3+ sublattices which results in higher Gd3+/Eu3+ and Eu3+ 5D1/5D0 emission ratios. Time-resolved spectroscopy may yield a deeper characterization of the energy transfer processes. This was beyond the scope of this work, which focused on the synthesis of the material and its dopant dependent luminescence. A strong Er3+ 2H9/2 emission indicates small multiphonon relaxation losses to lower states and proves a good quality of the nanomaterial. The synthesis under strictly anhydrous conditions minimizes OH− impurities and the non-radiative losses resulting thereof.Conflicts of interest
There are no conflicts to declare.Acknowledgements
The financial support by the EU FP7 ITN LUMINET (Grant agreement No. 316906) is gratefully acknowledged by all authors. The authors thank the Microscopy Imaging Centre (MIC) at University of Bern for the access to TEM instruments.Notes and references
- K. W. Krämer, D. Biner, G. Frei, H. U. Güdel, M. P. Hehlen and S. R. Lüthi, Chem. Mater., 2004, 16, 1244–1251 CrossRef.
- J. F. Suyver, A. Aebischer, D. Biner, P. Gerner, J. Grimm, S. Heer, K. W. Krämer, C. Reinhard and H. U. Güdel, Opt. Mater., 2005, 27, 1111–1130 CrossRef CAS.
- A. Aebischer, S. Heer, D. Biner, K. Krämer, M. Haase and H. U. Güdel, Chem. Phys. Lett., 2005, 407, 124–128 CrossRef CAS.
- T. Kano, H. Yamamoto and Y. Otomo, J. Electrochem. Soc., 1972, 119, 1561 CrossRef CAS.
- Q. Ju, P. S. Campbell and A.-V. Mudring, J. Mater. Chem. B, 2013, 1, 179–185 RSC.
- F. You, Y. Wang, J. Lin and Y. Tao, J. Alloys Compd., 2002, 343, 151–155 CrossRef CAS.
- A. Aebischer, M. Hostettler, J. Hauser, K. Krämer, T. Weber, H. U. Güdel and H.-B. Bürgi, Angew. Chem., Int. Ed., 2006, 45, 2802–2806 CrossRef CAS PubMed.
- T. Rinkel, J. Nordmann, A. N. Raj and M. Haase, Nanoscale, 2014, 6, 14523–14530, 10.1039/C4NR03833A.
- P. Ptacek, H. Schäfer, K. Kömpe and M. Haase, Adv. Funct. Mater., 2007, 17, 3843–3848 CrossRef CAS.
- R. Thoma, H. Insley and G. Hebert, Inorg. Chem., 1966, 1005, 1222–1229 CrossRef.
- M. Haase and H. Schäfer, Angew. Chem., Int. Ed., 2011, 50, 5808–5829 CrossRef CAS PubMed.
- J.-C. Boyer, F. Vetrone, L. A. Cuccia and J. A. Capobianco, J. Am. Chem. Soc., 2006, 128, 7444–7445 CrossRef CAS PubMed.
- H.-X. Mai, Y.-W. Zhang, R. Si, Z.-G. Yan, L. Sun, L.-P. You and C.-H. Yan, J. Am. Chem. Soc., 2006, 128, 6426–6436 CrossRef CAS PubMed.
- S. Gai, C. Li, P. Yang and J. Lin, Chem. Rev., 2014, 114, 2343–2389 CrossRef CAS PubMed.
- H. Schäfer, P. Ptacek, H. Eickmeier and M. Haase, Adv. Funct. Mater., 2009, 19, 3091–3097 CrossRef.
- P. Ghosh and A.-V. Mudring, Nanoscale, 2016, 8, 8160–8169 RSC.
- M. Wang, Q.-L. Huang, J.-M. Hong, X.-T. Chen and Z.-L. Xue, Cryst. Growth Des., 2006, 6, 1972–1974 CAS.
- D. Yang, G. Li, X. Kang, Z. Cheng, P. Ma, C. Peng, H. Lian, C. Li and J. Lin, Nanoscale, 2012, 4, 3450–3459 RSC.
- G. Tessitore, K. W. Krämer and A.-V. Mudring, J. Lumin., 2017, 189, 91–98 CrossRef CAS.
- R. T. Wegh, H. Donker, K. D. Oskam and A. Meijerink, Science, 1999, 283, 663–666 CrossRef CAS PubMed.
- R. T. Wegh, E. V. D. van Loef and A. Meijerink, J. Lumin., 2000, 90, 111–122 CrossRef CAS.
- P. Ghosh, S. Tang and A.-V. Mudring, J. Mater. Chem., 2011, 21, 8640 RSC.
- F. You, S. Huang, S. Liu and Y. Tao, J. Lumin., 2004, 110, 95–99 CrossRef CAS.
- C. Ronda, J. Lumin., 2002, 100, 301–305 CrossRef CAS.
- R. T. Wegh, E. V. D. van Loef, G. W. Burdick and A. Meijerink, Mol. Phys., 2005, 101, 1047–1056 CrossRef.
- C. Lorbeer and A.-V. Mudring, Chem. Commun., 2014, 50, 13282–13284 RSC.
- A. Nardelli, E. Deuschle, L. D. de Azevedo, J. L. N. Pessoa and E. Ghisi, Renewable Sustainable Energy Rev., 2017, 75, 368–379 CrossRef CAS.
- N. Khan and N. Abas, Renewable Sustainable Energy Rev., 2011, 15, 296–309 CrossRef.
- L. Y. Bing, Procedia Eng., 2012, 29, 2765–2769 CrossRef.
- W. S. Souza, R. O. Domingues, L. A. Bueno, E. B. da Costa and A. S. Gouveia-Neto, J. Lumin., 2013, 144, 87–90 CrossRef CAS.
- Y. Liu, Y. Liu, G. Liu, X. Dong and J. Wang, RSC Adv., 2015, 5, 97995–98003 RSC.
- G. Seeta, R. Raju, E. Pavitra and J. S. Yu, Dalton Trans., 2014, 43, 9766–9776 RSC.
- M. D. Rabasović, B. D. Murić, V. Čelebonović, M. Mitrić, B. M. Jelenković and M. G. Nikolić, J. Phys. D: Appl. Phys., 2016, 49, 485104 CrossRef.
- W. Liu, G. Liu, X. Dong, J. Wang and W. Yu, Phys. Chem. Chem. Phys., 2015, 17, 22659–22667 RSC.
- A.-H. Li, Z.-R. Zheng, T.-Q. Lü, Q. Lü and W.-L. Liu, Opt. Express, 2009, 17, 3878 CrossRef CAS PubMed.
- V. Kumar Rai, A. Pandey and R. Dey, J. Appl. Phys., 2013, 113, 83104 CrossRef.
- Y. Dwivedi, A. Rai and S. B. Rai, J. Lumin., 2009, 129, 629–633 CrossRef CAS.
- L. Wang, X. Xue, H. Chen, D. Zhao and W. Qin, Chem. Phys. Lett., 2010, 485, 183–186 CrossRef CAS.
- P. Villanueva-Delgado, D. Biner and K. W. Krämer, J. Lumin., 2016, 189, 84–90 CrossRef.
- V. T. Deshpande, Acta Crystallogr., 1961, 14, 794 CrossRef CAS.
- R. D. Shannon and C. T. Prewitt, Acta Crystallogr., Sect. B: Struct. Crystallogr. Cryst. Chem., 1969, 25, 925–946 CrossRef CAS.
- A. Bednarkiewicz, A. Mech, M. Karbowiak and W. Stręk, J. Lumin., 2005, 114, 247–254 CrossRef CAS.
- M. Banski, A. Podhorodecki, J. Misiewicz, M. Afzaal, A. L. Abdelhady and P. O’Brien, J. Mater. Chem. C, 2013, 1, 801–807 RSC.
Footnote |
| † Electronic supplementary information (ESI) available: Synthesis, additional TEM micrographs, XRD patterns, thermogravimetric analysis, luminescence spectra, and integrated emissions. See DOI: 10.1039/c7nj03242k |
| This journal is © The Royal Society of Chemistry and the Centre National de la Recherche Scientifique 2018 |

