Green biosynthesis of CuO & Ag–CuO nanoparticles from Malus domestica leaf extract and evaluation of antibacterial, antioxidant and DNA cleavage activities†
Mangesh S.
Jadhav
 a,
Sameer
Kulkarni
a,
Prasad
Raikar
b,
Delicia A.
Barretto
c,
Shyam Kumar
Vootla
c and
U. S.
Raikar
*a
a,
Sameer
Kulkarni
a,
Prasad
Raikar
b,
Delicia A.
Barretto
c,
Shyam Kumar
Vootla
c and
U. S.
Raikar
*a
aDepartment of Physics, Karnatak University, Dharwad 580003, Karnataka, India. E-mail: usraykar_kud@yahoo.co.in
bVisvesvaraya Technological University, Machhe 590018, Belgaum, Karnataka, India
cDepartment of Biotechnology and Microbiology, Karnatak University, Dharwad 580003, Karnataka, India
First published on 8th November 2017
Abstract
The reactivity of metallic and bimetallic nanoparticles of copper and silver towards in vitro study has been quantitatively investigated. Here, we report an easy synthesis of nanoparticles by the green method using Malus domestica leaf extract, which acts as a good stabilizing agent. The synthesized CuO and Ag–CuO nanoparticles have shown Surface Plasmon Resonance maxima (SPR) at 335 and 440 nm, respectively. The particles are spherical and crystalline in nature with average sizes between 18 and 20 nm. The Malus domestica leaf-capped nanoparticles have exhibited interesting antibacterial activity with both Gram-positive and Gram-negative bacteria at microgram concentrations. The antioxidant activity of the synthesized nanoparticles has also been measured on the basis of the free radical scavenging activity by the DPPH (1,1-diphenyl 2-picrylhydrazyl) method. Moreover, the DNA cleavage activities of the synthesized nanoparticles have been screened by agarose gel electrophoresis using the E. coli pBR322 plasmid as a target. Hence. owing to the biologically active nature of the synthesized nanoparticles, these greenly synthesized NPs act as a potent therapeutic agent.
1. Introduction
Considerable experimental studies of nanoparticles provide evidence that they are advantageous in many fields due to different materials and their properties.1–4 Nanomedicine is a rapidly developing and promising field that makes best use of metals like synthesizing metallic nanoparticles with high therapeutic potential for various biomedical applications. The mechanism of nanoparticle toxicity depends on many factors such as surface modification, bacteria species, intrinsic properties and composition. Antimicrobial activity is related to compounds that kill bacteria or slow down their growth, without being generally toxic to the surrounding tissue.5 The most persuasive evidence for killing the bacteria, decreasing its growth and damaging the DNA is the release of ions by nanoparticles.6 Nanoparticles attack bacterial cells through multiple mechanisms leading to membrane, protein and DNA damage.Copper is used as a constituent of various metal alloys, such as sterling silver in jewelry, because of its appearance and hardness. Copper forms a rich variety of compounds, usually with oxidation states of +1 and +2, commonly known as cuprous and cupric ions, respectively.7,8 Generally, copper forms coordination complexes with ligands. Numerous methods are available in the literature to synthesize oxide nanoparticles of various sizes, morphologies and structures. Synthesis of inorganic materials at nanoscale is a challenging task owing to intrinsic difficulties in controlling the morphology and structure of products. Metal complexes have been synthesized and developed rapidly for different applications.9–14 Copper-alloy touch surfaces have natural properties to destroy a wide range of microorganisms within a short period of time.10,11 The higher concentration of copper influences feed conversion efficiency growth rates and kills the bacteria.15–17 So far, copper alloy products have been installed in health care centers in countries such as Japan, Korea, Ireland, the UK, Denmark and Brazil. Copper complexes have been found to react with DNA by different binding modes and to exhibit effective nuclease activity.18,19
Green synthesis of nanoparticles is more efficient than other methods as it is environmentally friendly and involves the inexpensive production of nanoparticles with specified properties.20,21 The use of plant extract for their synthesis due to its various plant metabolites, such as polyphenols, sugars, starch, alkaloids, phenolic acids, proteins, and terpenoids, plays a major role in the bioreduction of metal ions, yielding nanoparticles. Plants act as bioreactors, in binding and reduction of metal ions, thereby influencing the formation of nanoparticles.22 The major path to destroying bacteria is more specific to the respective bacterial strains. Moreover, to study the effect of synthesized nanoparticles, biological activities are examined on human pathogens.23
In the present report, green synthesis of CuO and Ag–CuO nanoparticles was investigated, wherein the nanoparticles were attached to the membrane of bacteria by electrostatic interaction. Malus domestica leaf extract was used as a stabilizing agent for the synthesis of nanoparticles. From the earliest times, the benefits and properties of Malus domestica have been intensively advertised and the phytochemicals present in Malus domestica protect us from heart disease, diabetes and cancer. Malus domestica has been used in traditional medicine for many years. Phytochemical and pharmacological studies support its traditional uses and it has proved to be useful for clinical studies and the development of commercial drugs. Here, in the current report, we concentrate on CuO and Ag–CuO alloys for the study of antibacterial, antioxidant and DNA cleavage activities.23–27
2. Experimental
2.1 Materials and methods
The materials used in the present report were copper(II) sulfate pentahydrate (CuSo4·5H2O), silver nitrate (AgNo3), Malus domestica plant leaves, deionized water, and Whattman's filter paper no. 4. All the chemicals used in our experiments were of analytical grade, purchased from Hi-media and used as received without further purification. Agar medium was used to screen the antibacterial activity of Escherichia coli (E. coli) and Staphylococcus aureus (S. aureus) species.2.2 Preparation of Malus domestica leaf extract
Malus domestica leaves were collected, cleaned with deionized water repeatedly, and dried. 100 g of leaves were chopped into small pieces and dissolved in deionized water, then kept for boiling at 80 °C for 2 h until the color changed from transparent to dark green. The prepared leaf extract was then kept at room temperature for cooling. The obtained extract was filtered twice with Whattman's filter paper no. 4 and the filtrate was stored at 10 °C for further use.2.3 Synthesis of CuO and Ag–CuO nanoparticles
CuO nanoparticles capped with Malus domestica leaf extract were synthesized by the green method.28,29 1 M of copper(II) sulfate pentahydrate (CuSo4·5H2O) was dissolved in 15 ml of deionized water. Meanwhile, 10 ml of leaf broth was added to the solution for the reduction of copper ions. The binary mixture of solution was maintained at 70 °C for 10 min and kept at room temperature. The reaction showed a color change from green to dark brown solution. The synthesized copper nanoparticles were then centrifuged at 5000 rpm for an hour and re-dispersed in deionized water and the process was repeated five times. Furthermore, copper nanoparticles were dried under a lamp for 3 h to produce the powder form.The Ag–CuO alloy nanoparticles were synthesized by green nanotechnology using Malus domestica leaf extract.30,31 1 M of copper(II) sulfate pentahydrate (CuSo4·5H2O) solution was prepared in 15 ml of deionized water. After its complete dissolution, 0.005 mol of silver nitrate (AgNo3) prepared from 5 ml of deionized water was added to the copper solution. 10 ml of leaf broth was mixed to a binary mixture of Ag–CuO solution and the reaction mixture was maintained at 80 °C for 10 min. The color of the solution changed to brown immediately after the leaf extract was introduced, which indicated the formation of nanoparticles.32,33 The resultant solution was kept at room temperature and washed with deionized water by centrifugation and redispersion five times. It was then allowed to dry under a lamp to produce its powder, and was used for different characterizations.
2.4 Characterization of CuO and Ag–CuO nanoparticles
CuO and Ag–CuO nanoparticles were characterized to study their optical properties, structure, composition, and surface morphology.34–37 For the study of optical properties, UV-Visible spectroscopy (UV-Vis spectrophotometer Hitachi U-3310 Japan) was performed taking a quartz cuvette with de-ionized water as a reference, and an X-Ray diffractometer (Rigaku pro analytical X-ray diffractometer) using a wavelength at 1.514 × 10⁻¹⁰ m for 2 theta 0 °C to 80 °C. Surface morphology of the CuO and Ag–CuO nanoparticles was studied through SEM analysis (JEOL Model JSM – 6390LV) and the elemental composition in CuO nanoparticles was examined using an energy dispersive spectrophotometer (EDS). The particle sizes of the synthesized CuO & Ag–CuO nanoparticles were examined by High-resolution Transmission Electron Microscopy (HR-TEM) (Jeol/JEM 2100). IR spectra were recorded using an FT-IR spectrophotometer (Nicolet 6700) for the range 400 to 4000 cm−1 using dry KBr pellet as a standard reference.2.5 Antibacterial activity
The antibacterial activities of the synthesized nanoparticles were investigated using the Agar Well diffusion method.38–40 Lag phase cultures of the Gram-positive bacteria S. aureus and Gram-negative bacteria E. coli were used as the test microorganisms. 100 μl of the test organisms were swab incubated onto the sterile Nutrient Agar petriplates for which 4 wells were then bored at 6 mm. Four concentrations (25, 50, 75, and 100 μg ml−1 in sterile distilled water) of the synthesized nanoparticles were added to the respectively labeled wells. These plates were incubated at 37 °C for 24 hours followed by observing and measuring the antibacterial activity of the synthesized nanoparticles and measuring the zones of inhibition in millimeters using the standard scale.2.6 Antioxidant activity
The antioxidant activity of the synthesized nanoparticles was measured on the basis of the free radical scavenging activity by the DPPH (1,1-diphenyl 2-picrylhydrazyl) method.41–43 The stock solution of DPPH was prepared by dissolving 3.9432 mg DPPH in 100 ml of methanol (0.1 mM) and stored at 4 °C until use. 2 ml of DPPH solution was mixed with 1 ml of different concentrations (20–100 μg ml−1) of the synthesized nanoparticles. Ascorbic acid (100 μg ml−1) was used as the reference standard. A mixture of 1 ml distilled water and 2 ml DPPH solution was used as the control. The reaction mixture was added and incubated at room temperature in the dark for 30 min. The absorbance was recorded spectrophotometrically at 517 nm. The antioxidant activity of the synthesized nanoparticles was estimated based on the percentage of DPPH radical scavenged according to the following equation:44Statistical analysis was carried out using SPSS software, version 20.0. The experiments were carried out in triplicate and the data were expressed as mean ± standard deviation by One-Way ANOVA. Turkey's multiple comparison tests were used to determine significant differences between the standard and synthesized compounds. Correlation analysis was carried out using Pearson's correlation analysis with P = 0.01.
2.7 DNA cleavage
The DNA cleavage study of the synthesized compounds was determined by agarose gel electrophoresis using E. coli pBR322 plasmid as a target.45–48 The synthesized compounds (100 μM) were dissolved in 6% DMSO (dimethylsulfoxide) solvent and mixed with the target plasmid (1![[thin space (1/6-em)]](https://www.rsc.org/images/entities/char_2009.gif) :
:![[thin space (1/6-em)]](https://www.rsc.org/images/entities/char_2009.gif) 1). The mixture was then incubated at 37 °C for 2 h. After the incubation period, the plasmid and the compound mixture were mixed with the tracking dye bromophenol blue (1
1). The mixture was then incubated at 37 °C for 2 h. After the incubation period, the plasmid and the compound mixture were mixed with the tracking dye bromophenol blue (1![[thin space (1/6-em)]](https://www.rsc.org/images/entities/char_2009.gif) :
:![[thin space (1/6-em)]](https://www.rsc.org/images/entities/char_2009.gif) 1). It was then loaded into the 1% agarose gel (containing 0.5 μg ml−1 ethidium bromides) wells along with two control wells, the first with untreated plasmid and the second with plasmid treated with DMSO solvent. Finally, it was electrophoresed at a 50 V constant voltage for about 30 min using Tris–EDTA (TAE) buffer (pH = 8.0). The bands were visualized by UV light and photographed for the analysis. The extent of cleavage of the super coiled DNA was determined by measuring the intensities of the bands using a Molecular Imager Geldoc gel-XR imaging system (BIORAD).49
1). It was then loaded into the 1% agarose gel (containing 0.5 μg ml−1 ethidium bromides) wells along with two control wells, the first with untreated plasmid and the second with plasmid treated with DMSO solvent. Finally, it was electrophoresed at a 50 V constant voltage for about 30 min using Tris–EDTA (TAE) buffer (pH = 8.0). The bands were visualized by UV light and photographed for the analysis. The extent of cleavage of the super coiled DNA was determined by measuring the intensities of the bands using a Molecular Imager Geldoc gel-XR imaging system (BIORAD).49
3. Results and discussion
Several methods are available for the synthesis of metal oxide nanoparticles of various sizes, shapes, and morphologies.50–53 The synthesis of copper oxide nanoparticles by different methods has been reported so far.54–57 The physico-chemical properties of the copper oxide nanoparticles allow these materials to be the potential candidates for use in electrode materials, solar energy devices, catalysts, sensors, and antibacterial activities. In the present report, we studied the antibacterial activity of greenly synthesized CuO and Ag–CuO nanoparticles on both Gram-positive and Gram-negative bacteria and evaluated the antioxidant activity of NPs by DPPH radical scavenging activity, as well as the DNA cleavage mechanism by the agarose gel electrophoresis method.3.1 Optical analysis of CuO and Ag–CuO nanoparticles (UV-visible spectroscopy)
Reduction of copper ions to form CuO and Ag–CuO nanoparticles was observed by color changes from blue to green to brown, A–C, respectively. These color changes depend on the heating of ionic liquid cation.58,59 The maximum absorbance of CuO and Ag–CuO nanoparticles was observed at 335 nm and 440 nm respectively, whereas the earlier reported absorbance band range was at 300–500 nm during the formation of nanoparticles (Fig. 1(a) and (b)).36,60 The peak position at 440 nm indicates that the contribution of the Ag component is more in Ag–CuO. The surface plasmon absorption bands indicate the formation of CuO and Ag–CuO nanoparticles. A diffuse reflectance spectrum (DRS) was used to find the energy band gap of the materials. The band gap energy is a characteristic feature of all the materials; it also extends to characteristics like crystallinity and stoichiometry. Band gap energy is generally obtained from optical edge of absorption spectra, which is nothing but the minimum energy required to excite an electron from the highest occupied molecular orbital to the lowest unoccupied molecular orbital.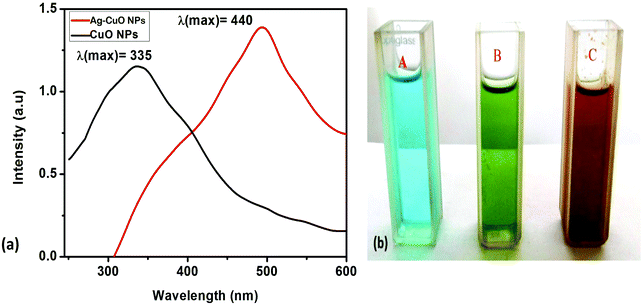 | ||
| Fig. 1 (a) UV-Vis absorption spectra (b) color change during reaction for CuO and Ag–CuO nanoparticles. | ||
The absorption coefficient nearest to the absorption edge is expressed as61–63
| αhν = A(hν − Eg)n | (1) |
3.2 FT-IR analysis of Malus domestica leaf extract, CuO and Ag–CuO nanoparticles
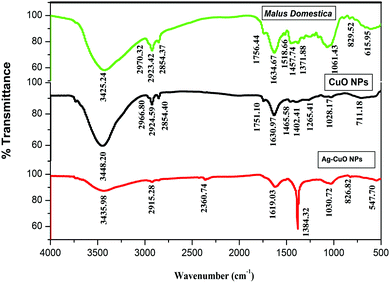
FT-IR spectra were recorded to study the effective incorporation of extract on nanoparticles and the presence of different functional groups in the nanocomposite material. To investigate the bond formation of nanoparticles, FT-IR analysis was performed. FT-IR spectra of Malus domestica leaf, CuO and Ag–CuO nanoparticles are as shown in Fig. 2. The CuO and Ag–CuO nanoparticles obtained for each of the solids reveal that there is a coordination of ligands in the solids. The broad band at 3425.24 cm−1 shows N–H stretching for silver and copper compounds. Bands at 2923.42 cm−1 and 2857.89 cm−1 are attributed to C–H asymmetric and symmetric stretching, respectively. The small peak at 1756.44 cm−1 shows the aldehyde (carbonyl group) due to phytochemicals present in the extract. In contrast with 1451.50 cm−1 C–H asymmetric bending, aqueous phase synthesis at 1321.24 cm−1 shows O–H bending. Bands at 1206.54 cm−1 and 1159.44 cm−1 show C–H bending (aromatic in plane). The band at 1069.90 cm−1 shows C–C vibrations (Skeletal) and 903.35 cm−1 C–H bending (out of plane).The characteristic peak of copper oxide nanoparticles at the 3448.20 cm−1 broad band shows N–H stretching (heterocyclic amine group), while two bands at around 2966.80 cm−1 and 2854.40 cm−1 can be assigned to C–H asymmetric stretching (methyl group) and C–H symmetric stretching (methylene), respectively. The band at 1465.58 cm−1 shows C–H asymmetric bending (methyl group), while the band at 1402.41 cm−1 shows the organic sulfate group. The band at 2924.95 cm−1 shows C–H asymmetric stretching (methylene- CH2) and the band at 1630.97 cm−1 shows C![[double bond, length as m-dash]](https://www.rsc.org/images/entities/char_e001.gif) C stretching (alkenyl). The band at 1265.41 cm−1 shows O–H or aryl-O stretching (aromatic ethers), while the band at 1028.17 cm−1 shows C–N stretching in primary amine and the band at 1751.10 cm−1 shows open chain acid anhydride. The absorption peaks reveal the vibration modes of CuO nanostructures at 711.18 cm−1. The reduction of copper ions to CuO and Ag–CuO nanoparticles are due to phytochemicals present in plant extract. As chemicals in the extract acts as stabilizing agents. A band at 2915.28 cm−1 shows methylene C–H asymmetric stretching, a band at 1619.03 cm−1 shows the secondary amine, and a band at 1384.32 cm−1 shows the organic sulfates due to the presence of the copper sulfate precursor. Bands at 1030.72 cm−1, 826.82 cm−1 and 547.70 cm−1 show aliphatic phosphates (P–O–C stretch), skeletal C–C vibrations (saturated aliphatic alkane/alkyl group) and C–I stretch in aliphatic iodo compounds (aliphatic organ halogen compound), respectively.64,65
C stretching (alkenyl). The band at 1265.41 cm−1 shows O–H or aryl-O stretching (aromatic ethers), while the band at 1028.17 cm−1 shows C–N stretching in primary amine and the band at 1751.10 cm−1 shows open chain acid anhydride. The absorption peaks reveal the vibration modes of CuO nanostructures at 711.18 cm−1. The reduction of copper ions to CuO and Ag–CuO nanoparticles are due to phytochemicals present in plant extract. As chemicals in the extract acts as stabilizing agents. A band at 2915.28 cm−1 shows methylene C–H asymmetric stretching, a band at 1619.03 cm−1 shows the secondary amine, and a band at 1384.32 cm−1 shows the organic sulfates due to the presence of the copper sulfate precursor. Bands at 1030.72 cm−1, 826.82 cm−1 and 547.70 cm−1 show aliphatic phosphates (P–O–C stretch), skeletal C–C vibrations (saturated aliphatic alkane/alkyl group) and C–I stretch in aliphatic iodo compounds (aliphatic organ halogen compound), respectively.64,65
3.3 Structural (X-ray diffraction) analysis of CuO and Ag–CuO nanoparticles
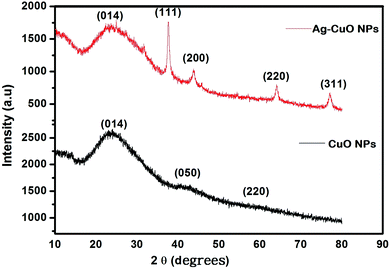
The XRD pattern of CuO and Ag–CuO nanoparticles is delineated in Fig. 3. The spectrum is identical to that of pure CuO with an orthorhombic structure. A diffraction pattern is observed at 2θ values 23.501 and 42.695. The lattice parameters a = 5.470, b = 6.020, and c = 9.340 are end-centered and sharp peaks correspond to (014) and (050) planes. For Ag–CuO nanoparticles, the main characteristic peaks at 2θ values 23.501, 37.5, 44.7 and 64.8, which correspond to the (014), (111), (200), (220) planes of fcc, confirm the formation of Ag–CuO nanoparticles (JCPDS file no. 87-0597).65–68 The sharp intense peak corresponding to (111) (200) and (311) is identified in the presence of Ag.69The average particle size was calculated by the Debye-Scherrer formula and was found to be 18 nm and 20 nm for the most intensive planes.
 | (2) |
3.4 Scanning electron microscopy (SEM) and energy dispersive spectroscopy (EDS)
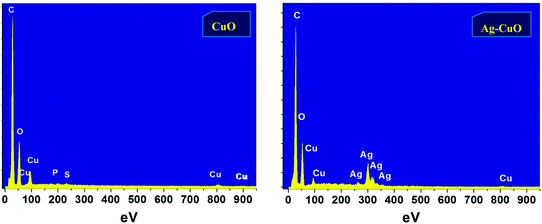
The SEM images of the CuO and Ag–CuO nanoparticles are as shown in Fig. S2 (ESI†). The CuO and Ag–CuO nanoparticles are spherical in shape and the average particle sizes as measured using a pixel ruler are 18 nm and 20 nm, respectively. Our nanoparticles synthesized by the green route are smaller in size and less agglomeration is found compared with earlier reports.Particles are arranged in a uniform order and are of regular shape. The synthesized CuO and Ag–CuO nanoparticles have shown stability in air and aqueous medium without being converted to any other compound. Fig. 4 depicts the EDS spectrum for greenly synthesized CuO and Ag–CuO nanoparticles, which helps to confirm the structure of the sample by providing semi-quantitative information about the elemental composition.35,37,70,71
The EDS study shows the presence of carbon, copper, silver, sulfur, and oxygen of the organic ligand linked to metallic nanoparticles and elements present in the grid, which are approximate to the stoichiometric proportion in the CuO and Ag–CuO nanoparticles (Table S1 (ESI†)).72
The EDS peaks show that the presence of Ag is rich in Ag–CuO nanoparticles, as shown by UV-Visible spectroscopy. The presence of oxygen confirms that a synthesized copper nanoparticle is oxidized upon exposure to air atmosphere. The presence of carbon is due to the phytochemicals, which act as a stabilizing agent.
3.5 HR-TEM analysis
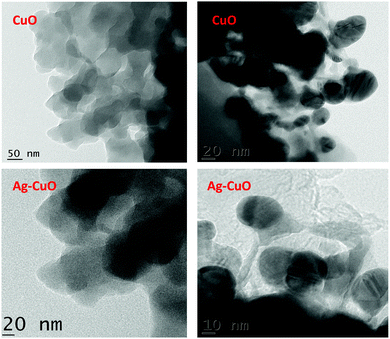
The TEM images show uniform dispersion of CuO and Ag–CuO nanoparticles with average diameters of 18 nm and 20 nm, respectively (Fig. 5). The average particle sizes determined by HR-TEM are closely matched to the crystallite size calculated by XRD and SEM analysis. This shows that the synthesized CuO and Ag–CuO nanoparticles are smaller in size and free from agglomeration.The TEM images clearly show that there is a layer of nanoparticles, which are less than 20–25 nm on the surface.
3.6 Antibacterial activity of CuO & Ag–CuO nanoparticles
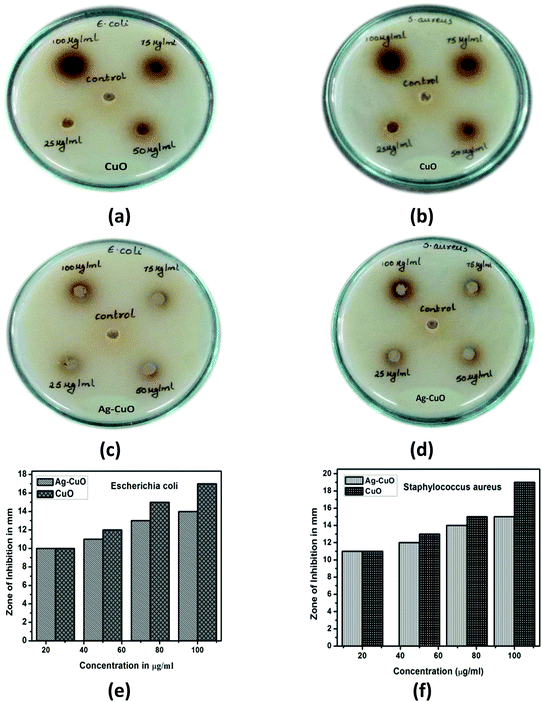
The antibacterial activities of the CuO and Ag–CuO nanoparticles were studied with pathogens of both Gram-positive Staphylococcus aureus and Gram-negative Escherichia coli bacteria. Fig. 6 shows the zone of inhibition on bacteria due to the effect of CuO and Ag–CuO nanoparticles for different concentrations.MIC was observed at 25 μg ml−1 with the zone of inhibition in mm. An increase in the size of the zone of inhibition was noticed for both bacteria tested with increasing concentrations of the CuO and Ag–CuO nanoparticles. Hajipour et al. showed the toxicity action by nanoparticles on release of Ag1+ and Cu2+, electrostatic interaction, cell wall damage, and rupture of the plasma membrane. There are more amines and carboxyl groups on the cell surface of Gram-positive bacteria and therefore they bind to nanoparticles.73
The synthesized nanoparticles exhibit good antibacterial activity with zones of inhibition against Escherichia coli and Staphylococcus aureus. Antimicrobial assays of the nanoparticles evaluated against the two pathogenic bacteria, namely, Gram-positive Staphylococcus aureus and Gram-negative Escherichia coli, showed zones of inhibition on the culture plates indicating the nanoparticles’ antibacterial nature.
CuO showed a greater zone of inhibition compared with Ag–CuO NPs. The release of Cu+ ions from nanoparticles to bind with bacterial enzymes leads to damage of the bacteria. This indicates that the CuO NPs are a potent antimicrobial agent carrying greater capacity to kill the microbes compared with the Ag–CuO NPs. Also, the compounds showed higher antimicrobial activity for the Staphylococcus aureus pathogen compared with Escherichia coli. We can therefore conclude that these nanoparticles are more active against Gram-positive bacteria compared with Gram-negative bacteria.
This study reveals the zone of inhibition in mm for E. coli and S. aureus bacteria for four concentrations of nanoparticles. The radial diameters of the zones of inhibition for E. coli and S. aureus caused by the CuO and Ag–CuO nanoparticles are as shown in Table 1. It was observed that nanoparticles are more effective than the extract in zone formation. Moreover, it was observed that the zone of inhibition is greater for S. aureus than for E. coli bacteria.
| Concentration (μg ml−1) | S. aureus | E. coli | ||
|---|---|---|---|---|
| CuO | Ag–CuO | CuO | Ag–CuO | |
| Zone of inhibition in mm | Zone of inhibition in mm | |||
| 25 | 11 | 11 | 10 | 10 |
| 50 | 13 | 12 | 12 | 11 |
| 75 | 15 | 14 | 15 | 13 |
| 100 | 19 | 15 | 17 | 14 |
This is possibly due to the difference in the structure of the cell wall between Gram-positive and Gram-negative bacteria. A number of studies have confirmed the antibacterial activities of different nanoparticles, but not compared with other biological applications. It has also been shown that activity has been tested for MICs 25 μg ml−1, however M. Ahamed et al. reported with MICs 31.25 μg ml−1.73
In contrast, the toxic effect in Gram-positive bacteria is disturbed permeability; cell division interacts with the membrane and sulfur. Hence, CuO nanoparticles showed excellent antibacterial activity due to the presence of sulfur.74
When CuO and Ag–CuO NPs attack bacterial cells through multiple mechanisms, the formation of reactive oxygen species (ROS) leads to membrane, protein, and DNA damage. Direct interaction occurs with the cell membrane because some metal-based nanoparticles can generate metal ions by dissolving in a solvent. Inhibition of the electron transport chain and regulation of the bacterial metabolic processes takes place (Fig. 6). The antibacterial activities of nanoparticles depend mainly on two factors—the physicochemical properties of nanoparticles and the type of bacteria.
3.7 Antioxidant activity of CuO & Ag–CuO nanoparticles
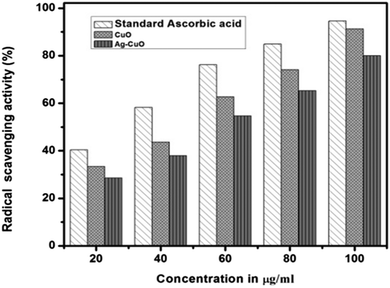
The antioxidant activity of CuO and Ag–CuO NPs is shown in terms of the concentration in μg ml−1 and the % radical scavenging activity in Fig. 7.
Capped nanoparticles were found to be potent free radical scavengers comparable to standard ascorbic acid. The free radical scavenging activity of the CuO and Ag–CuO nanoparticles at a higher concentration (100 μg ml−1) is comparable to standard ascorbic acid (Table 2).
| Concentration in μg ml−1 | Radical scavenging activity (%) | ||
|---|---|---|---|
| Standard ascorbic acida | CuOa | Ag–CuOa | |
| a Correlation is significant at the 0.01 level.Values are expressed as the mean ± SD of n = 3 in each group. Values are significantly different from the control at P < 0.01. | |||
| 20 | 40.4333 ± 2.24335 | 33.2967 ± 2.37530 | 28.5900 ± 1.07056 |
| 40 | 58.2700 ± 1.43419 | 43.5700 ± 1.26693 | 37.8900 ± 2.95944 |
| 60 | 76.1633 ± 2.75544 | 62.7300 ± 1.48563 | 54.6533 ± 2.33504 |
| 80 | 84.9433 ± 1.34031 | 74.1300 ± 2.03963 | 65.2933 ± 1.99362 |
| 100 | 94.6133 ± 0.90007 | 91.3033 ± 1.05548 | 80.0233 ± 1.75221 |
| IC50 value | 24.73 μg ml−1 | 45.90 μg ml−1 | 52.78 μg ml−1 |
An antioxidant stops oxidation by neutralizing the free radicals produced. To neutralize the free radicals, the antioxidant itself undergoes oxidation. The DPPH scavenging assay exhibited effective inhibition activity of CuO NPs compared with Ag–CuO.
3.8 DNA cleavage
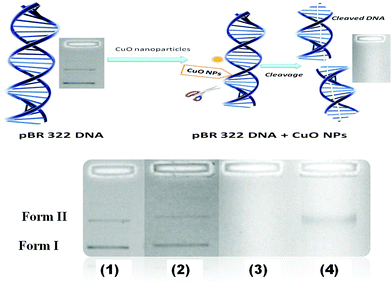
To explore the ability of nanoparticles to cleave DNA, the pBR322 DNA was used. DNA cleavage was controlled by relaxation of the super coiled circular form of pBR322 DNA. DNA can be sequenced by a chemical procedure that breaks a terminally labeled DNA molecule using nanoparticles.When DNA cleavage was conducted by electrophoresis, the fastest migration occurred for the form I. When the strand was cleaved (form I) it moved to a circular form (form II). In Fig. 8, the pattern shows the DNA cleavage activity for the leaf extract and the CuO and Ag–CuO nanoparticles. Experiments were carried out to eliminate the possibility that CuO and Ag–CuO NPs mediated cleavage of DNA by free copper ions. No cleavage was shown for the leaf extract, but it was shown to be effective for CuO, which is more than for the Ag–CuO nanoparticles. Hence, a CuO nanoparticle is an efficient biological agent on microorganisms and bacteria (Fig. 9).
 | ||
| Fig. 8 DPPH assay showing the enhanced antioxidant activity of the synthesized CuO and Ag–CuO nanoparticles. | ||
4. Conclusion
The simple, eco-friendly green synthesis of CuO and Ag–CuO nanoparticles has been reported using Malus domestica leaf extract as capping and reducing agents. Here, green extract was used for the reduction of copper material on the nanoscale.Synthesized nanoparticles were found to be orthorhombic in nature with a spherical shape and were highly stable. The CuO and Ag–CuO nanoparticles were used to study the antibacterial activity for Gram-positive and Gram-negative bacteria that have shown excellent results at different concentrations with MIC at 25 μg ml−1. The synthesized nanoparticles showed growth inhibitory activities against both Gram-positive and Gram-negative pathogenic bacteria. CuO nanoparticles showed excellent antioxidant activity compared with Ag–CuO nanoparticles with free radical scavenging activity comparable to the standard ascorbic acid. The DNA cleavage properties were screened using E. coli plasmid DNA pBR322 by the gel electrophoresis method. The interaction with greenly synthesized copper NPs has shown potent biological activities such as antibacterial, antioxidant and DNA cleavage and has many applications in science and other fields. Consequently, CuO nanoparticles have the potential for external use as a biological agent on microorganisms and bacteria.
Conflicts of interest
There are no conflicts to declare.Acknowledgements
The authors acknowledge the support by Vision Group on Science and Technology (VGST), Department of Science & Technology, Government of Karnataka (K-FIST L2, GRD 243) for the financial set up of the project commissioned at Karnatak University, Dharwad, India. Author Mangesh Jadhav is thankful to CSIR for providing a Junior Research Fellowship for the research work. The authors thank the Director and technical staff of USIC, Karnatak University Dharwad, for the UV-Vis and FTIR measurements.References
- T. C. Fischer, H. Halbwirth, B. Meisel, K. Stich and G. Forkmann, Arch. Biochem. Biophys., 2003, 412, 223–230 CrossRef CAS PubMed.
- M. Salavati-niasari, A. Khansari and F. Davar, Inorg. Chim. Acta, 2009, 362, 4937–4942 CrossRef CAS.
- A. Obri and O. Akpa, J. Nutr. Wellness, 2009, 10, 1–6 Search PubMed.
- P. Singh, Y. Kim, D. Zhang and D. Yang, Trends Biotechnol., 2016, 34, 588–599 CrossRef CAS PubMed.
- G. Ren, D. Hu, E. W. C. Cheng, M. A. Vargas-Reus, P. Reip and R. P. Allaker, Int. J. Antimicrob. Agents, 2009, 33, 587–590 CrossRef CAS PubMed.
- L. Wang, C. Hu and L. Shao, Int. J. Nanomed., 2017, 12, 1227–1249 CrossRef PubMed.
- K. Henzler, A. Heilemann, J. Kneer, P. Guttmann and H. Jia, Nat. Publ. Gr., 2015, 1–12 Search PubMed.
- C. Huo, J. Ouyang and H. Yang, Sci. Rep., 2014, 4, 1–9 Search PubMed.
- V. V. T. Padil and M. Cernik, Int. J. Nanomed., 2013, 8, 889–898 Search PubMed.
- M. Ghiyasiyan-arani, M. Masjedi-arani, D. Ghanbari and S. Bagheri, Nat. Publ. Gr., 2016, 1–9 Search PubMed.
- P. Raveendran, J. Fu and S. L. Wallen, J. Am. Chem. Soc., 2003, 125, 13940–13941 CrossRef CAS PubMed.
- D. Y. Zhang, Y. Nie, H. Sang, J. J. Suo, Z. J. Li, W. Gu, J. L. Tian, X. Liu and S. P. Yan, Inorg. Chim. Acta, 2017, 457, 7–18 CrossRef CAS.
- Y. A. Arfat, J. Ahmed and H. Jacob, Carbohydr. Polym., 2017, 155, 382–390 CrossRef CAS PubMed.
- M. D. Gammage, S. Stauffer, G. Henkelman, M. F. Becker, J. W. Keto and D. Kovar, Surf. Sci., 2016, 653, 66–70 CrossRef CAS.
- M. Hans, A. Erbe, S. Mathews, Y. Chen, M. Solioz and F. Mücklich, Langmuir, 2013, 29, 16160–16166 CrossRef CAS PubMed.
- A. D. Karthik and K. Geetha, J. Appl. Pharm. Sci., 2013, 3, 16–21 Search PubMed.
- A. Azam, A. S. Ahmed, M. Oves, M. S. Khan, S. S. Habib and A. Memic, Int. J. Nanomed., 2012, 6003–6009 CrossRef CAS PubMed.
- M. Gonzalez-Alvarez, G. Alzuet, J. Borras, M. Pitie and B. Meunier, J. Biol. Inorg. Chem., 2003, 8, 644–652 CrossRef CAS PubMed.
- M. S. Nair, D. Arish and R. S. Joseyphus, J. Saudi Chem. Soc., 2012, 16, 83–88 CrossRef CAS.
- K. B. Narayanan and N. Sakthivel, Adv. Colloid Interface Sci., 2011, 169, 59–79 CrossRef CAS PubMed.
- S. Iravani, Green Chem., 2011, 13, 2638–2650 RSC.
- J. E. Hutchison, ACS Nano, 2008, 2, 395–402 CrossRef CAS PubMed.
- S. Gunalan, R. Sivaraj and V. Rajendran, Prog. Nat. Sci.: Mater. Int., 2012, 22, 693–700 CrossRef.
- S. Jadhav, S. Gaikwad, M. Nimse and A. Rajbhoj, J. Cluster Sci., 2011, 22, 121–129 CrossRef CAS.
- R. S. Keri, K. M. Hosamani, R. V. Shingalapur and M. H. Hugar, Eur. J. Med. Chem., 2010, 45, 2597–2605 CrossRef CAS PubMed.
- P. P. N. V. Kumar, U. Shameem, P. Kollu, R. L. Kalyani and S. V. N. Pammi, BioNanoScience, 2015, 5, 135–139 CrossRef.
- S. R. I. Vishnu, P. Ramaswamy, S. Narendhran and R. Sivaraj, Bull. Mater. Sci., 2016, 39, 361–364 CrossRef.
- N. V. Suramwar, S. R. Thakare, N. N. Karade and N. T. Khaty, J. Mol. Catal. A: Chem., 2012, 359, 28–34 CrossRef CAS.
- R. Guin, S. Banu. A and G. A. Kurian, Int. J. Pharm. Sci., 2017, 7, 1–9 CrossRef.
- Y. Leon, I. Brito, G. Cardenas and O. Godoy, J. Chil. Chem. Soc., 2009, 54, 51–54 CAS.
- J. S. Sekhon and S. S. Verma, Plasmonics, 2011, 6, 311–317 CrossRef CAS.
- R. S. Society, E. Hassan and S. City, SMU Med. J., 2015, 2, 91–101 Search PubMed.
- S. T. Fardood and A. Ramazani, J. Nanostruct., 2016, 6, 167–171 Search PubMed.
- M. Fu, Y. Li, P. Lu, J. Liu and F. Dong, Appl. Surf. Sci., 2011, 258, 1587–1591 CrossRef CAS.
- A. Kala, S. Soosairaj, S. Mathiyazhagan and P. Raja, Curr. Sci., 2016, 110, 2011–2014 CrossRef CAS.
- H. S. Devi and T. D. Singh, Adv. Electron. Electr. Eng., 2014, 4, 83–88 Search PubMed.
- T. Sinha and M. Ahmaruzzaman, Photochem. Photobiol. Sci., 2016, 15, 1272–1281 CAS.
- V. V. T. P. M. Cernik, Int. J. Nanomed., 2013, 8, 889–898 CrossRef PubMed.
- H. R. Naika, K. Lingaraju, K. Manjunath, D. Kumar, G. Nagaraju, D. Suresh and H. Nagabhushana, J. Taibah Univ. Sci., 2014, 9, 7–12 CrossRef.
- V. Vilas, D. Philip and J. Mathew, J. Mol. Liq., 2016, 221, 179–189 CrossRef CAS.
- A. Moshalagae Motlatle, S. Kesavan Pillai, M. Rudolf Scriba and S. Sinha Ray, J. Nanoparticle Res., 2016, 18, 1–10 CrossRef CAS.
- D. Das, B. C. Nath, P. Phukon and S. K. Dolui, Colloids Surf., B, 2013, 101, 430–433 CrossRef CAS PubMed.
- S. Yallappa, J. Manjanna, M. A. Sindhe, N. D. Satyanarayan, S. N. Pramod and K. Nagaraja, Spectrochim. Acta, Part A, 2013, 110, 108–115 CrossRef CAS PubMed.
- W. Wang, Q. Tang, T. Yu, X. Li, Y. Gao, J. Li, Y. Liu, L. Rong, Z. Wang, H. Sun, H. Zhang and B. Yang, ACS Appl. Mater. Interfaces, 2017, 9, 3376–3387 CAS.
- R. V. Shingalapur, K. M. Hosamani, R. S. Keri and M. H. Hugar, Eur. J. Med. Chem., 2010, 45, 1753–1759 CrossRef CAS PubMed.
- B. Shao, L. Mao, N. Qu, Y.-F. Wang, H.-Y. Gao, F. Li, L. Qin, J. Shao, C.-H. Huang, D. Xu, L.-N. Xie, C. Shen, X. Zhou and B.-Z. Zhu, Free Radical Biol. Med., 2017, 104, 54–63 CrossRef CAS PubMed.
- A. Basak, H. M. d Bdour, J. C. Shain, S. Mandal, K. R. Rudra and S. Nag, Bioorg. Med. Chem. Lett., 2000, 10, 1321–1325 CrossRef CAS PubMed.
- J. Liu, T. Zhang, T. Lu, L. Qu, H. Zhou, Q. Zhang and L. Ji, J. Inorg. Biochem., 2002, 91, 269–276 CrossRef CAS PubMed.
- Y. Jin and J. A. Cowan, J. Am. Chem. Soc., 2005, 127, 8408–8415 CrossRef CAS PubMed.
- A. Ahmad, P. Mukherjee, S. Senapati, D. Mandal, M. I. Khan and M. Sastry, Colloids Surf., B, 2003, 28, 313–318 CrossRef CAS.
- A. R. Shahverdi, S. Minaeian, H. Reza, H. Jamalifar and A. Nohi, Process Biochem., 2007, 42, 919–923 CrossRef CAS.
- A. Khan, A. Rashid, R. Younas and R. Chong, Int. Nano Lett., 2016, 6, 21–26 CrossRef CAS.
- L. Koodlur Sannegowda, K. R. V. Reddy and K. H. Shivaprasad, RSC Adv., 2014, 4, 11367 RSC.
- S. Tabassum, A. Asim, R. A. Khan, F. Arjmand, D. Rajakumar, P. Balaji and M. A. Akbarsha, R. Soc. Chem. Adv., 2015, 5, 47439–47450 CAS.
- S. Honary, H. Barabadi, E. Gharaei-Fathabad and F. Naghibi, Dig. J. Nanomater. Biostructures, 2012, 7, 999–1005 Search PubMed.
- S. Harne, A. Sharma, M. Dhaygude, S. Joglekar, K. Kodam and M. Hudlikar, Colloids Surf., B, 2012, 95, 284–288 CrossRef CAS PubMed.
- R. Sivaraj, P. K. S. M. Rahman, P. Rajiv, S. Narendhran and R. Venckatesh, Spectrochim. Acta, Part A, 2014, 129, 25–258 CrossRef PubMed.
- S. Dagher, Y. Haik, A. I. Ayesh and N. Tit, J. Lumin., 2014, 151, 149–154 CrossRef CAS.
- A. Tadjarodi and R. Roshani, Curr. Chem. Lett., 2014, 3, 215–220 CrossRef CAS.
- M. S. Kwasny, L. Chancelier, S. Ng, H. G. Manyar, C. Hardacre and P. Nockemann, Dalton Trans., 2012, 41, 219–227 RSC.
- N. A. Dhas, C. P. Raj and A. Gedanken, Chem. Mater., 2006, 9, 134–137 Search PubMed.
- A. S. Nair and J. Isac, Int. J. Soc. Relev. Concern, 2015, 3, 1–11 Search PubMed.
- T. W. Kim, H. Ha, M. Paek, S. Hyun, J. Choy and S. Hwang, J. Mater. Chem., 2010, 20, 3238–3245 RSC.
- J. Coates, Encycl. Anal. Chem., 2000, 10815–10837 Search PubMed.
- A. El-Trass, H. Elshamy, I. El-Mehasseb and M. El-Kemary, Appl. Surf. Sci., 2012, 258, 2997–3001 CrossRef CAS.
- J. P. Ruparelia, A. K. Chatterjee, S. P. Duttagupta and S. Mukherji, Acta Biomater., 2008, 4, 707–716 CrossRef CAS PubMed.
- Y. Abboud, T. Saffaj, A. Chagraoui, A. El Bouari, K. Brouzi, O. Tanane and B. Ihssane, Appl. Nanosci., 2014, 4, 571–576 CrossRef CAS.
- N. R. Kim, K. Shin, I. Jung, M. Shim and H. M. Lee, J. Phys. Chem. C, 2014, 118, 26324–26331 CAS.
- Z. Ning, et al. , Nano, 2017, 12, 1750035 CrossRef.
- K. S. Tan and K. Y. Cheong, J. Nanoparticle Res., 2013, 15, 1537 CrossRef.
- R. Sankar, P. Manikandan, V. Malarvizhi and T. Fathima, Spectrochim. Acta, Part A, 2014, 121, 746–750 CrossRef CAS PubMed.
- R. Sivaraj, P. K. S. M. Rahman, P. Rajiv, H. A. Salam and R. Venckatesh, Spectrochim. Acta, Part A, 2014, 133, 178–181 CrossRef CAS PubMed.
- M. Ahamed, H. A. Alhadlaq, M. A. M. Khan, P. Karuppiah and N. A. Al-Dhabi, J. Nanomater., 2014, 1–4 Search PubMed.
- M. J. Hajipour, K. M. Fromm, A. A. Ashkarran, D. J. De Aberasturi, I. R. De Larramendi and T. Rojo, Trends Biotechnol., 2012, 10, 499–511 CrossRef PubMed.
Footnote |
| † Electronic supplementary information (ESI) available. See DOI: 10.1039/c7nj02977b |
| This journal is © The Royal Society of Chemistry and the Centre National de la Recherche Scientifique 2018 |


