Sensing of Ce(III) using di-naphthoylated oxacalix[4]arene via realistic simulations and experimental studies†
Manthan
Panchal
a,
Anita
Kongor
a,
Mohd
Athar
 b,
Viren
Mehta
a,
P. C.
Jha
 c and
V. K.
Jain
 *a
*a
aDepartment of Chemistry, School of Sciences, Gujarat University, Navrangpura, Ahmedabad – 380009, India. E-mail: drvkjain@hotmail.com
bSchool of Chemical Sciences, Central University of Gujarat, Gandhinagar, Gujarat-382030, India
cCentre for Applied Chemistry, Central University of Gujarat, Gandhinagar, Gujarat-382030, India
First published on 21st November 2017
Abstract
Here, we report a fluorescent sensor for the detection of Ce(III) using di-naphthoylated oxacalix[4]arene (DNOC). Formation of the DNOC-Ce(III) complex has been confirmed by 1H NMR and mass spectroscopic observations. A dramatic decrease in the emission intensity of DNOC is observed for Ce(III) with no competitive interference due to other divalent and trivalent ions. The linear range of detection was obtained over a concentration range between 18 nM and 2 μM. Furthermore, density functional theory (DFT)-based quantum mechanical calculations were executed to predict the most probable structure of the host–guest system. As the molecular geometry suggests, the nitro groups of DNOC bent and the naphthoyl groups (oxygen centres of alternate calixarene rings) stabilize the cerium inclusion complex in the 1,3-alternate conformation. Thus, a novel analytical approach has been developed for Ce(III) detection using the oxacalixarene framework in solution. Moreover, the selective behaviour of DNOC also facilitates new opportunities for determining Ce(III) in a wide range of real samples.
Introduction
Cerium(III) is the most abundant rare earth element leached from soils. The complexes/compounds of cerium have been employed in numerous industries, such as the drug, pharmaceutical, and agricultural industries, as a fuel additive, in ceramics and as a glass additive.1,2 Long-term exposure to cerium can cause lung embolisms and its accumulation in the body poses a severe threat to liver function.3 Exposure to a certain level of cerium might influence the development of organisms and the internal environment of cells because it induces oxidative stress, which results in the disruption of mitochondria, and it can also cleave DNA molecules.4 Thus, the detection of cerium is of considerable importance, and photo-physical methods are frequently used to determine the level of cerium.5–7According to previous reports, different calixarene platforms have been explored due to their host–guest interactions with cerium ions.8–13 To the best of our knowledge, oxygen-bridged hetera-calixarenes have hardly been explored as fluorescent chemosensors for any metal ions as they are still in the synthetic stage.14–18 The naphthoyl moiety is observed to be an ideal fluorophore for bio-imaging because of its excitation and emission in the UV region, and it does not pose any problems for the in vitro detection of metal ions.19 Hence, the attachment of a naphthoyl moiety to oxacalix[4]arene (OC) is of practical interest. Moreover, density functional theory approaches have evolved as a powerful and very reliable tool, being routinely used for the determination of various complex structures and molecular properties.20–22 In order to align with our earlier studies on calix-related supramolecular architectures, the present work is an attempt to create a new pathway via combined state-of-the-art computational-experimental insight.23–25
In the present work, for the first time, the sensing properties of naphthoyl-appended oxacalix[4]arene (DNOC) have been studied towards Ce(III) amongst various monovalent, divalent and trivalent metal ions. The linear range of detection for Ce(III) was found to be within a concentration limit of 18 nM to 2 μM. Mass spectroscopic and 1H NMR binding studies have been carried out to elucidate the binding mechanism of the DNOC-Ce(III) complex. Furthermore, the complex formation between DNOC and Ce(III) has been modelled by DFT optimization studies to render insights into the structural features of the DNOC-Ce(III) inclusion complex. The DFT calculations conclude that the naphthoyl groups and alternate calix rings of DNOC stabilize the Ce(III) via coordinate bonding. Additional stability towards Ce(III) as a guest analyte is also supplemented by the adjoining π-rings of DNOC that form cation–π interactions. The sensing potential of DNOC for Ce(III) has also been applied for real analytical applications using waste waters and synthetically polluted Ce(III) water samples. Thus, it is concluded that the proposed method using the DNOC ligand is a potential sensing tool for the detection of Ce(III) in environmental, toxicological and industrial water samples.
Experimental section
Chemicals and reagents
Naphthoyl chloride, triethyl amine and metal nitrate salts were purchased from Sigma-Aldrich. The water used in the experiments was obtained from a Millipore system (resistivity, 18 MΩ cm−1 at 25 °C, Millipore Systems). All of these solvents employed for the synthesis were commercially available and used as received without further purification. The purity of the compounds and the progress of the reactions were monitored by TLC on pre-coated silica gel-aluminium plates (Type 60 F254, Merck, Darmstadt, Germany).Instrumentation
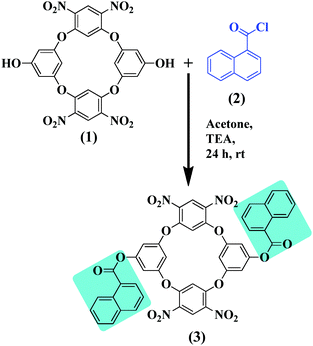
The ESI mass spectra were obtained on a MicromassQuarter2 mass spectrometer (Utah, USA) with a capillary voltage of 3000 V and a source temperature of 120 °C. The absorption spectra were recorded on a Jasco V-750 UV-Vis recording spectrophotometer (Tokyo, Japan) in the range of 200–800 nm. The fluorescence spectra were recorded using a Jasco FP-8300 spectrofluorimeter (Tokyo, Japan). A VEEGO (model no. VMP-DS) melting point apparatus (Mumbai, India) was used to measure the melting points (uncorrected) in a single capillary tube. The 1H NMR and 13C NMR spectra were obtained on a Bruker AV-(III)-400 MHz spectrometer using a BBFO probe.Di-naphthoylated oxacalix[4]arene (DNOC) has been prepared according to the previously reported synthetic procedure26,27 (Scheme 1).
General procedure for the detection of rare earth cations by spectrophotometry and spectrofluorimetry
The same concentrations (4 × 10⁻⁵ M) of DNOC stock solution and of metal nitrate salts were prepared in HPLC grade acetonitrile (ACN). 2.5 mL of each, the stock solution of DNOC (ligand) and the metal ion solution, were added to a 5 mL volumetric flask to attain an effective concentration of 2 × 10⁻⁵ M of DNOC. The absorption spectra in the presence of other cation solutions and that of DNOC were compared. An emission titration was also performed using the same stock solution of fluoroionophore (DNOC) with different metal ions, as in the absorption studies. The fluorescence spectra of the prepared solutions of metal ions and that of DNOC were then recorded.Computational details
All the theoretical calculations were performed using the TURBOMOLE suite of programs v6.5 at the density functional level of theory (DFT).28 The hybrid exchange–correlation functional B3LYP (Becke's three-parameter (B3) exchange in conjunction with the Lee–Yang–Parr's (LYP)) was exploited for the DFT treatment. The ground-state structures were fully optimized with the triple zeta (ζ) def-TZVP (triple zeta valence plus polarization) basis set of Schäfer et al. supplemented with a polarization function.29 The resolution of identity (RI) approximation of the TURBOMOLE program was used to solve the coulomb integral and for accelerating the calculation without losing numerical accuracy.30 The optimized auxiliary basis sets required for the RI computation were imported from the TURBOMOLE library,31 in combination with the m3 numerical quadrature grid for assessing the integration of the exchange correlation contribution.32 The optimization of the DNOC (host) structure was performed prior to the complex (DNOC-Ce(III)), in accordance with previous studies.33–35 In our model calculations, the Ce(III) was treated with the relativistic effective core potential, def-ecp as f electrons don’t take part in metal–ligand bonds because of their contraction in the core.36 The most probable location of Ce(III) was predicted by situating the metal ion at different probable sites using thorough conformational analysis. Furthermore, owing to the +3 charge and electronic configuration of the metal ion (f1), unconstrained computation was rendered using an open-shell unrestricted formalism in the gas phase. A recent implementation [2] of Grimme Dispersion correction [3] (DFT-D) was applied for the geometry optimization calculation. Also, to be confident in the energy minima, the host–guest complex was characterized by vibrational analysis. Subsequently, the single point energy was calculated to estimate the strength of interaction (binding energy) by implementing eqn (1).| Eint = EDNOC-Ce(III) − EDNOC − ECe(III) | (1) |
Results and discussion
Sensing of Ce(III)
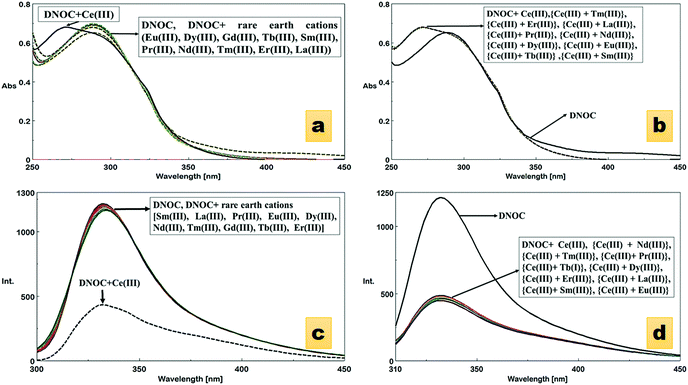
The absorption spectra of DNOC were recorded in ACN in the presence of different rare earth cations, including Ce(III), Dy(III), Eu(III), Tb(III), Sm(III), Pr(III), Nd(III), Tm(III), Er(III), La(III) and Gd(III). Compared with other ions, Ce(III) showed substantial changes in the absorption band of DNOC. The wavelength of DNOC at 289 nm was shifted to 271 nm after the addition of Ce(III) (Fig. 1a). A hypsochromic shift was observed roughly depending on the charge density of the cation.38 The absorption spectrum was studied in the presence of other interfering rare earth cations (Fig. 1b). The graphical representation of the absorption spectrum of DNOC for the detection of Ce(III) amongst various other monovalent, divalent and trivalent cations is also shown (Fig. 1c and Fig. S1, ESI†). Thus, with no interference observed, the DNOC ligand was found to be selective for Ce(III) ions.The ion-induced shifts in absorption mostly reflect the electrostatic interaction between the lone electron pair(s) of the donor heteroatoms in or conjugated to the ligand's Π system and the cation.38 It is proposed that DNOC shows a specific reactivity towards Ce(III) compared with other competitive ions because Ce(III) has an electronic configuration of 6s2 4f1 5d1 and its 4f–5d electronic transition has a high energy of 6.3 eV which makes it highly reactive compared with other ions.39
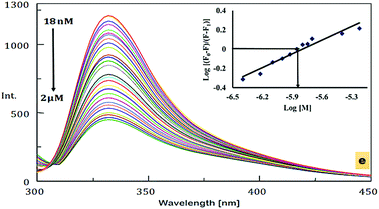
An emission study was also carried out in order to evaluate the ability of DNOC to act as a fluorescence chemosensor. Remarkable quenching of the fluorescence was observed upon the addition of Ce(III) (Fig. 1d). No change in intensity was observed with the other metal ions, except Ce(III). The emission spectrum of DNOC shows an emission at wavelength 332 nm under excitation at 289 nm. The quenching effects are primarily linked to the nature of the metal ion; it is proposed that if the metal ion is paramagnetic with unfilled d shells, it can cause quenching via an electron or an energy transfer.38 The comparative emission spectra were also taken in the presence of other cations as shown in Fig. 1e depicting no reference in the quenching effect of Ce(III). The fluorescence spectra of DNOC showing the changes in emission intensities upon the addition of increasing concentrations of Ce(III) are shown in Fig. 2. The linear detection range was found to be 18 nM to 2 μM. It was observed that the fluorescence intensity decreased gradually with increasing concentration of Ce(III). As only Ce(III) ions showed considerable change in the emission intensity, therefore its emission titration was used to assess its binding constant with DNOC using the procedure in ref. 40. The binding constant of the complex was found to be 7.14 × 10⁵ M−1 (inset of Fig. 2). The fluorescence quantum yield was determined based on the literature,41–43 and photochemical effects were studied for the Ce(III) complex with DNOC. Using the emission spectra of the standard fluorophore (naphthalene), the quantum yield of DNOC (fluoroionophore) was determined.
The quantum yield of the standard fluorophore is 0.23,44 and the quantum yield of the DNOC and Ce(III) complex was found to be 0.12. Thus, as the number of emitted photons decreased, the concentration of Ce(III) increased, i.e., quenching occurs. In order to understand the quenching mechanism quantitatively, Stern–Volmer analysis was carried out for the DNOC-Ce(III) complex (Fig. 3a). In our case, a linear plot was obtained indicating that the fluorescence quenching mechanism is either purely static or purely dynamic. Job's method of continuous variation (Fig. 3b) was used for the determination of the stoichiometric ratio of the DNOC-Ce(III) complex.
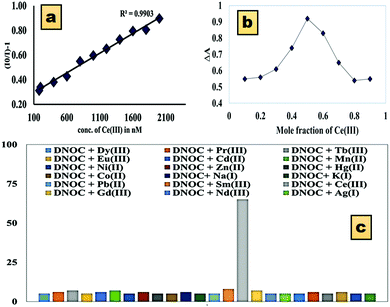 | ||
| Fig. 3 (a) Stern–Volmer plot of the quenching of DNOC by Ce(III) in ACN. (b) Job's plot of DNOC and Ce(III). (c) Graphical representation of the % quenching of DNOC with various metal ions. | ||
The analysis confirmed a 1![[thin space (1/6-em)]](https://www.rsc.org/images/entities/char_2009.gif) :
:![[thin space (1/6-em)]](https://www.rsc.org/images/entities/char_2009.gif) 1 stoichiometry ratio. A graphical representation of fluorescence quenching by Ce(III) (65.34%) in comparison with the other metal ions is shown in Fig. 3c.
1 stoichiometry ratio. A graphical representation of fluorescence quenching by Ce(III) (65.34%) in comparison with the other metal ions is shown in Fig. 3c.
Evaluation of the DNOC-Ce(III) complex
To elucidate the 1![[thin space (1/6-em)]](https://www.rsc.org/images/entities/char_2009.gif) :
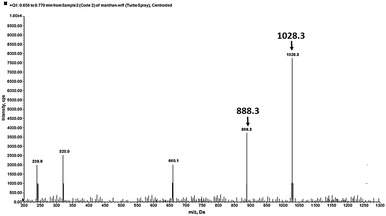
:![[thin space (1/6-em)]](https://www.rsc.org/images/entities/char_2009.gif) 1 complex formation between DNOC and Ce(III), the mass spectrum of DNOC shows a molecular ion peak at m/z 888.3 and, in the presence of Ce(III), a peak at 1028.3 [M + Ce(III)] is observed (Fig. 4).
1 complex formation between DNOC and Ce(III), the mass spectrum of DNOC shows a molecular ion peak at m/z 888.3 and, in the presence of Ce(III), a peak at 1028.3 [M + Ce(III)] is observed (Fig. 4).
The coordination behaviour of Ce(III) with DNOC was investigated by 1H NMR titration studies (Fig. 5). The 1H resonance signals of the aromatic protons of the naphthoyl moiety, H7 and H8 at δ = 7.71 and 7.43 ppm, undergo an upfield shift by 0.01 and 0.02 respectively. At the same time, aromatic protons of naphthoyl moieties, i.e., H6, H9, H10, and H12 at δ = 8.21, 8.02, 8.12, and 8.39 ppm undergo a downfield shift by 0.02, 0.01, 0.02 and 0.03 ppm. The aromatic proton of OC, H5 at δ = 7.51 ppm undergoes an upfield shift by 0.01 ppm and another proton, H1 at δ = 8.24 ppm undergoes a downfield shift by 0.02 ppm. These chemical shift changes of the proton resonances indicate that a well-integrated complex is formed between DNOC and Ce(III).
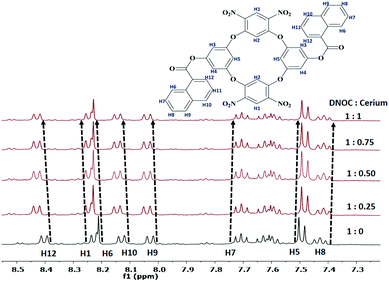 | ||
| Fig. 5 1H NMR (400 MHz) spectra of DNOC in the presence of Ce(III) in DMSO-d6, with increasing concentrations of guest Ce(III). | ||
DFT study of the DNOC-Ce(III) complex
The structural features of the 1![[thin space (1/6-em)]](https://www.rsc.org/images/entities/char_2009.gif) :
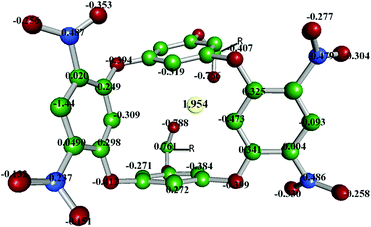
:![[thin space (1/6-em)]](https://www.rsc.org/images/entities/char_2009.gif) 1 DNOC-Ce(III) complex were studied by DFT studies [RI-B3LYP/def-TZVP] to give insight into the structural features of the inclusion complex.21 During the calculations, the conformational equilibrium (cone, partial cone, 1,3-alternate and 1,2-alternate) of the DNOC receptor was taken into account.45 We reported that 1,3-alternate conformations of DNOC were largely dominant, in analogy to Katz et al.27 The structure of the optimized complex is depicted in Fig. 6, and the corresponding Cartesian coordinates have been provided in the ESI.† Owing to the convergence check and absence of any negative frequency, we believe that the attained structure is a global minimum. As the molecular geometry suggests, the nitro groups bent towards the lower rim to form a compact pinched 1,3-alternate structure that was stabilized by the coulombic and π-interactions from the oxygen and aromatic calixarene rings. Furthermore, the signatures of the interactions can also be manifested from their bond lengths. It is also necessary to emphasize that the ring of the host calix together with the nitro groups (upper arm) distorted on complexation in order to achieve favourable interaction in compliance with earlier studies46 (optimization cycle movie). Consequently, the Ce(III) metal ion predominantly sits near to the lower rim of the 1,3-alternate rings of the inclusion complex. Furthermore, all the bridged oxygen(s) of the oxacalix ring are roughly positioned at the same distance from the metal but the centrally bridged carbon(s) deviate due to the alternate conformation behaviour of the macrocycle. Moreover, complimentary to our model calculation, the cation prefers to enclose in the π-cavity of the preformed 1,3-alternate conformation.47 The obtained findings certainly agree with the NMR spectrum (Fig. 5) that reveals minor shifting of the aromatic protons of OC and naphthoyl groups. Finally, to understand the stability of the complex, the estimated interaction/binding energy Ebind (Table 1) was found to be −395.4264 kcal mol−1, which can be attributed to electronic interactions.48,49 This larger negative energy indicates that the complexation of the guest into DNOC is highly energetically favourable.50
1 DNOC-Ce(III) complex were studied by DFT studies [RI-B3LYP/def-TZVP] to give insight into the structural features of the inclusion complex.21 During the calculations, the conformational equilibrium (cone, partial cone, 1,3-alternate and 1,2-alternate) of the DNOC receptor was taken into account.45 We reported that 1,3-alternate conformations of DNOC were largely dominant, in analogy to Katz et al.27 The structure of the optimized complex is depicted in Fig. 6, and the corresponding Cartesian coordinates have been provided in the ESI.† Owing to the convergence check and absence of any negative frequency, we believe that the attained structure is a global minimum. As the molecular geometry suggests, the nitro groups bent towards the lower rim to form a compact pinched 1,3-alternate structure that was stabilized by the coulombic and π-interactions from the oxygen and aromatic calixarene rings. Furthermore, the signatures of the interactions can also be manifested from their bond lengths. It is also necessary to emphasize that the ring of the host calix together with the nitro groups (upper arm) distorted on complexation in order to achieve favourable interaction in compliance with earlier studies46 (optimization cycle movie). Consequently, the Ce(III) metal ion predominantly sits near to the lower rim of the 1,3-alternate rings of the inclusion complex. Furthermore, all the bridged oxygen(s) of the oxacalix ring are roughly positioned at the same distance from the metal but the centrally bridged carbon(s) deviate due to the alternate conformation behaviour of the macrocycle. Moreover, complimentary to our model calculation, the cation prefers to enclose in the π-cavity of the preformed 1,3-alternate conformation.47 The obtained findings certainly agree with the NMR spectrum (Fig. 5) that reveals minor shifting of the aromatic protons of OC and naphthoyl groups. Finally, to understand the stability of the complex, the estimated interaction/binding energy Ebind (Table 1) was found to be −395.4264 kcal mol−1, which can be attributed to electronic interactions.48,49 This larger negative energy indicates that the complexation of the guest into DNOC is highly energetically favourable.50
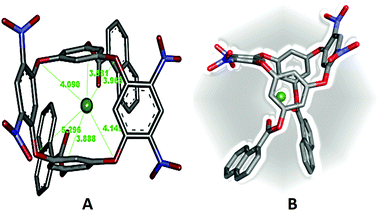 | ||
| Fig. 6 Optimized structure of DNOC-Ce(III) (B3LYP/def-TZVP). The distance is measured in Å between Ce(III) to oxygens (red colour) and carbon in the aromatic ring (grey colour). | ||
| %s | %p | %d | %f | Hybridisation | NBO charge | NP-core | NP-valence | NP-Rydberg |
|---|---|---|---|---|---|---|---|---|
| 14.570 | 42.710 | 38.480 | 4.235 | sp2.93d2.64f0.29 | 1.954 | 25.965 | 2.022 | 0.0570 |
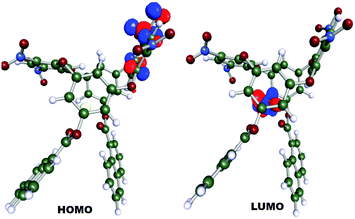
The Highest Occupied Molecular Orbital (HOMO) was localized at one of the calix rings whereas the Lowest Unoccupied Molecular Orbital (LUMO) was distinguishably positioned at the Ce(III) ion with an energy gap of 22.52 kcal mol−1 (Fig. 7). The energy difference during the DFT geometry optimization with the convergence cycle is also depicted in Fig. S2 (ESI†). Cerium possesses a natural charge of 1.9148 with the natural electronic population of the core, valence and rydberg electrons of 25.965, 2.022 and 0.057, respectively.
Likewise, the presence of nitro groups decreases the NBO charges on the four bridged oxygen atoms (−0.394 to −0.412), which indicates lesser coordination ability of electron-deficient bridged oxygen centres. Moreover, the two oxygens of each NO2 group hold NBO charges of −0.353 and −0.132 (Fig. 8).
It is imperative to mention that the two oxygen centres of the naphthoyl groups (NBO charges −0.766 and −0.788) and ring carbons (C6, C7, C46, C47) were primarily involved in forming the stabilising interactions (ESI,† Fig. S1). Furthermore, additional stability for the metal centre was supplemented from the adjoining π-rings that form cation–π interactions. Overall, from the assessment of the orbital populations of the complex (Table 1), it is reasonable to conclude that the cerium exhibits sp2.93d2.64 hybridization that was coordinated by the surrounding oxygen donors. It can be asserted that the cerium would have a distorted pentagonal-bipyramidal geometry in the cavity of DNOC.
Concluding this, it can be said that the structure obtained with high-precision quantum mechanical calculations would be expected to be analogous to the experimental structures. However, no comparable qualitative studies have been reported in the literature related to the calculation done in the present work.
Analytical application
In order to further explore the potential application of DNOC as a chemosensor for Ce(III) in real sample analysis, industrial waste water from Vatva GIDC, Ahmedabad, Gujarat, India was used from a common effluent treatment plant without any prior treatment. The samples were filtered to separate any suspended particulate matter. Thereafter, standard addition spectrofluorimetric experiments were carried out using DNOC to determine the amount of Ce(III) by spiking different concentrations of Ce(III) as shown in Table S1 (ESI†). Additionally, a successful attempt was also made to determine Ce(III) spiked in synthesized Ce(III)-polluted water samples [synthesized by: 100 × 10−9 M Ce(III); 100 × 10−9 M La(III), Sm(III) and Gd(III); 150 × 10−9 M Li(I), Na(I) and K(I); 200 × 10−9 M Mn(II), Cu(II), Ca(II), Co(II), Zn(II), Pb(II), and Ni(II)]. The results are summarized in Table S1 (ESI†). The recovery of Ce(III) in the real sample solutions was found to be in the range of 97.6–102.8%. The results so obtained matched well with those found by ICP-AES. However, compressively it is concluded that the spectrofluorimetric method for the determination of Ce(III) in real samples using DNOC is more substantial.Conclusion
An oxacalix[4]arene-based fluorescent cationic chemosensor, i.e., dinaphthoylated oxacalix[4]arene (DNOC) has been used as a recognition tool for Ce(III) ions. The blue shift in wavelength and quenching in intensity as revealed through absorption and emission studies respectively proves the ion-binding interaction of DNOC with Ce(III). Geometric insight was rendered by the high level quantum mechanical based DFT calculations, which predict that the Ce(III) encloses into the oxacalixarene cavity at the centroid of the DNOC with 1![[thin space (1/6-em)]](https://www.rsc.org/images/entities/char_2009.gif) :
:![[thin space (1/6-em)]](https://www.rsc.org/images/entities/char_2009.gif) 1 stoichiometry. Based on the results, it can be concluded that bridged oxygen centres and NO2 groups stabilize the Ce(III) via a combination of electrostatic and cation–π interactions. This paper has clearly shown that the HOMO is distinctly located at the appended naphthoyl groups whereas the LUMO was positioned at the Ce(III), which indicates the salient role of the naphthoyl scaffolds in the fluorescence mechanism. The proposed method is new for research related to oxacalix[4]arene and can be readily used in practice.
1 stoichiometry. Based on the results, it can be concluded that bridged oxygen centres and NO2 groups stabilize the Ce(III) via a combination of electrostatic and cation–π interactions. This paper has clearly shown that the HOMO is distinctly located at the appended naphthoyl groups whereas the LUMO was positioned at the Ce(III), which indicates the salient role of the naphthoyl scaffolds in the fluorescence mechanism. The proposed method is new for research related to oxacalix[4]arene and can be readily used in practice.
Conflicts of interest
There are no conflicts to declare.Acknowledgements
The authors acknowledge the financial assistance provided by University Grant Commission-Basic Scientific Research (UGC-BSR) (F./25-1/2013-14(BSR)/7-74/2007 (BSR) dated 30-05-2014) New Delhi. Mohd Athar and Anita Kongor would like to thank DST (IF15067 (Mohd Athar) and IF140940 (Anita Kongor)), New Delhi for providing an INSPIRE fellowship and PCJ would like to thank UGC for start-up grants. The authors also acknowledge Gujarat Forensic Science University, Gandhinagar (GFSU), Central Salt and Marine Chemicals Research Institute Bhavnagar (CSMCRI), Central University of Gujarat, Gandhinagar (CUG), National Facility for Drug Centre Discovery-Rajkot (NFDD), Oxygen Healthcare-Ahmedabad (O2h) for providing instrumental facilities, and UGC-Info net & INFLIBNET for e-journals. The authors thank the financial assistance provided by DST-SERB, New Delhi through the project scheme SERB REF. No EMR/2016/001958.References
- V. Höllriegl, M. González-Estecha, E. M. Trasobares, A. Giussani, U. Oeh, M. A. Herraiz and B. Michalke, J. Trace Elem. Med. Biol., 2010, 24, 193–199 Search PubMed.
- J. T. Dahle and Y. Arai, Int. J. Environ. Res. Public Health, 2015, 12, 1253–1278 CrossRef PubMed.
- A. Afkhami, T. Madrakian, A. Shirzadmehr, M. Tabatabaee and H. Bagheri, Sens. Actuators, B, 2012, 174, 237–244 CrossRef CAS.
- B. Wu, D. Zhang, D. Wang, C. Qi and Z. Li, Ecotoxicol. Environ. Saf., 2012, 21, 2068–2077 CrossRef CAS PubMed.
- Z. Yilong, Z. Dean and L. Daoliang, Int. J. Electrochem. Sci., 2015, 10, 1144–1168 Search PubMed.
- H. Revanasiddappa and T. K. Kumar, J. Anal. Chem., 2003, 58, 922–926 CrossRef CAS.
- Y. Liu and P. Wang, Rare Met., 2009, 28, 5–8 CrossRef CAS.
- S. E. Matthews, P. Parzuchowski, A. Garcia-Carrera, C. Grüttner, J.-F. Dozol and V. Böhmer, Chem. Commun., 2001, 417–418 RSC.
- V. K. Jain, S. G. Pillai and P. H. Kanaiya, J. Braz. Chem. Soc., 2006, 17, 1316–1322 CrossRef CAS.
- C. Gok, S. Seyhan, M. Merdivan and M. Yurdakoc, Microchim. Acta, 2007, 157, 13–19 CrossRef CAS.
- V. Jain, R. Pandya, S. Pillai, Y. Agrawal and P. Kanaiya, J. Anal. Chem., 2007, 62, 104–112 CrossRef CAS.
- N. T. N. Le, Int. J. Chem. Eng. Appl., 2011, 2, 381 Search PubMed.
- N. T. N. Le Le Van and T. L. N. Tu, Proceedings of International Conference on Chemistry and Chemical Process (ICCCP 2011), 2011.
- V. Mehta, M. Panchal, K. Modi, A. Kongor, U. Panchal and V. K. Jain, Curr. Org. Chem., 2015, 19, 1077–1096 CrossRef CAS.
- P.-Y. Gu, J. Gao, C.-J. Lu, W. Chen, C. Wang, G. Li, F. Zhou, Q.-F. Xu, J.-M. Lu and Q. Zhang, Mater. Horiz., 2014, 1, 446–451 RSC.
- W. Maes and W. Dehaen, Chem. Soc. Rev., 2008, 37, 2393–2402 RSC.
- M.-X. Wang, Chem. Commun., 2008, 4541–4551 RSC.
- J. W. Wackerly, M. Zhang, S. T. Nodder, S. M. Carlin and J. L. Katz, Org. Lett., 2014, 16, 2920–2922 CrossRef CAS PubMed.
- J. Hatai, M. Samanta, V. S. R. Krishna, S. Pal and S. Bandyopadhyay, RSC Adv., 2013, 3, 22572–22579 RSC.
- P. M. Marcos, F. A. Teixeira, M. A. Segurado, J. R. Ascenso, R. J. Bernardino, P. J. Cragg, S. Michel, V. Hubscher-Bruder and F. Arnaud-Neu, J. Phys. Org. Chem., 2013, 26, 295–305 CrossRef CAS.
- J. Schatz, Collection of Czechoslovak, Chem. Commun., 2004, 1169–1194 CAS.
- M. Bühl, C. Reimann, D. A. Pantazis, T. Bredow and F. Neese, J. Chem. Theory Comput., 2008, 4, 1449–1459 CrossRef PubMed.
- V. Mehta, M. Athar, P. Jha, A. Kongor, M. Panchal and V. Jain, New J. Chem., 2017, 41, 5125–5132 RSC.
- M. Panchal, M. Athar, P. Jha, A. Kongor, V. Mehta, K. Bhatt and V. Jain, RSC Adv., 2016, 6, 53573–53577 RSC.
- M. Panchal, M. Athar, P. Jha, A. Kongor, V. Mehta and V. Jain, J. Lumin., 2017, 192, 256–262 CrossRef CAS.
- V. Mehta, M. Athar, P. Jha, M. Panchal, K. Modi and V. Jain, Bioorg. Med. Chem. Lett., 2016, 26, 1005–1010 CrossRef CAS PubMed.
- J. L. Katz, M. B. Feldman and R. R. Conry, Org. Lett., 2005, 7, 91–94 CrossRef CAS PubMed.
- R. Ahlrichs, M. Armbruster, R. Bachorz, M. Bär, H. Baron, R. Bauernschmitt, F. Bischoff, S. Böcker, N. Crawford and P. Deglmannhttp://, See http://www.turbomole.com Search PubMed.
- A. Schäfer, C. Huber and R. Ahlrichs, J. Chem. Phys., 1994, 100, 5829–5835 CrossRef.
- K. Eichkorn, O. Treutler, H. Öhm, M. Häser and R. Ahlrichs, Chem. Phys. Lett., 1995, 240, 283–290 CrossRef CAS.
- K. Eichkorn, F. Weigend, O. Treutler and R. Ahlrichs, Theor. Chem. Acc., 1997, 97, 119–124 CrossRef CAS.
- O. Treutler and R. Ahlrichs, J. Chem. Phys., 1995, 102, 346–354 CrossRef CAS.
- E. Makrlík, J. J. Dytrtová, P. Vaňura, I. Císařová, J. Sýkora, V. Církva, J. Storch and M. Polášek, Struct. Chem., 2016, 27, 627–635 CrossRef.
- E. Makrlík, S. Záliš and P. Vaňura, J. Mol. Liq., 2016, 214, 171–174 CrossRef.
- E. Makrlík, M. Bureš, P. Vaňura and Z. Asfari, J. Mol. Liq., 2016, 218, 473–477 CrossRef.
- L. Maron and O. Eisenstein, J. Phys. Chem. A, 2000, 104, 7140–7143 CrossRef CAS.
- J. Foster and F. Weinhold, J. Am. Chem. Soc., 1980, 102, 7211–7218 CrossRef CAS.
- K. Rurack, Spectrochim. Acta, Part A, 2001, 57, 2161–2195 CrossRef CAS.
- E. Priyadarshini, N. Pradhan, P. Panda and B. Mishra, Biosens. Bioelectron., 2015, 68, 598–603 CrossRef CAS PubMed.
- C. Duran, A. Gundogdu, V. N. Bulut, M. Soylak, L. Elci, H. B. Sentürk and M. Tüfekci, J. Hazard. Mater., 2007, 146, 347–355 CrossRef CAS PubMed.
- U. Resch-Genger, M. Grabolle, S. Cavaliere-Jaricot, R. Nitschke and T. Nann, Nat. Methods, 2008, 5, 763–775 CrossRef CAS PubMed.
- S. M. Darjee, D. R. Mishra, K. D. Bhatt, D. J. Vyas, K. M. Modi and V. K. Jain, Tetrahedron Lett., 2014, 55, 7094–7098 CrossRef CAS.
- C. A. Parker and W. Rees, Analyst, 1960, 85, 587–600 RSC.
- J. Dessingou, R. Joseph and C. P. Rao, Tetrahedron Lett., 2005, 46, 7967–7971 CrossRef CAS.
- M. Athar, M. Y. Lone and P. C. Jha, J. Mol. Liq., 2017, 237, 473–483 CrossRef CAS.
- A. B. Rozhenko, W. W. Schoeller, M. C. Letzel, B. Decker, C. Agena and J. Mattay, Chem. – Eur. J., 2006, 12, 8995–9000 CrossRef CAS PubMed.
- R. Bernardino and B. Costa Cabral, Supramol. Chem., 2002, 14, 57–66 CrossRef CAS.
- J. Dybal, E. Makrlík and P. Vaňura, Monatsh. Chem., 2007, 138, 541–543 CrossRef CAS.
- J.-I. Choe and D.-S. Oh, Bull. Korean Chem. Soc., 2004, 25, 847–851 CrossRef CAS.
- Z. B. Nojini, F. Yavari and S. Bagherifar, J. Mol. Liq., 2012, 166, 53–61 CrossRef CAS.
Footnote |
| † Electronic supplementary information (ESI) available. See DOI: 10.1039/c7nj02828h |
| This journal is © The Royal Society of Chemistry and the Centre National de la Recherche Scientifique 2018 |

