Isolation and characterization of novel degradation products in cilnidipine by LC-QTOF-MS/MS, LCMSn, 2D-NMR and FTIR†
Krishnam Raju
Ch
ab,
Shanmukha Kumar
J. V.
 *a and
Sanath Kumar
Goud Palusa
b
aDepartment of Chemistry, K L University, Guntur, Andhra Pradesh-522502, India. E-mail: shanmukh_fed@kluniversity.in; Tel: +91 9000586007
bAnalytical Research and Development, United States Pharmacopeial Convention – India (P) Ltd., Plot No. D6 & D8, IKP, Genome Valley, Shameerpet, Hyderabad, Telangana-500078, India
First published on 27th November 2017
Abstract
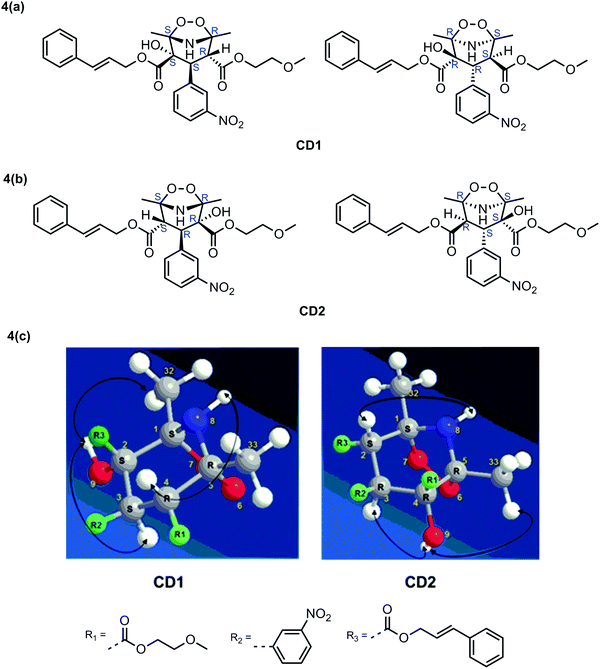
Cilnidipine (CIL) is a novel calcium antagonist accompanied with L-type and N-type calcium channel blocking functions. The drug was subjected to stress studies as per the international conference on harmonization guidelines (ICH) Q1A (R2) to understand the degradation profile of the drug. In the present study, seven degradation products were detected by simple mass compatible high performance liquid chromatography (HPLC) and tentatively characterized using high resolution mass spectrometry. Of these, three oxidative degradation (CD1, CD2 & CD3) products were isolated from the reaction mass using preparative HPLC and their structures were elucidated comprehensively using high resolution and multistage mass fragmentation studies, multidimensional nuclear magnetic resonance and in spectroscopic techniques. Formation of racemic mixtures for each CD1 and CD2 were verified by chiral HPLC. Stereo centers for CD1 and CD2 were fixed using ROESY data as 1S, 2S, 3S, 4R, 5R (and its enantiomer) and 1S, 2S, 3R, 4R, 5R (and its enantiomer). To the best of our knowledge, CD1 and CD2 were novel structures which have not been discussed in any form of publication as yet. The proposed structures of CD1, CD2 and CD3 have been rationalized by appropriate mechanisms.
Introduction
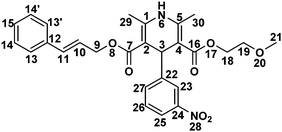
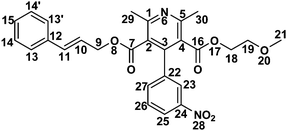
Cilnidipine (CIL), 3-O-(2-methoxyethyl)-5-O-[(E)-3-phenylprop-2-enyl] 2,6-dimethyl-4-(3-nitro-phenyl)-1,4-dihydropyridine-3,5-dicarboxylate, CIL is a novel calcium antagonist accompanied with L-type and N-type calcium channel blocking functions. CIL is a dihydropyridine calcium-channel blocker. It inhibits the cellular influx of calcium, thus causing vasodilatation. It has a greater selectivity for vascular smooth muscle.1,2 Stress studies using acid, base, oxidative, photolytic, thermal and humidity stresses of the APIs are a common way of simulating the impurities, which may appear or increase during transportation or during shelf time beyond the unacceptable level. A thorough literature search revealed that Ishijima et al.3 discussed hydrolytic and photolytic stress studies for CIL. Photo degradation of cilnidipine was recently studied by Hongxia et al.4 Various assay procedures are available for the detection of CIL.5–7 To the best of our information, no attempts have previously been made to identify the oxidative stress degradants. This prompted us to carry out a comprehensive degradation study of the drug.Recently, there have been many works published on the characterization of potential drug impurities in API and formulations using ICH Q3A(R2), based on modern and sophisticated analytical protocols.8–14 In the present study, a comprehensive stress degradation study was carried out under hydrolytic (acidic and alkaline), oxidative, thermal, humid and photolytic conditions to evaluate the intrinsic stability of the CIL drug substance. CIL is stable for humid and thermal conditions, but is susceptible to hydrolytic, photolytic and oxidative conditions.
A total of seven degradation products (DPs) were identified and tentatively characterized by mass spectrometric studies with accurate mass measurements. The thorough literature search revealed that hydrolytic and photolytic degradation products, KD1, KD2, KD3 and KD4 have been published by Ishijima et al.3 While potential oxidative DPs, CD1, CD2 and CD3 were not reported by any publishers until recently. Hence, this prompted us to carry out a comprehensive characterization of oxidative DPs using hyphenated techniques. CD1, CD2 and CD3 were isolated from the reaction mass using preparative HPLC and then characterized using all modern sophisticated spectral techniques. A simple mass compatible high performance liquid chromatography (HPLC) method has been developed to monitor the degradation profile. In addition, the HPLC method was transferred to UPLC for UPLC-Q-TOF-MS analysis to identify the degradants with accurate mass measurements.
Experimental
Drugs and reagents
CIL sample was obtained from USP-India, Hyderabad, India. HPLC grade solvents such as acetonitrile (ACN), methanol (MeOH), n-hexane, isopropyl alcohol (IPA), ethanol (EtOH) and other chemicals such as ammonium acetate (Amm ace), 30% v/v hydrogen peroxide (H2O2), hydrochloric acid (HCl), sodium hydroxide (NaOH) and deuterated dimethyl sulfoxide (DMSO-d6) were purchased from Merck (Merck, Mumbai, India). HPLC grade purified water was obtained using a Milli-Q water purification system (Millipore Corporation, Billerica, MA, USA).Instrumentations
All stability samples were analyzed by using Waters Alliance analytical HPLC (Waters Corporation, Milford, MA, USA) equipped with a photodiode array (PDA) detector using a Zorbax SB C18, 250 mm × 4.6 mm column packed with 5 μm particles. Chromatographic data was acquired using Empower 3 software.An Agilent HPLC (Agilent technologies, Santa Clara, CA 95051, United States) equipped with VWD was used for the separation of enantiomers of each CD1, CD2 and CIL compounds. Analytical Chiralpak IC (cellulose tris-(3,5-dichlorophenylcarbamate) immobilized on 5 μm silica-gel) 250 × 4.6 mm column packed with 5 μm particles was used with a solvent flow of 1.0 mL min−1 and the detection was carried out at 240 nm using a isocratic run with a mobile phase of n-hexane![[thin space (1/6-em)]](https://www.rsc.org/images/entities/char_2009.gif) :
:![[thin space (1/6-em)]](https://www.rsc.org/images/entities/char_2009.gif) IPA
IPA![[thin space (1/6-em)]](https://www.rsc.org/images/entities/char_2009.gif) :
:![[thin space (1/6-em)]](https://www.rsc.org/images/entities/char_2009.gif) ethanol (70
ethanol (70![[thin space (1/6-em)]](https://www.rsc.org/images/entities/char_2009.gif) :
:![[thin space (1/6-em)]](https://www.rsc.org/images/entities/char_2009.gif) 15
15![[thin space (1/6-em)]](https://www.rsc.org/images/entities/char_2009.gif) :
:![[thin space (1/6-em)]](https://www.rsc.org/images/entities/char_2009.gif) 15, v/v/v). Furthermore, the column oven temperature was ambient, whilst the diluent was IPA.
15, v/v/v). Furthermore, the column oven temperature was ambient, whilst the diluent was IPA.
A waters preparative HPLC (Waters Corporation) equipped with UV-Vis detector was employed for the isolation of CD1 and CD2 using a Phenomenex Luna Phenyl-Hexyl 100A, 250 mm × 21.20 mm packed column with 5 μm particles. The flow rate was 18 mL min−1 and the detection was carried out at 240 nm. The mobile phases consisted part A and B where part A was water while B was acetonitrile. A timed program of T/%B: 0/40, 17/60, 22/60, 22.1/95, 27/95, 27.1/40, 30/40 was followed for the linear gradient. While isolation of CD3 was performed using a Phenomenex Luna C18 100A, 250 mm × 21.20 mm packed column, with 5 μm particles, and a timed program of T/%B: 0/40, 3/40, 12/80, 18/80, 18.1/40, 23/40 was followed for linear gradient.
LCMSn analysis was carried out using a Thermo ion trap mass spectrometer (Thermo scientific, Waltham, MA, USA) coupled to an UHPLC quaternary gradient. LC-MS analysis was performed to study degradation samples. LC-MSn experiments were performed to study the multilevel fragmentation patterns of CD1, CD2, CD3 and CIL which creates systematic linkage to draw the fragment structures. MS analysis was performed by applying a heated electrospray ionization (HESI) source in positive and negative ion modes. The HESI source parameter settings were a source voltage of 4.0 kV, capillary temperature 350 °C, source heater temperature 350 °C, sheath gas flow 45.0, auxiliary gas flow 20.0, S-Lens RF level 60.0%. The data was acquired using Xcalibur software.
LC-Q-TOF-MS analysis was carried out using a SYNAPT G2 Q-TOF mass spectrometer (Waters Corporation) coupled to an ACQUITY H-Class UPLC having a quaternary gradient pump to identify accurate mass measurements with mass accuracy and provide chemical formula suggestion for degradants. Q-TOF-MS/MS analysis was carried out to study the fragmentation patterns for CD1, CD2, CD3 and CIL. MS analysis was performed by applying an electrospray ionization (ESI) source in the positive ion mode. ESI source parameters settings were as follows; capillary voltage 3.2 kV, source temperature 120 °C, desolvation temperature 250 °C, sampling cone 40 V, extraction cone 3.0 V, and desolvation gas flow 800 L h−1. The data was acquired using Masslynx 4.1 software.
GC-MS analysis for the acid degradation sample of CIL (KD2) was carried out on a Agilent GC-MS (Agilent technologies) in order to identify the mass of KD2. Chromatography was carried out using a Restex stabilwax, 30 m × 0.25 mm, 0.25 μm. The flow rate was 1.0 mL min−1, injection volume was 1.0 μL and split ratio was 10![[thin space (1/6-em)]](https://www.rsc.org/images/entities/char_2009.gif) :
:![[thin space (1/6-em)]](https://www.rsc.org/images/entities/char_2009.gif) 1. The inlet temperature was 200 °C, run time was 39 min and column oven program was 60 °C for 5 min, then 10 °C min−1 to 200 °C for 20 min. MS analysis was performed by applying an electron impact (EI) source. The EI source parameters settings were as follows; M/S Quad: 150 °C, MS source: 230 °C and turbo speed: 100. The data was acquired using MSD chemstation software.
1. The inlet temperature was 200 °C, run time was 39 min and column oven program was 60 °C for 5 min, then 10 °C min−1 to 200 °C for 20 min. MS analysis was performed by applying an electron impact (EI) source. The EI source parameters settings were as follows; M/S Quad: 150 °C, MS source: 230 °C and turbo speed: 100. The data was acquired using MSD chemstation software.
NMR spectral studies were carried out on a Bruker Ascend 500, Avance III HD spectrometer (Bruker BioSpin AG, Industriestrasse 26, 8117 Fallanden, Switzerland) with Topspin software, version 3.2. Spectra were recorded using 500 MHz for 1H NMR and 126 MHz for 13C NMR. The studies were undertaken at 298 K in DMSO-d6 solvent for CD1, CD2, CD3 and CIL. The 1H NMR chemical shift values were referenced to tetramethylsilane (TMS) (δ = 0.00 ppm) present in DMSO-d6 solvent, whereas 13C NMR was referenced to DMSO-d6 (δ = 39.50 ppm). Multiplicities of the NMR signals are designated as s (singlet), d (doublet), t (triplet), q (quartet), br (broad), m (multiplet, for unresolved lines) etc. The proton and carbon chemical shift assignments were carried out with the help of two-dimensional (2D) correlation spectroscopy (COSY).15 COSY correlates the chemical shift of two hydrogen nuclei located on two different atoms that are separated by a single bond, total correlation spectroscopy (TOCSY)16 provide correlations between all protons in a given spin system, hetero nuclear single quantum correlation spectroscopy (HSQC)17 correlates the chemical shift of hetero nuclei with hydrogens through bonds, hetero nuclear multiple bond correlation spectroscopy (HMBC)18 correlates the chemical shift of hetero nuclei with hydrogens through a multiple bond, and nuclear overhauser effect spectroscopy (NOESY) and rotating frame overhauser effect spectroscopy (ROESY) correlate between nuclei which are spatially close. All the experiments were carried out in the phase sensitive mode.19 The spectra were acquired with 2 × 256 or 2 × 192 free induction decays (FID) containing 8–16 transients with relaxation delays of 1.0–1.5 s. The 2D data were processed with Gaussian apodization in both the dimensions.
The FTIR spectra were recorded in the range of 4000–400 cm−1 using a PerkinElmer Spectrum 100 spectrophotometer (Waltham, MA, USA). A 1% sample pellet was prepared using dried KBr powder.
The hydrolytic stress degradation studies were carried out using a high precision water bath, magnetic stirrer and hot plate with a temperature controller (Deepali United Mfg. Pvt. Ltd India). The photolytic stress study was carried out in an Atlas SUNTEST XLS+ photo stability chamber (Atlas Material Testing, Illinois, USA). The humidity stress study was carried out in an Espec SH-642 Temperature and Humidity Benchtop Chamber (Advanced Test Equipment Corp., CA, USA). The thermal stress study was carried out in a Memmert hot air oven, model 100–800 (Memmert GmbH + Co. KG, Schwabach, Germany).
Stress degradation studies and sample preparation
Stress studies were carried out on a 500 μg mL−1 solution of CIL as per ICH recommended hydrolysis, oxidation, thermal and photolysis conditions. Concentration of the stressor was initiated with milder concentration followed by a stronger concentration so as to obtain sufficient degradation. As the drug was sparingly soluble in water and freely soluble in acetonitrile (ACN), all the stress samples were prepared in a mixture of ACN and the aqueous stressor (HCl, NaOH, H2O2) at a ratio of 1![[thin space (1/6-em)]](https://www.rsc.org/images/entities/char_2009.gif) :
:![[thin space (1/6-em)]](https://www.rsc.org/images/entities/char_2009.gif) 1% v/v to the final concentration of 500 μg mL−1. The hydrolytic stress degradation study was carried out in 0.1 mol L−1 NaOH and 1 mol L−1 HCl at 60 °C for 4 h and 2 h respectively. Both the acid and base degradation samples were neutralized with NaOH and HCl, respectively. For the oxidative stress degradation, CIL was subjected to 15% (v/v) H2O2 at room temperature for 48 h in the dark. The thermal degradation study was also carried out in the solid state by exposing pure CIL in a petri plate in a very thin layer to dry heat at 80 °C for 5 days. A humid stress study was carried out with 85% RH humidity and 85 °C for 3 days. A photolytic stress study was carried out in the solid state by exposing the pure CIL in a petri plate in a very thin layer to visible light for about 1.2 Million Lux-hours and UV light for about 200 W h m−2. Samples were prepared by filtering the solution through 0.22 μ filter paper prior to HPLC and LCMS analysis.
1% v/v to the final concentration of 500 μg mL−1. The hydrolytic stress degradation study was carried out in 0.1 mol L−1 NaOH and 1 mol L−1 HCl at 60 °C for 4 h and 2 h respectively. Both the acid and base degradation samples were neutralized with NaOH and HCl, respectively. For the oxidative stress degradation, CIL was subjected to 15% (v/v) H2O2 at room temperature for 48 h in the dark. The thermal degradation study was also carried out in the solid state by exposing pure CIL in a petri plate in a very thin layer to dry heat at 80 °C for 5 days. A humid stress study was carried out with 85% RH humidity and 85 °C for 3 days. A photolytic stress study was carried out in the solid state by exposing the pure CIL in a petri plate in a very thin layer to visible light for about 1.2 Million Lux-hours and UV light for about 200 W h m−2. Samples were prepared by filtering the solution through 0.22 μ filter paper prior to HPLC and LCMS analysis.
Isolation and preparation of oxidative degradants, CD1, CD2 and CD3
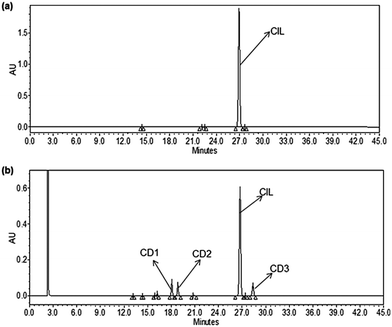
About 1 g of CIL drug substance was dissolved in 250 mL of 15% hydrogen peroxide solution at room temperature for 48 h in the dark, and later studied using HPLC. It was found to contain CD1 with 0.67 RRT, CD2 with 0.71 RRT and CD3 with 1.06 RRT (Fig. 1). Suitable preparative HPLC methods (please refer to the instrumentation section) were developed to separate and isolate CD1, CD2 and CD3 from the residual drug substance and other minor impurities The fractions containing CD1, CD2 and CD3 were evaporated individually to remove the organic solvent and the aqueous portion was lyophilized to obtain the solid material of CD1, CD2 and CD3 respectively.Results and discussion
Optimization of the chromatographic conditions
The selection of mobile phase should be mass compatible so that the developed method could be transferred to mass spectrometry studies with the aim of separating all the degradants from each other and CIL. The method was optimized by varying the different selectivity factors, such as the pH of the mobile phase, the combination and ratios of organic solvents (acetonitrile and methanol), the flow rate, column oven temperature and different columns. During scouting experiments, it was found that Hypersil ODS and Zorbax SB C18 columns were suitable columns to separate all degradants from CIL. The peak shapes of the oxidative degradants were not good in acidic pH (0.1% HCOOH in water); however, the peak shapes of the oxidative degradants were improved by using 10 mM ammonium acetate (pH about 6.8). A combination of organic solvents, acetonitrile![[thin space (1/6-em)]](https://www.rsc.org/images/entities/char_2009.gif) :
:![[thin space (1/6-em)]](https://www.rsc.org/images/entities/char_2009.gif) methanol, (50
methanol, (50![[thin space (1/6-em)]](https://www.rsc.org/images/entities/char_2009.gif) :
:![[thin space (1/6-em)]](https://www.rsc.org/images/entities/char_2009.gif) 50, v/v) was required to obtain better separation of the degradants. Acceptable separation was achieved using a Zorbax SB C18 (250 × 4.6 mm, 5 μm) with mobile phases having components A and B where A was 10 mM ammonium acetate in water while B was acetonitrile
50, v/v) was required to obtain better separation of the degradants. Acceptable separation was achieved using a Zorbax SB C18 (250 × 4.6 mm, 5 μm) with mobile phases having components A and B where A was 10 mM ammonium acetate in water while B was acetonitrile![[thin space (1/6-em)]](https://www.rsc.org/images/entities/char_2009.gif) :
:![[thin space (1/6-em)]](https://www.rsc.org/images/entities/char_2009.gif) methanol, (50
methanol, (50![[thin space (1/6-em)]](https://www.rsc.org/images/entities/char_2009.gif) :
:![[thin space (1/6-em)]](https://www.rsc.org/images/entities/char_2009.gif) 50, v/v) with a flow rate of 1.0 mL min−1 in a linear gradient elution mode. The column oven temperature and injection volume was 50 °C and 10 μL, respectively. A linear flow gradient program was set as follows: (Tmin/% B): 0/40, 3/40, 10/60, 40/80, 41/40 and 45/40. All the stress samples were analyzed using a PDA detector in a scan mode covering a range of 200–400 nm and the final chromatogram was extracted at 240 nm to detect the peaks of all the degradation products. The same method was transferred for LCMSn studies by optimizing all the MS parameters as discussed in the Experimental section. In addition, the HPLC method was transferred to a ultra-performance liquid chromatography (UPLC) for UPLC-Q-TOF-MS/MS studies using a Zorbax SB C18 (100 × 2.1 mm, 1.8 μm) with the same mobile phases (components A and B as mentioned above) and a column oven temperature with a flow rate of 0.25 mL min−1 in a linear gradient elution mode. A linear flow gradient program was set as follows: (Tmin/% B): 0/40, 1/40, 4/60, 15/80, 16/40 and 19/40. The injection volume was 2 μL and the Q-TOF-MS parameters were as discussed in the Experimental section.
50, v/v) with a flow rate of 1.0 mL min−1 in a linear gradient elution mode. The column oven temperature and injection volume was 50 °C and 10 μL, respectively. A linear flow gradient program was set as follows: (Tmin/% B): 0/40, 3/40, 10/60, 40/80, 41/40 and 45/40. All the stress samples were analyzed using a PDA detector in a scan mode covering a range of 200–400 nm and the final chromatogram was extracted at 240 nm to detect the peaks of all the degradation products. The same method was transferred for LCMSn studies by optimizing all the MS parameters as discussed in the Experimental section. In addition, the HPLC method was transferred to a ultra-performance liquid chromatography (UPLC) for UPLC-Q-TOF-MS/MS studies using a Zorbax SB C18 (100 × 2.1 mm, 1.8 μm) with the same mobile phases (components A and B as mentioned above) and a column oven temperature with a flow rate of 0.25 mL min−1 in a linear gradient elution mode. A linear flow gradient program was set as follows: (Tmin/% B): 0/40, 1/40, 4/60, 15/80, 16/40 and 19/40. The injection volume was 2 μL and the Q-TOF-MS parameters were as discussed in the Experimental section.
Degradation behavior of CIL under various stress conditions
The stress degradation behavior of CIL was investigated by using a HPLC-PDA method. These studies show that CIL was stable for humid and thermal conditions, but that it is susceptible to acidic, alkaline, photolytic and oxidative conditions (Table 1). These degradation samples were analyzed using LCMS (ion trap). In order to achieve accurate mass measurements, a mixed sample solution was prepared by mixing the degraded samples and analyzing using UPLC-Q-TOF-MS (Table 2). The acid degradant peak (KD2) was not ionized in LCMS; hence GC-MS analysis was carried out to determine the m/z value of the acid degradant.| Degradation conditions | Name | KD1 | KD2 | KD3 | CD1 | CD2 | KD4 | CD3 | CIL |
|---|---|---|---|---|---|---|---|---|---|
| RRT | 0.24 | 0.31 | 0.59 | 0.67 | 0.71 | 1.03 | 1.06 | 1.0 | |
| Note: ND: not detected, TDA: total detection area. | |||||||||
| Control | % purity by TDA | ND | ND | ND | ND | ND | 0.14 | ND | 99.80 |
| Stressed with 1 mol L−1 HCl at 60 °C for 2 h | ND | 29.29 | ND | ND | ND | 1.10 | 0.59 | 52.69 | |
| Stressed with 0.1 mol L−1 NaOH at 60 °C for 4 h | 3.61 | 7.39 | 11.09 | ND | ND | 0.12 | ND | 76.56 | |
| Stressed with 15% H2O2 at room temperature for 48 h | ND | ND | 0.11 | 7.31 | 6.09 | 0.09 | 7.61 | 77.39 | |
| Thermal at 80 °C for 5 days | ND | ND | ND | ND | ND | 0.22 | ND | 99.70 | |
| Exposed to visible light for about 1.2 million Lux-hours and UV light for about 200 W h m−2 | 0.02 | 0.02 | ND | ND | ND | 18.97 | 0.31 | 80.01 | |
| Humidity 85% RH and 85 °C for 3 days | ND | ND | ND | ND | ND | 0.13 | ND | 99.80 | |
| Name | RRT | Suggested formula | Observed m/z value | Calculated m/z value | Error (mDa) | DBE | Structure |
|---|---|---|---|---|---|---|---|
| a As data generated from GCMS with quadrupole analyzer system. | |||||||
| KD1 | 0.24 | C18H21N2O7+ | 377.1367 [M + H]+ | 377.1349 | 1.8 | 9.5 |

|
| KD2 | 0.31 | C9H10O+˙ | 134 M+˙ | 134 | NAa | 5.0 |

|
| KD3 | 0.59 | C24H23N2O6+ | 435.1570 [M + H]+ | 435.1556 | 1.4 | 14.5 |

|
| CD1 | 0.67 | C27H31N2O10+ | 543.1973 [M + H]+ | 543.1979 | −0.6 | 13.5 | Unknown |
| CD2 | 0.71 | C27H31N2O10+ | 543.1973 [M + H]+ | 543.1979 | −0.6 | 13.5 | Unknown |
| CIL | 1.00 | C27H29N2O7+ | 493.1970 [M + H]+ | 493.1975 | −0.5 | 14.5 |

|
| KD4 | 1.03 | C27H29N2O7+ | 493.1970 [M + H]+ | 493.1975 | −0.5 | 14.5 |

|
| CD3 | 1.06 | C27H27N2O7+ | 491.1822 [M + H]+ | 491.1818 | 0.4 | 15.5 | Unknown |
The drug was degraded under alkaline and acid hydrolytic stress conditions. Overall, the drug forms three DPs (KD1 to KD3) and one DP (KD2) under alkaline and acidic stress conditions respectively. Photolytic stress conditions resulted in one DP (KD4) and three DPs (CD1, CD2 and CD3) were formed under oxidative stress conditions. KD1 to KD4, CD1 to CD3 were studied by HRMS and further the oxidative degradants (CD1 to CD3) were fully characterized by mass fragmentation studies and NMR studies. In addition, the novel structures of CD1 and CD2 are further verified by IR studies and the three dimensional structures of CD1 and CD2 were studied by chiral HPLC and ROESY NMR data.
Mass spectrometric studies on the drug
HRMS spectrum of CIL showed an accurate mass of m/z 493.1970, which had difference of −0.5 mDa with respect to the exact mass of 493.1975 Da (Table 2). High resolution MS2 studies and multistage fragmentation studies (up to MS4 level) were performed, that further strengthen the proposed structure of CIL (Table 3). A molecular ion of m/z 493 fragmented into product ions of m/z 475, 417, 375 and 117 and indicated the presence of the substituents; 2-methoxy ethyl formate, cinnamyl formate and nitrobenzene in CIL. The remaining fragment ions further reinforced the structure of CIL.| HRMS data | MSn data | |||
|---|---|---|---|---|
| Accurate mass | Accurate masses of fragments | Precursor ion | Product ion(s) | |
| [CIL + H]+ | 493.1970 | 475.1837, 417.1492, 375.1214, 317.0787, 301.0831, 117.0698 | 493 | 475, 417, 375, 117 |
| 493 → 417 | 301, 210 | |||
| 493 → 417 → 301 | 255 | |||
| 493 → 375 | 317 | |||
| 493 → 375 → 317 | 271, 226 | |||
| [CD1 + H]+ | 543.1973 | 499.2076, 482.2050, 465.2050, 349.1441, 214.1287, 142.0491, 117.0698 | 543 | 499, 393, 117 |
| 543 → 499 | 482, 465, 405 | |||
| 543 → 499 → 465 | 389, 214 | |||
| 543 → 499 → 465 → 214 | 172, 155 | |||
| 543 → 499 → 405 | 271, 243 | |||
| 543 → 393 | 349, 142 | |||
| 543 → 393 → 349 | 273, 245 | |||
| [CD2 + H]+ | 543.1973 | 525.1940, 481.1988, 427.1336, 393.1334, 349.1359, 200.0932, 133.0681, 117.0698 | 543 | 525, 499, 332, 117 |
| 543 → 525 | 495, 481, 375, 200 | |||
| 543 → 525 → 495 | 302 | |||
| 543 → 525 → 495 → 302 | 244 | |||
| 543 → 525 → 200 | 142 | |||
| 543 → 525 → 375 | 271 | |||
| 543 → 499 | 465, 405 | |||
| 543 → 332 | 133 | |||
| 543 → 332 → 133 | 105 | |||
| [CD3 + H]+ | 491.1822 | 447.1887, 433.1372, 389.1526, 375.1214, 317.0787, 271.0738, 117.0698 | 491 | 447, 433, 389, 375, 117 |
| 491 → 375 | 317 | |||
| 491 → 375 → 317 | 271, 226 | |||
| 491 → 375 → 317 → 226 | 208 | |||
NMR spectroscopic studies on the drug
1H NMR chemical shifts (δ in ppm), coupling constants (J in Hz), 13C NMR chemical shifts (δ in ppm), DEPT information, COSY, HSQC and HMBC connections for CIL are presented in Table 4. 1H and 13C NMR data revealed that CIL contains 28 protons and 27 carbons respectively. DEPT90, DEPT135 and 13C NMR experiments verified that CIL has 3-CH3 (primary), 3-CH2 (secondary), 12-CH (tertiary) and 9-C (quaternary) carbons. The experimentally obtained number of carbons precisely matched with the calculated number of carbons for the proposed chemical structure of CIL. The presence of a 3-bond HMBC connection between H6 → C29 and C30 and H3 → C23 and C27 (Fig. 2) further confirms the chemical structure. In addition, HSQC, HMBC, COSY and TOCSY spectral correlations are in full agreement with the CIL structure (Table 4).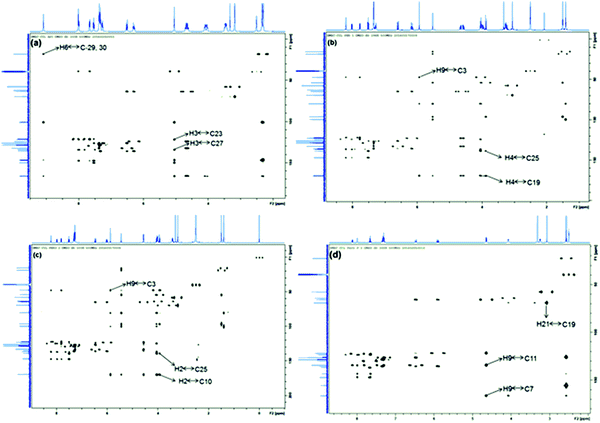 | ||
| Fig. 2 HMBC spectra of CIL (a), CD1 (b), CD2 (c) and CD3 (d) with labeling of significant correlations. | ||
IR studies on the drug
IR spectrum of the drug showed bands for N–H stretching at 3463 cm−1, C–H stretching at 2932 cm−1, C![[double bond, length as m-dash]](https://www.rsc.org/images/entities/char_e001.gif) O stretching at 1698 cm−1, while scissoring, twisting, wagging and rocking vibrations were observed below 1500 cm−1.
O stretching at 1698 cm−1, while scissoring, twisting, wagging and rocking vibrations were observed below 1500 cm−1.
Characterization of the degradation products KD1 to KD4 and CD1 to CD3
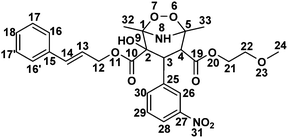
NMR studies conducted to determine the structure; 1H NMR chemical shifts (δ in ppm), coupling constants (J in Hz), 13C NMR chemical shifts (δ in ppm), DEPT information, COSY, HSQC and HMBC connections for CD1 are tabulated in Table 5. 1H and 13C NMR revealed that CD1 contained 30 protons and 27 carbons respectively. DEPT90, DEPT135 and 13C NMR experiments verified that CD1 has 3-CH3 (primary), 3-CH2 (secondary), 13-CH (tertiary) and 8-C (quaternary) carbons. The experimentally obtained number of carbons precisely matched with the calculated number of carbons for the proposed chemical structure of CD1. The 13C NMR values of both CIL and CD1 differ significantly at the C1, C2, C4 and C5 atoms. In addition, C4 (q) has been changed into CH and one OH group has been attached at the C2 carbon in CD1 (Table 5). The data indeed indicates that the dihydropyridine ring is involved during the formation of the degradation product while the substituents viz., 2-methoxy ethyl formate, cinnamyl formate and nitrobenzene were left unchanged. The presence of a 3-bond HMBC connection between H4 → C25, H9 → C3, H4 → C19 (Fig. 2 and Table 5) and 2-bond COSY connection between H4 → H3 of CD1, further confirms the proposed chemical structure. The structure of CD1 was further verified with HSQC, COSY and TOCSY spectra where all the correlations are in full agreement with the proposed structure. Therefore, the above NMR data substantially confirm the proposed chemical structure for CD1 (Table 5). It was characterized as 2-cinnamyl 4-(2-methoxyethyl) 2-hydroxy-1,5-dimethyl-3-(3-nitrophenyl)-6,7-dioxa-8-azabicyclo[3.2.1]octane-2,4-dicarboxylate.
High resolution MS2 studies and multistage fragmentation studies (up to MS5 level) further confirm the proposed structure of CD1 (Table 3). The molecular ion of m/z 543 fragmented into product ions of m/z 499, 393 and 117 and revealed that the substituents; 2-methoxy ethyl formate, cinnamyl formate and nitrobenzene were left unchanged in CD1 against CIL. The precursor ion of m/z 499 further fragmented into 482, 465 and 405 provided evidence for the formation of a hydroxy and peroxy bond at the dihydropyridine ring in CD1 against CIL. The remaining fragment ions further reinforced the structure of CD1.
An IR spectrum of CD1 was compared with CIL to predict major differences in the functional groups. IR spectrum of CIL showed a peak at 1698 cm−1 corresponding to a conjugated ester group which is absent in CD1. In addition, CD1 showed a peak at 1733 cm−1 which corresponds to an aliphatic non conjugated ester group. Moreover CD1 showed a broad peak in the 3500 cm−1 region, which indicated the presence of an OH group, this evidence indicated the involvement of a dihydropyridine group in the reaction, resulting in CD1. This further verifies the confirmed chemical structures of these degradants by mass and NMR.
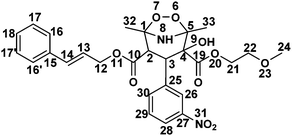
1H NMR chemical shifts (δ in ppm), coupling constants (J in Hz), 13C NMR chemical shifts (δ in ppm), DEPT information, COSY, HSQC and HMBC connections for CD2 were tabulated in Table 6. 1H and 13C NMR data revealed that CD2 contained 30 protons and 27 carbons respectively. DEPT90, DEPT135 and 13C NMR experiments verified that CD2 has 3-CH3 (primary), 3-CH2 (secondary), 13-CH (tertiary) and 8-C (quaternary) carbons. The experimentally obtained number of carbons precisely matched with the calculated number of carbons for the proposed chemical structure of CD2. The 13C NMR values of both CIL and CD2 differ significantly at the C1, C2, C4 and C5 atoms. In addition, C2 (q) has been changed into CH and one OH group has been attached at the C4 carbon in CD2 (Table 6). These data indeed indicate that the dihydropyridine ring is involved during the formation of the degradation product while the substituents viz., 2-methoxy ethyl formate, cinnamyl formate and nitrobenzene were left unchanged (Table 6). The presence of a 3-bond HMBC connection between H2 → C25, H9 → C3, H2 → C10 as shown in Fig. 2 and 2-bond COSY connection between H2 → H3 of CD2, further confirms the proposed chemical structure. The structure of CD2 was further verified with HSQC, COSY and TOCSY spectra, where all the correlations are in full agreement with the proposed structure. Therefore, the above NMR data substantially confirm the proposed chemical structure for CD2 as shown in Fig. 2. It was characterized as 4-cinnamyl 2-(2-methoxyethyl) 2-hydroxy-1,5-dimethyl-3-(3-nitrophenyl)-6,7-dioxa-8-azabicyclo[3.2.1]octane-2,4-dicarboxylate.
High resolution MS2 studies and multistage fragmentation studies data (up to MS5 level) further strengthen the proposed structure of CD2 (Table 3). The molecular ion of m/z 543 fragmented into product ions of m/z 525, 499, 332 and 117 and revealed that the substituents; 2-methoxy ethyl formate, cinnamyl formate and nitrobenzene were left unchanged in CD2 against CIL. The precursor ion of m/z 525 further fragmented into 495, 481, 375 and 200, providing evidence for the formation of a hydroxy and peroxy bond at the dihydropyridine ring in CD2 against CIL. The rest of the fragment ions further supported the structure of CD2.
An IR spectrum of CD2 was compared with CIL to predict the major differences in the functional groups. An IR spectrum of CIL showed a peak at 1698 cm−1 corresponding to a conjugated ester group which is absent in CD2. In addition, CD2 showed a peak at 1730 cm−1 which corresponds to an aliphatic non conjugated ester group, Moreover, CD2 showed a broad peak in the 3500 cm−1 region which indicated the presence of a OH group, this evidence indicated the involvement of a dihydropyridine group in the reaction, resulting in CD2. This further verifies the confirmed chemical structures of these degradants by mass and NMR.
1H NMR chemical shifts (δ in ppm), coupling constants (J in Hz), 13C NMR chemical shifts (δ in ppm), DEPT information, COSY, HSQC and HMBC connections for CD3 are tabulated in Table 7. 1H and 13C NMR data revealed that CD3 contained 26 protons and 27 carbons respectively. DEPT90, DEPT135 and 13C NMR experiments verified that CD3 has 3-CH3 (primary), 3-CH2 (secondary), 11-CH (tertiary) and 10-C (quaternary) carbons. The 13C NMR values of both CIL and CD3 differ significantly at the C3 atom. In addition, the loss of two hydrogens indicates that the dihydropyridine ring is involved during the formation of CD3 while the substituents viz., 2-methoxy ethyl formate, cinnamyl formate and nitrobenzene were left unchanged (Table 7). The experimentally obtained number of carbons precisely matched with the calculated number of carbons for the proposed chemical structure of CD3. The presence of a 3-bond HMBC connection between H23 → C3 and H27 → C3 further confirms the proposed chemical structure. The structure of CD3 was confirmed using HSQC, HMBC, COSY and TOCSY spectra, where all the correlations are in full agreement with the structure. 1H NMR chemical shifts (δ in ppm), coupling constants (J in Hz), 13C NMR chemical shifts (δ in ppm), COSY, HSQC and HMBC connections for CIL are tabulated in Table 7. It was characterized as 3-cinnamyl 5-(2-methoxyethyl) 2,6-dimethyl-4-(3-nitrophenyl)pyridine-3,5-dicarboxylate. The resulting structure of CD3 was previously reported as a photolytic degradation product of the drug4 and a metabolite of the drug.20
High resolution MS2 studies and multistage fragmentation studies data (up to MS5 level) further strengthen the proposed structure of CD3 (Table 3). The molecular ion of m/z 491 fragmented into product ions of m/z 447, 433, 389, 375 and 117, and revealed that the substituents; 2-methoxy ethyl formate, cinnamyl formate and nitrobenzene were left unchanged in CD3 against CIL. The remaining fragment ions further reinforced the structure of CD3.
Three dimensional structure evaluation for CD1 and CD2
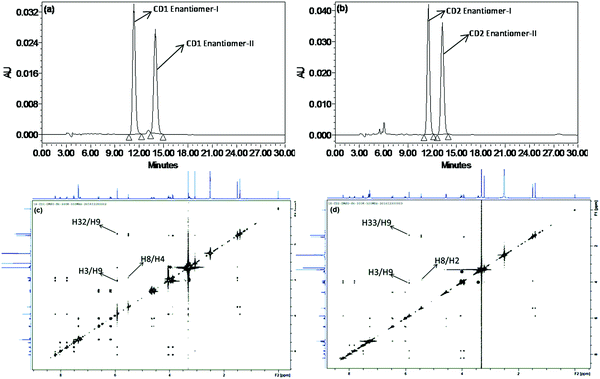 | ||
| Fig. 3 Chiral HPLC chromatograms of CD1 (a), CD2 (b) and ROESY NMR spectra of CD1 (c) and CD2 (d) with labeling of significant correlations. | ||
Proposed reaction mechanism for CD1, CD2 and CD3
The proposed mechanism for CD1 involves the following steps as shown in Fig. 5. The carbon atoms C1 and C4 are electrophilic and undergo attack by a nucleophile, for example hydroperoxide anion (HOO−).21,22 In the first step, an epoxide is formed from the first peroxide molecule at the C1![[double bond, length as m-dash]](https://www.rsc.org/images/entities/char_e001.gif) C2 double bond. In the second step, a nucleophilic attack of the hydroperoxide anion at the C5 carbon atom followed by the proton transfer produces the intermediate. In the third step, an intramolecular nucleophilic attack at the electrophilic carbon to open the epoxide is followed by hydrolysis that produces the degradant CD1. The mechanism for the formation of CD2 is also similar where the epoxide is formed initially at C4
C2 double bond. In the second step, a nucleophilic attack of the hydroperoxide anion at the C5 carbon atom followed by the proton transfer produces the intermediate. In the third step, an intramolecular nucleophilic attack at the electrophilic carbon to open the epoxide is followed by hydrolysis that produces the degradant CD1. The mechanism for the formation of CD2 is also similar where the epoxide is formed initially at C4![[double bond, length as m-dash]](https://www.rsc.org/images/entities/char_e001.gif) C5.
C5.
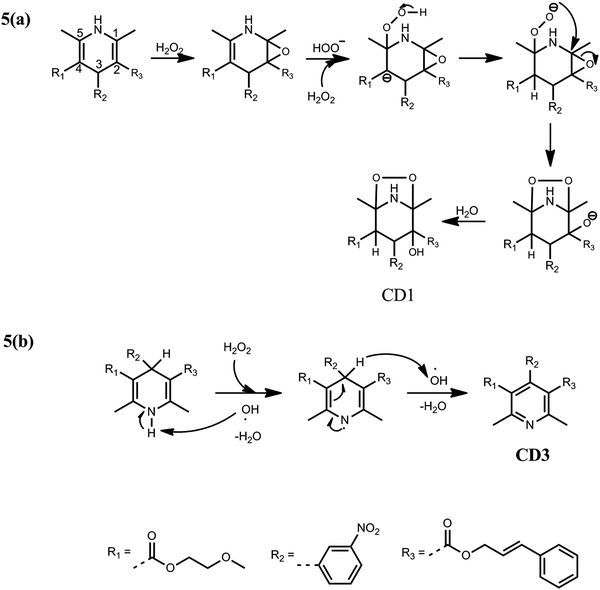 | ||
| Fig. 5 (a) Proposed mechanism for the formation of CD1. (b) Proposed mechanism for the formation of CD3 from CIL during the peroxide degradation reaction. | ||
The formation of CD3 involves the radical mechanism as shown in Fig. 5, in which the hydroxyl radical initiates the reaction by abstraction of the radical hydrogen from the nitrogen atom N6 of 1,4-dihydropyridine, producing the intermediate. In the second step, this undergoes aromatization to produce a pyridine ring through the abstraction of a second radical hydrogen from the C3 carbon atom by the second hydroxyl radical.
Conclusion
The degradation behavior of CIL under acidic, alkaline, oxidative, photolytic, humid and thermal stress conditions was studied as per ICH guidelines. The developed liquid chromatographic method separated all the DPs from the main drug CIL. A total of 7 DPs were identified by HRMS. Of these, three oxidative unknown DPs (CD1 to CD3) were isolated and their structures were characterized unambiguously using high resolution and multistage mass fragmentation studies, and multidimensional nuclear magnetic resonance. The resulting structure of CD3 was previously reported as a metabolite of CIL. The other two degradants CD1 and CD2 were determined as novel structures and were not reported by any publishers until recently. The novel oxidative degradation products (CD1 and CD2) may be useful for drug discovery activities. The 3D structures for CD1 and CD2 were established by chiral HPLC and ROESY NMR. The proposed structures of DPs have been rationalized by appropriate mechanisms.Conflicts of interest
There are no conflicts to declare.Acknowledgements
The authors are very much thankful to KL University management and the management of United States Pharmacopeial Convention for facilities and their immense support in publishing this work.References
- A. Akahara, H. Uchida, T. Konda, H. Dohmoto, R. Yoshimoto, M. Komori, T. Morioka, I. Ono, Y. Takata and H. Kato, Antihypertensive effects of repeated oral administration of cilnidipine, a novel calcium antagonist, in 2K1C renal hypertensive dogs, Folia Pharmacol. Jpn., 1995, 106, 279–287 CrossRef.
- B. P. Ritesh, P. C. Vinayak, C. S. Sohan and W. B. Sager, Development and validation of HPLC method for simultaneous estimation of Cilnidipine and Valsartan in bulk and tablet dosage form, Int. J. Pharm. Chem. Anal., 2015, 2, 102–107 Search PubMed.
- C. Ishijima, T. Nishiwaki, K. Hirayama, Y. Irie, S. Inazuka, D. Watanab, T. Fukutani, M. Ozaki, H. Ikawa and H. Mizutani, Chemical structure and physicochemical properties of 2-methoxyethyl (E)-3-phenyl-2-propen-1-yl (±)-1,4-dihydro-2,6-dimethyl-4-(3-nitrophenyl)pyridine-3,5-dicarboxylate (FRC-8653), Iyakuhin Kenkyu, 1992, 23, 547–557 CAS.
- Z. Hongxia, W. Fan, Z. Bingqi, Z. Weihui, S. Weiguang and W. Jian, Study of the structures of photo degradation impurities and pathways of photo degradation of cilnidipine by liquid chromatography/Q-Orbitrap mass spectrometry, Rapid Commun. Mass Spectrom., 2016, 30, 1771–1778 CrossRef PubMed.
- R. H. Reema and J. S. Hitendra, Stability indicating simultaneous validation oftelmisartan and cilnidipine with forced degradation behavior study by RP-HPLC in tablet dosage form, ISRN Chromatogr., 2013, 461461 Search PubMed.
- K. K. Tushar, B. S. Darshil and G. M. Dilip, Development and validation of q-absorbance ratio spectrophotometric method for simultaneous estimation of cilnidipine and metoprolol succinate in bulk and combined dosage form, Int. J. Pharm. Pharm. Sci., 2014, 6, 401–407 Search PubMed.
- B. V. Farhana, J. Vineet and R. Hasumati, A Review: Analytical Methods for Determination of Cilnidipine in Biological Fluid and Pharmaceutical Dosage Forms, PharmaTutor Mag., 2014, 2, 22–29 Search PubMed.
- ICH, Impurities in new drug substances Q3A (R2), in International Conference on Harmonisation, IFPMA, Geneva (Switzerland), 2006.
- S. Saranjit, H. Tarun, N. Mallikarjun, S. Archana, J. Mahendra and S. P. Ravi, A critical review on the use of modern sophisticated hyphenated tools in the characterization of impurities and degradation products, J. Pharm. Biomed. Anal., 2012, 69, 148–173 CrossRef PubMed.
- A. Awasthi, M. Razzak, R. AI-Kassas, D. R. Greenwood, J. Harvey and S. Garg, Isolation and characterization of degradation products of moxidectin using LC, LTQ FT-MS, H/D exchange and NMR, Anal. Bioanal. Chem., 2012, 8, 2203–2222 CrossRef PubMed.
- R. Rapolu, A. K. Pandey, Ch. K. Raju, K. Ghosh, K. Srinivas, A. Awasthi, G. N. Sameer and K. V. Surendranath, A novel UV degradation product of ebastine: isolation and characterization using Q-TOF, NMR, IR and computational chemistry, J. Pharm. Biomed. Anal., 2015, 107, 488–494 CrossRef CAS PubMed.
- N. R. Ramisetti and R. Kuntamukkalaa, LC-MS/MS characterization of forced degradation products of ambrisentan: development and validation of a stability-indicating RP-HPLC method, New J. Chem., 2014, 38, 3050–3061 RSC.
- S. K. Pravinchandra, M. Kurmi, S. Kumara and S. Singh, Forced degradation of lafutidine and characterization of its non-volatile and volatile degradation products using LC-MS/TOF, LC-MSn and HS-GC-MS, New J. Chem., 2015, 39, 9679–9692 RSC.
- P. D. Kalariya, P. N. Patel, R. Srinivasab and M. V. N. K. Talluri, Quality by design based development of a selective stability-indicating UPLC method of dolutegravir and characterization of its degradation products by UPLC-QTOF-MS/MS, New J. Chem., 2015, 39, 6303–6314 RSC.
- R. R. Ernst, G. Bodenhausen and A. Wokaun, Principles of nuclear magnetic resonance in one and two dimensions, Clarendon, Oxford, 1987 Search PubMed.
- A. Bax and G. Davies, MLEV-17 based two-dimensional homonuclear magnetization transfer spectroscopy, J. Magn. Reson., 1985, 65, 355–360 CAS.
- A. Bax, M. Ikura, L. E. Kay, D. A. Torchia and R. Tschudin, Comparison of different modes of two-dimensional reverse correlation NMR for the study of proteins, J. Magn. Reson., 1991, 86, 304–318 Search PubMed.
- A. Bax and M. F. Summers, 1H and 13C assignments from sensitivity enhanced detection of heteronuclear multiple-bond connectivity by two-dimensional multiple quantum NMR, J. Am. Chem. Soc., 1986, 108, 2093–2094 CrossRef CAS.
- D. J. States, R. A. Haberkorn and D. J. Ruben, A two-dimensional nuclear Overhauserexperiment with pure absorption phase in four quadrants, J. Magn. Reson., 1982, 48, 286–292 CAS.
- L. Xiao-Quan, Z. Yang, L. Dan, Q. Zhi-Yu and W. Guang-Ji, Metabolism and metabolic inhibition of cilnidipine in human liver microsomes, Acta Pharmacol. Sin., 2003, 24(3), 263–268 Search PubMed.
- S. A. Shumakov, V. A. Kaminskii and M. N. Tilichenko, Chem. Heterocycl. Compd., 1985, 21, 72 CrossRef.
- J. C. Day, J. Org. Chem., 1978, 43, 3646 CrossRef CAS.
Footnote |
| † Electronic supplementary information (ESI) available. See DOI: 10.1039/c7nj02781h |
| This journal is © The Royal Society of Chemistry and the Centre National de la Recherche Scientifique 2018 |

