 Open Access Article
Creative Commons Attribution 3.0 Unported Licence
Improving analyte selectivity by post-assembly modification of metal–organic framework based photonic crystal sensors†
A.
von Mankowski
abc,
K.
Szendrei-Temesi
abc,
C.
Koschnick
abc and
B. V.
Lotsch
 *abc
*abc
aDepartment of Chemistry, University of Munich (LMU), Butenandtstraße 5-13, 81377 Munich, Germany
bMax Planck Institute for Solid State Research, Heisenbergstraße 1, 70569 Stuttgart, Germany. E-mail: b.lotsch@fkf.mpg.de
cNanosystem Initiative Munich (NIM) and Center for Nanoscience (CeNS), Schellingstraße 4, 80799 Munich, Germany
First published on 16th March 2018
Abstract
The porous nature and structural diversity of metal–organic frameworks (MOFs) provide a versatile platform for specific and selective sorption behavior. When integrated as functional layers into photonic crystals (PCs), loading of the porous network with organic solvent vapors translates into an optical response, allowing analyte discrimination according to the specific host–guest interactions and, hence, framework affinity to the analytes. However, the optical response of PCs is critically influenced by the overall PC architecture, leading to batch-to-batch variations, thus rendering unequivocal analyte assignment challenging. To circumvent these problems, we have developed a straightforward and mild “post-assembly” modification strategy to impart differences in chemical selectivity to the MOF layers whilst keeping the overall PC backbone constant. To this end, one-dimensional photonic crystal (1D PC) sensors based on CAU-1 and TiO2 layers were fabricated to obtain a generic platform for post-assembly modification, targeting either the secondary building unit (SBU) or the linker unit of the as-assembled MOF nanoparticle layers. The optical response to solvent vapor exposure was investigated with the pristine CAU-1 based sensor as well as its modifications, showing enhanced analyte selectivity for the post-modified systems.
Conceptual insightsThe development of integrated nanoscale sensing systems imposes high demands on the materials employed, including chemical versatility, stability and flexibility. The intrinsic porosity, functional diversity and tunability of metal–organic frameworks (MOFs) make them interesting components for integrated sensing systems. In addition, post-synthetic modification of MOFs is a powerful tool enabling judicious property tuning at the molecular level. However, when integrated in sensing devices, MOFs have to be selected and modified prior to the system assembly, thus requiring careful planning at the stage of material synthesis. Here, we develop a novel strategy demonstrating that MOFs can be modified post device fabrication by a mild post-assembly modification route. For this purpose, a generic one-dimensional photonic crystal sensor platform based on amine-bearing CAU-1 as active layer was fabricated. We demonstrate that post-assembly modification of either the metal-oxo clusters of CAU-1 or covalent modification of the organic linkers allows for the fine-tuning of the chemical selectivity and, hence, optical response to volatile organic analytes. The generic post-assembly modification demonstrated herein opens the door to the scalable production of MOF-based photonic crystal sensors with identical backbones, but gradually tunable analyte selectivities. |
Introduction
Since metal–organic frameworks – a versatile class of crystalline organic–inorganic hybrid materials featuring permanent intrinsic porosity – have come of age, the research focus has shifted from structural considerations towards the many fascinating properties enshrined in the manifold framework architectures.1–3 In particular, the inherent micro- and mesoporosity of MOFs provide a unique platform for exploiting specific host–guest interactions, which are defined by the pore size and accessibility, as well as the surface chemistry, polarity and functionality. Post-synthetic methods such as covalent and coordinative modification, deprotection, solvent-assisted ligand exchange or insertion provide further possibilities to precisely engineer the framework according to the desired applications.4–6 These applications range from catalysis,7 gas separation and storage,8 to drug delivery, electrochemistry9 and chemical sensing,10 among many others, where post-synthetic treatment can lead to a significant improvement of the material performance.11–13 When it comes to sensing applications, the stimuli-responsive material is required to exhibit a property change upon analyte exposure that can be measured as a sensing signal. In general, easy and fast detection of the sensing event is desired. Here, optical sensors have been proven to be both sensitive and selective.10,14 Signal transduction can be based on simple solvo- and vapochromism, luminescent based mechanisms, thin film Fabry–Pérot interference, as well as photonic crystal (PC) sensor based approaches, the latter comprising nanoscale architectures that can be used to guide and confine light.14–17 PCs are periodic dielectric structures, the hallmark of which is the photonic band gap (PBG) corresponding to the frequency range in which the propagation of light is forbidden and photons within this energy range are thus reflected by the PC.18 For PCs exhibiting periodicity in one dimension – so called Bragg stacks (BSs) – the diffraction maximum λmax at normal incidence is given by| mλmax = 2(nlhl + nhhh) | (1) |
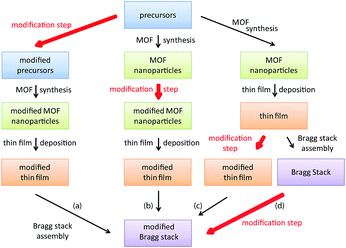
To tackle these issues, we present a facile route for the fabrication of a generic MOF based BS sensing platform that can be chemically modified after the sensor assembly to enhance analyte selectivity, ensure signal reproducibility and guarantee comparability of the optical signals. BS fabrication via spin-coating is generally performed by alternately spin-coating two nanoparticle suspensions until the desired amount of layers is reached. To tune analyte selectivity in MOF based PC sensors, a post-synthetic modification step can be performed at different stages during BS fabrication as outlined in Scheme 1. Introduction of chemically different groups prior to MOF synthesis (path (a) – precursor modification) usually requires modification of the MOF synthesis conditions, whereas path (b) – post-synthetic modification of the MOF nanoparticles – may require changes in the spin- (dip-, spray) coating conditions, such as solvent or concentration changes of the MOF nanoparticle suspension. For path (c), modification of every deposited MOF layer separately implies unnecessary repetition steps, rendering the post-assembly path (d) the most convenient and efficient strategy. Furthermore, by fabricating a generic BS platform first, followed by post-assembly modification of the MOF, differences in layer porosity or thicknesses of the different MOF BS sensors are kept to a minimum, thus allowing better comparability of the individual BSs.
Here, we fabricate a generic MOF BS sensor platform based on pristine and modified CAU-1 by following the above described post-assembly strategy. High RI TiO2 nanoparticle layers are used to provide the optical contrast. We deliberately chose CAU-1, Al4(OH)2(OCH3)4(BDC-NH2)3, which is composed of aluminum-hydroxy/methoxy secondary building units (SBUs) linked by 2-aminoterephthalates (Scheme 2(b)).30 Two distinct post-synthethic modifications are possible for this system, one targeting the SBU (coordinative modification) and another the organic linker.31Scheme 2 depicts the procedure, in which the methanolates were replaced by hydroxy groups (CAU-1-SBU) or an amidification of the linker with hexanoic acid took place (CAU-1-Hex). The procedures were first tested on nanoparticles and subsequently applied to the as-assembled BSs. Both modifications turned out to be effective in significantly enhancing the analyte discrimination capability of the MOF based PC sensors. In addition, modification of the as-assembled PCs allows for the direct comparison of the optical responses, thus marking the next step in the development of custom-made optical MOF sensors.
Results and discussion
Particle characterization
In the first step, the MOF modification procedures to be applied on the BSs were tested on nanoparticle suspensions of CAU-1 to assess the viability of the synthetic procedure and to investigate the properties of the modified MOFs at the bulk level. The focus of this preliminary investigation was to confirm that the synthetic conditions applied maintain the structural integrity of the framework and nanoparticles and guarantee a high reaction yield, in particular for the covalent modification. The latter was done via a mild approach with hexanoic acid anhydride to avoid decomposition of the MOF. Furthermore, a sorption study using water vapor was performed to characterize the sorption behavior towards hydrophilic analytes and the influence of post-synthetic modification on the sorption properties.Dynamic light scattering (DLS) of the suspensions attested similar average particle sizes of 45–52 nm for the pristine and modified MOF nanoparticles, indicating that the covalent modification procedure preserved the particle size distribution and aggregation state (Fig. S1, ESI†). For the TiO2 nanoparticles used for spin-coating, an average size of 27 nm was determined, indicating the suitability of both nanoparticle suspensions to cast them into highly porous thin films. PXRD measurements on the dried particles further establish the structural integrity of the CAU-1 particles after post-synthetic modification (Fig. S2, ESI†).
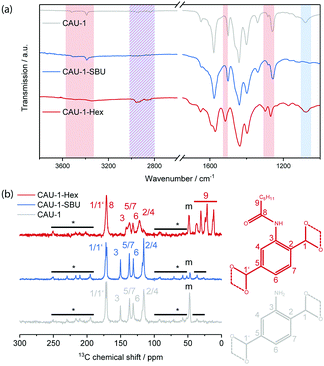
To characterize the chemical modifications, IR and 13C-NMR spectra were recorded (Fig. 1). In the IR spectrum of CAU-1-SBU, the alkyl related vibrations at 3000–2800 and ≈1078 cm−1 disappear completely, suggesting the quantitative de-methoxylation of the SBU. For the amidification (CAU-1-Hex), the free amine related bands at 3390 and 3521 cm−1 disappear and those at 1340 and 1261 cm−1 shift to 1299 and 1269 cm−1, respectively. Considering the aromatic ring related band, a shift from 1500 to 1517 cm−1 can be observed and the alkyl related bands between 2000–1800 cm−1 become more pronounced, indicating a high degree of modification. The corresponding IR spectra of thin films, in which the modification procedure was applied and confirmed, can be found in Fig. S3 (ESI†). The 13C CP-ssNMR reveals identical linker related signals for CAU-1-SBU and the pristine MOF. Only the methanolate related signal (48 ppm) shows a significant drop in intensity, signalling the almost quantitative de-methoxylation of CAU-1-SBU. For the amidification, the carbon signals 2–5 (150–110 ppm) are shifted and the alkyl-related signals appear at 40–10 ppm, attesting the successful covalent modification of the linker. In both cases, the relevant carbon signal shifts and intensity drops support the IR data and indicate a high degree of modification. In case of 15N-NMR, the only nitrogen related signal shifts clearly from −320 ppm in the pristine CAU-1 to −252 ppm for the covalent modification, whereas for the de-methoxylation no change is observed (Fig. S4, ESI†).
Digestion of the MOF and subsequent NMR analysis (Fig. S5, ESI†) revealed a degree of modification for CAU-1-SBU of 99% and for CAU-1-Hex of 84%. Elemental analysis yielded similar degrees of modification of 96% for CAU-1-SBU and 88.5% for CAU-1-Hex (Table S1, ESI†).
The porosity of the nanoparticles was assessed by argon physisorption (Fig. 2(a)). The microporosity of all samples is reflected by a considerable gas uptake at very low partial pressures, for which CAU-1-SBU shows the highest adsorbed volume (310 cm3 g−1@p/p0 = 0.1), closely followed by CAU-1 (290 cm3 g−1), while CAU-1-Hex shows the lowest uptake (110 cm3 g−1). As expected, BET analysis yields decreasing apparent surface areas of 1099, 1019 and 406 m2 g−1, respectively. In addition, the large hysteresis at higher partial pressures accounts for the textural mesopores due to the nanoparticulate nature of the powder (Fig. S6, ESI†), which by far exceeds the uptake of the micropores (800 cm3 g−1, 700 cm3 g−1 and 650 cm3 g−1, respectively). Furthermore, water vapor sorption was performed, showing again decreasing uptake from the de-methoxylated to the hexanoylated CAU-1 (Fig. 2(b)). While the isotherms for CAU-1-SBU and the pristine compound exhibit a sigmoidal shape with a moderate hysteresis loop at 0.2–0.3 p/p0 as well as increasing uptake above 0.7 p/p0 attributed to water adsorption into the textural pores, CAU-1-Hex shows a flattened and almost linear isotherm with low water uptake (174 cm3 g−1) compared to the other samples (1148 cm3 g−1 and 1040 cm3 g−1). The hydrophobic behavior of CAU-1-Hex is also reflected in the decreased amount of adsorbed water after desorption (30 cm3 g−1vs. 86 and 74 cm3 g−1). The shapes and values of the sorption isotherms provide striking evidence for the increasing hydrophobicity introduced by the covalent PSM, altering both the intrinsic and textural sorption behavior of the framework. For the SBU modification, the changes are comparably small, but still an increased uptake of both argon and water is observed. Interestingly, the textural porosity contributes considerably to the total uptake of all samples. As a consequence, the water isotherm of CAU-1-Hex demonstrates the significant impact of the modification not only on the intrinsic porosity of the MOF, but on the textural porosity as well. Even if the particles are packed more densely in a BS fabricated by spin-coating, it is reasonable to assume a similar impact of the textural porosity in the MOF layers of the BSs. The increasing hydrophilicity of CAU-1-Hex over CAU-1 to CAU-1-SBU was further confirmed by contact angle measurements on the corresponding thin films (Fig. S7, ESI†).
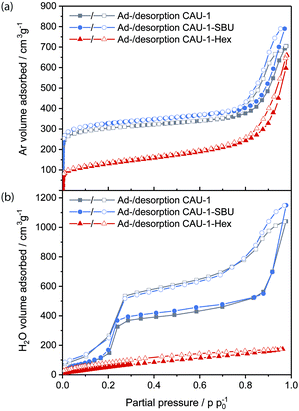 | ||
| Fig. 2 (a) Argon and (b) water vapor ad- and desorption isotherms of CAU-1-SBU (red), CAU-1 (grey) and CAU-1-Hex (blue). | ||
Bragg stack characterization and optical measurements
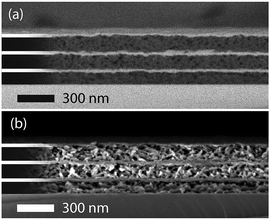
BSs were stacked alternatingly with nanoparticles of CAU-1 and the high-RI material TiO2 to form multilayer structures composed of 3 bilayers and modified according to path d, Scheme 1 and as described in Scheme 2. While similar thicknesses of the active MOF layers ensure that the sensitivities of the different sensors can be compared, layers of the optical contrast material TiO2 were kept thin to minimize the impact of the textural porosity of TiO2 on the sorption properties. The layer thicknesses and homogeneity of a representative generic BS sample was studied by scanning electron microscopy (SEM) cross-section images (Fig. 3). The images confirm the homogenous periodic structure of the PCs in which the nanocrystalline TiO2 particles are packed densely into thin layers while the thicker layers of rice-grain shaped CAU-1 are interspersed with an irregular pore network, which is able to accommodate guest molecules. The CAU-1 layer appears darker in the back-scattered SEM image due to the lower average atomic number of the MOF nanoparticles compared to TiO2. Furthermore, the secondary electron image contrasts the rice-grain shaped morphology of CAU-1 with the dense nanoparticulate appearance of TiO2 and confirms the successful combination of the two materials as well as the long-range stacking order with well-defined interfaces as seen in the back-scattered SEM image. The images show thick, homogeneous MOF layers with an average thickness of 120 ± 10 nm that alternate with layers of TiO2 having thicknesses of 32 ± 5 nm giving rise to a periodic structure with defined interfaces and a total thickness of approximately 420 nm. The structural integrity of the modified BSs was confirmed by additional cross-sectional SEM images (Fig. S8 and S9, ESI†). In addition, GISAXS measurements show that the crystallinity of the framework is retained (Fig. S10, ESI†). Furthermore, digestion and subsequent NMR analysis of the modified MOF layers revealed modification degrees of 100% for CAU-1-SBU and 88% for CAU-1-Hex (Fig. S11, ESI†), which are similar to the bulk values.As discussed above, the PBG shift in a BS caused by an uptake of guest molecules will largely depend on the amount of analyte adsorbed and the adsorbate's RIs. Hence, for complete pore filling for every analyte, the expected shifts should solely depend on its RI. In reality, the amount of analyte adsorbed by the BS will depend on many other factors such as analyte size, pore accessibility and host–guest interactions, i.e. the chemical affinity of the analyte to the constituent layers, which due to its high surface area will largely be defined by the MOF acting as the active BS layer.
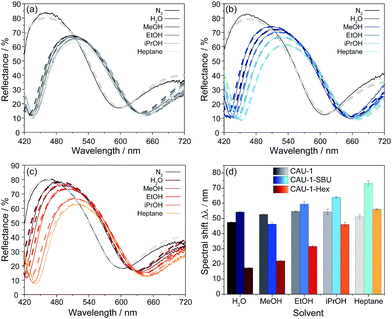
To investigate the sensing performance of the CAU-1 based BS and its modifications, the optical responses to the solvent vapors of water, the alcohols methanol, ethanol, and iso-propanol, as well as n-heptane in a nitrogen carrier stream were monitored and repeated three times. The spectral shifts were determined as the absolute optical shifts of the reflectance maxima (Bragg peak) during solvent vapor exposure compared to that of the pure nitrogen stream. In Fig. 4(a–c), exemplary reflectance spectra are shown for each solvent for the three investigated BSs, while the corresponding shifts are summarized in Fig. 4(d), sorted by decreasing polarity of the MOF and solvent. Solvent polarities and RIs are provided in Table S2 (ESI†), the complete set of spectra that confirm the reproducibility of the measurements are given in Fig. S12–S14 (ESI†). The results show overall shifts in the range from 17 to 73 nm, in which CAU-1-SBU shows the largest, CAU-1 intermediate and CAU-1-Hex the lowest shifts. For the unmodified BS with pristine CAU-1, water gives the lowest shift (48 nm) in spite of the lower RI of methanol, which is likely caused by the more efficient interaction of the methoxy-groups of the SBU with the smallest alcohol as compared to water. For the higher alcohols and n-heptane, the measured shifts are slightly increased but still very similar and barely allow a reliable distinction between these analytes. On the contrary, the results clearly show that the modifications nicely address this problem: CAU-1-SBU shows gradually increased shifts along the series methanol, water, ethanol, iso-propanol and heptane which is in accordance with the RI trend of the solvents. We attribute the increased shift seen in CAU-1-SBU for water compared to methanol to the now improved possibility to form hydrogen bonds with the SBU and the overall increased pore accessibility, an effect that seems to dominate in case of the larger analytes. The opposite effect is observed for the CAU-1-Hex modification: here, the water uptake is marginal and probably related to the TiO2 layers, as expected from the sorption isotherms of the CAU-1-Hex powder. While water and the small polar alcohols show only slight shifts, iso-propanol and n-heptane show intermediate shifts; from these observations, a correlation between analyte size and the accessible pore volume on the one hand, and analyte polarity on the other hand can be derived. Accordingly, n-heptane exhibits a slightly increased shift for CAU-1-Hex compared to pristine CAU-1. We attribute this slightly increased adsorption capability of CAU-1-Hex primarily to the more beneficial hydrophobic interactions between the hydrocarbon chain and CAU-1-Hex. We would like to emphasize at this point that in all three cases, the factors mentioned – RI, size and polarity of the analytes – define the optical response. However, disentangling the relative influence of each of these factors is difficult. Nevertheless, it is clear from these data that the altered pore environments of both post-assembly modifications allow for a more reliable distinction of the investigated analytes, whereas for the pristine BS, signal assignment is ambiguous.
To gain further insights into the origin of the observed optical changes for the three BSs upon solvent adsorption, we have carried out calculations of the reflectance spectra using a Matlab code32 based on the transfer matrix method (details in the experimental section, ESI†). For our model, we estimated the layer thicknesses from the SEM measurements and the RIs of the unloaded MOF layers from spectroscopic ellipsometry measurements (Table S3, ESI†). All spectra were modeled with constant layer thicknesses and provide evidence that no pronounced swelling upon analyte adsorption occurs. The RIs of the layers for all calculations are provided in Table S4 (ESI†). The modeled spectra are depicted in Fig. 4(a–c) as dashed lines in the color shades corresponding to the experimental spectra and show excellent agreement with the measured spectra. The different analytes have clearly different impacts on the RIs of the CAU-1 layers. The larger changes of the (non-)modified CAU-1 layers compared to the TiO2 layers upon adsorbing different analytes is also reflected by the larger changes seen for the blue stopband edge, which mainly corresponds to changes in the low RI material, CAU-1. While CAU-1 exhibits similar intermediate changes in the effective RI (Δneff = 0.185Water − 0.210EtOH/iPrOH/Heptane), the changes modeled for CAU-1-SBU (Δneff = 0.140MeOH − 0.255Heptane) and CAU-1-Hex (Δneff = 0.080Water − 0.220Heptane) extend over a broader range. In all samples the differences of the RIs are in line with the observed spectral shifts. The large RI differences in CAU-1-SBU and -Hex confirm the enhanced discrimination capacity of the modified samples. In contrast to the MOF layers, the RI changes for TiO2 (Δneff = 0.090Heptane − 0.105Water (CAU-1-SBU); 0.060Heptane − 0.100EtOH (CAU-1); 0.060Heptane − 0.100EtOH (CAU-1-Hex)) are overall smaller and more similar for all three BSs as also indicated by the barely visible red stopband shift in the reflectance spectra. These observations underline that the CAU-1 layers primarily act as the active layer materials and are mainly responsible for the discrimination of the analytes.
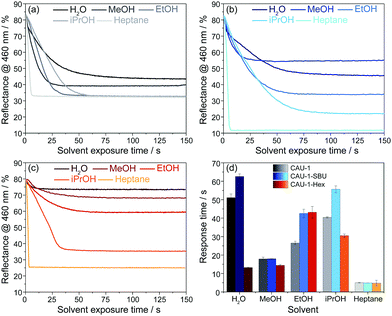
Even though for the BS made of pristine CAU-1 the spectra do not provide sufficiently distinct optical shifts for unequivocal analyte assignment, the vapour response kinetics is another key observable that may allow the differentiation of water, the alcohols and heptane. To study the vapour response kinetics, we monitored the reflectance intensity changes at 460 nm of all samples. At this wavelength, the samples undergo the largest intensity drop due to the stopband shifts upon vapor exposure, and, at the same time, this wavelength range is characteristic for the blue band edge of the PBG and represents the changes of the (modified) CAU-1 layers, as mentioned above. From these kinetic plots, the response times, defined as the time needed to reach 90% of the signal change according to IUPAC, were extracted for all analytes. The results of the time-dependent reflectance spectra (Fig. S12–S14, ESI†) are summarized in Fig. 5. For water exposure, the response times seem to correlate with the amount of water adsorbed: while CAU-1-SBU shows the longest response time of over 60 seconds, the hydrophobic CAU-1-Hex responds within 13 seconds. As water is the smallest molecule of the solvents investigated we assume that the prolonged uptake times for CAU-1-SBU and CAU-1 are linked to stronger interactions between the polar solvent water and the framework. Interestingly, the response times for methanol drop to 18 seconds for CAU-1-SBU and CAU-1, while CAU-1-Hex shows only a slightly increased response time of 14 seconds, comparable to that of water. With the exception of ethanol in CAU-1-Hex, the response times for the alcohols increase with the size of the alcohol in all samples, suggesting slower diffusion times within the BSs as the size of the alcohol increases. The most striking behavior is observed for n-heptane that readily saturates within a few seconds independent of the sample investigated, which points to relatively weaker van-der-Waals interactions between the framework and n-heptane suggesting that analyte size plays only a secondary role in the adsorption process. All in all, the longer uptake times observed in the hydrophilic samples CAU-1 and CAU-1-SBU suggest that interactions by hydrogen bonding are the determining factor during adsorption. Although host–guest interactions and, thus, diffusion processes in such multi-modal pore systems having numerous interfaces are complex to describe, the additional information gathered from the wavelength dependent reflectance versus time measurements opens up additional possibilities to distinguish between different analytes. Comparable MOF-based PCs in the literature were reported to show similar uptake times ranging from a few seconds to approximately a minute.26,28
In addition to spectroscopic evaluation by means of spectral shifts, color image analysis combined with statistical data evaluation, provides another approach to discriminate between analytes, as already pointed out in the literature.19,28 This method avoids the necessity of spectroscopic instrumentation and, in principle, only requires a camera for image analysis. In our case, the photographic images were recorded simultaneously to spectra acquisition using an alternate stream of nitrogen and solvent vapor. The images were processed by alignment, area selection and red, green and blue (RGB) value extraction. The reversibility in the respective RGB intensities during nitrogen and analyte exposure proves the reproducibility of the measurements (Fig. S15, ESI†). For data interpretation, principal component analysis (PCA) based on the characteristic differences between the RGB values (Tables S5–S7, ESI†) of the stacks during nitrogen exposure and upon vapor saturation was performed. This statistical method allows to express a set of observables (solvents) depending on correlated variables (ΔRGB values) by a reduced set of orthogonal, principal components. For experimental and calculation details, see ESI.†
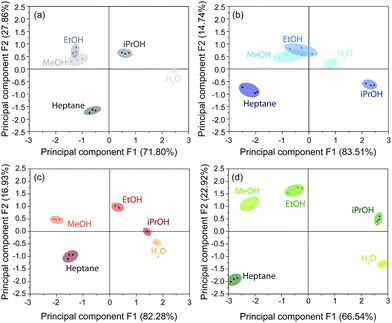
The score plots for the BSs CAU-1-SBU, CAU-1 and CAU-1-Hex obtained from the PCA are depicted in Fig. 6(a–c). The 2D projections of the factor scores illustrate the discrimination capability of these BSs based on the principal components F1 and F2. Considering both components F1 + F2, 98.25% (CAU-1-SBU), 99.66% (CAU-1) and 99.21% (CAU-1-Hex) of the variance is taken into account. In case of the pristine and SBU-modified BS, a poor discrimination capability for methanol and ethanol is observed as indicated by the clustering and overlap of the respective factor scores. For CAU-1-Hex, however, all solvents investigated are readily distinguishable. Although CAU-1-Hex already shows satisfactorily different values for guest molecule recognition, a combination of all three photonic crystal sensors into an array improves the distinction capability even further with all scores being clearly separated from each other (Fig. 6(d)). Here, the components F1 and F2 account for 89.46% of the variance, which proves to be sufficient for analyte assignment.
Conclusions
We have demonstrated a generic post-assembly modification strategy for MOF-based photonic crystal vapor sensors that can be used to fine-tune the selectivity and sensitivity of the active MOF layers. Importantly, since post-synthetic modification is performed in a one-step process on the as-assembled PC sensor, the need for multi-step modification procedures and time-consuming adjustments of both MOF nanoparticle synthesis and Bragg stack fabrication was avoided. The sorption properties and host–guest interactions between the CAU-1 framework and volatile analytes were varied by either changing the coordination environment of the metal-oxo SBU or by amide-formation at the linker, translating into significant changes in the optical response of the photonic crystal sensor to the analytes.Repeated exposure to the solvent vapors did not affect reproducibility, thus demonstrating the stability and reusability of the photonic crystal sensor. In addition, we have shown that the time-resolved change in the reflectance intensity can be used as another suitable descriptor for analyte discrimination, even if the optical shifts for two analytes are very similar. Furthermore, color image evaluation by principal component analysis was used as an additional route to classify the altered optical response of the photonic crystal based sensors. All in all, we have shown that combining the distinct sorption behavior of different CAU-1 modifications with the use of complementary signal detection routes – wavelength-shift of the Bragg peak, time-dependent monitoring of the reflectance intensity, and color image analysis – greatly facilitates analyte discrimination. In summary, our study demonstrates that a generic post-assembly modification strategy under mild conditions can be used as a facile, yet powerful tool to fine-tune the selectivity and sensitivity of MOF-based photonic sensing platforms.
Conflicts of interest
There are no conflicts to declare.Acknowledgements
We thank L. Nichols (Newcastle University) and F. Fink (LMU Munich) for preliminary experiments and V. Duppel (MPI for Solid State Research), T. Sick and C. Minke (LMU Munich) for help with the material characterization. Financial support was granted by the Max Planck Society, the University of Munich (LMU Munich), the Center for NanoScience (CeNS), and the Deutsche Forschungsgemeinschaft (DFG) through the Cluster of Excellence “Nanosystems Initiative Munich” (NIM) and the priority programs “Porous Metal–Organic Frameworks” (SPP 1362) as well as “COORNETs” (SPP 1928). Open Access funding provided by the Max Planck Society.Notes and references
- Y. Cui, B. Li, H. He, W. Zhou, B. Chen and G. Qian, Acc. Chem. Res., 2016, 49, 483–493 CrossRef CAS PubMed.
- H. Furukawa, K. E. Cordova, M. O’Keeffe and O. M. Yaghi, Science, 2013, 341 Search PubMed.
- J. R. Long and O. M. Yaghi, Chem. Soc. Rev., 2009, 38, 1213–1214 RSC.
- K. K. Tanabe and S. M. Cohen, Chem. Soc. Rev., 2011, 40, 498–519 RSC.
- S. Yuan, Y.-P. Chen, J.-S. Qin, W. Lu, L. Zou, Q. Zhang, X. Wang, X. Sun and H.-C. Zhou, J. Am. Chem. Soc., 2016, 138, 8912–8919 CrossRef CAS PubMed.
- O. Karagiaridi, W. Bury, J. E. Mondloch, J. T. Hupp and O. K. Farha, Angew. Chem., Int. Ed., 2014, 53, 4530–4540 CrossRef CAS PubMed.
- J. Lee, O. K. Farha, J. Roberts, K. A. Scheidt, S. T. Nguyen and J. T. Hupp, Chem. Soc. Rev., 2009, 38, 1450–1459 RSC.
- J.-R. Li, R. J. Kuppler and H.-C. Zhou, Chem. Soc. Rev., 2009, 38, 1477–1504 RSC.
- A. Morozan and F. Jaouen, Energy Environ. Sci., 2012, 5, 9269–9290 CAS.
- L. E. Kreno, K. Leong, O. K. Farha, M. Allendorf, R. P. Van Duyne and J. T. Hupp, Chem. Rev., 2012, 112, 1105–1125 CrossRef CAS PubMed.
- R. M. Abdelhameed, M. M. Q. Simões, A. M. S. Silva and J. Rocha, Chem. – Eur. J., 2015, 21, 11072–11081 CrossRef CAS PubMed.
- S. Jung and S. Park, ACS Catal., 2017, 7, 438–442 CrossRef CAS.
- Y.-Z. Zhang, T. Cheng, Y. Wang, W.-Y. Lai, H. Pang and W. Huang, Adv. Mater., 2016, 28, 5242–5248 CrossRef CAS PubMed.
- W. P. Lustig, S. Mukherjee, N. D. Rudd, A. V. Desai, J. Li and S. K. Ghosh, Chem. Soc. Rev., 2017, 46, 3242–3285 RSC.
- Z. Hu, B. J. Deibert and J. Li, Chem. Soc. Rev., 2014, 43, 5815–5840 RSC.
- Z.-Z. Lu, R. Zhang, Y.-Z. Li, Z.-J. Guo and H.-G. Zheng, J. Am. Chem. Soc., 2011, 133, 4172–4174 CrossRef CAS PubMed.
- J.-M. Yang, Q. Liu and W.-Y. Sun, J. Solid State Chem., 2014, 218, 50–55 CrossRef CAS.
- J. D. Joannopoulos, S. G. Johnson, J. N. Winn and R. D. Meade, Photonic Crystals: Molding the Flow of Light, Princeton University Press, 2nd edn, 2011 Search PubMed.
- L. D. Bonifacio, G. A. Ozin and A. C. Arsenault, Small, 2011, 7, 3153–3157 CrossRef CAS PubMed.
- G. Lu and J. T. Hupp, J. Am. Chem. Soc., 2010, 132, 7832–7833 CrossRef CAS PubMed.
- C. Cui, Y. Liu, H. Xu, S. Li, W. Zhang, P. Cui and F. Huo, Small, 2014, 10, 3672–3676 CrossRef CAS PubMed.
- J. Cui, N. Gao, C. Wang, W. Zhu, J. Li, H. Wang, P. Seidel, B. J. Ravoo and G. Li, Nanoscale, 2014, 6, 11995–12001 RSC.
- L. Li, X. Jiao, D. Chen, B. V. Lotsch and C. Li, Chem. Mater., 2015, 27, 7601–7609 CrossRef CAS.
- G. Lu, O. K. Farha, L. E. Kreno, P. M. Schoenecker, K. S. Walton, R. P. Van Duyne and J. T. Hupp, Adv. Mater., 2011, 23, 4449–4452 CrossRef CAS PubMed.
- Y.-n. Wu, F. Li, Y. Xu, W. Zhu, C.-a. Tao, J. Cui and G. Li, Chem. Commun., 2011, 47, 10094–10096 RSC.
- Y.-n. Wu, F. Li, W. Zhu, J. Cui, C.-a. Tao, C. Lin, P. M. Hannam and G. Li, Angew. Chem., Int. Ed., 2011, 50, 12518–12522 CrossRef CAS PubMed.
- F. M. Hinterholzinger, A. Ranft, J. M. Feckl, B. Ruhle, T. Bein and B. V. Lotsch, J. Mater. Chem., 2012, 22, 10356–10362 RSC.
- A. Ranft, F. Niekiel, I. Pavlichenko, N. Stock and B. V. Lotsch, Chem. Mater., 2015, 27, 1961–1970 CrossRef CAS.
- Z. Hu, C.-a. Tao, F. Wang, X. Zou and J. Wang, J. Mater. Chem. C, 2015, 3, 211–216 RSC.
- T. Ahnfeldt, N. Guillou, D. Gunzelmann, I. Margiolaki, T. Loiseau, G. Férey, J. Senker and N. Stock, Angew. Chem., 2009, 121, 5265–5268 CrossRef.
- T. Ahnfeldt, D. Gunzelmann, J. Wack, J. Senker and N. Stock, CrystEngComm, 2012, 14, 4126–4136 RSC.
- P. Yeh, Optical waves in layered media, Wiley, New York, 1988 Search PubMed.
Footnote |
| † Electronic supplementary information (ESI) available: Synthetic procedures, characterization details, DLS, XRD, IR, solid-state and liquid NMR, elemental analysis, pore size distributions, cross-sectional images, GISAXS, reflectance spectra. See DOI: 10.1039/c7nh00209b |
| This journal is © The Royal Society of Chemistry 2018 |

