CO2 packing polymorphism under confinement in cylindrical nanopores†
Ilaria
Gimondi
and
Matteo
Salvalaglio
 *
*
Thomas Young Centre and Department of Chemical Engineering, University College London, WC1E 7JE, London, UK. E-mail: m.salvalaglio@ucl.ac.uk
First published on 8th January 2018
Abstract
We investigate the effect of cylindrical nano-confinement on the phase behaviour of a rigid model of carbon dioxide using both molecular dynamics and well tempered metadynamics. To this aim we study a simplified pore model across a parameter space comprising pore diameter, CO2-pore wall potential and CO2 density. In order to systematically identify ordering events within the pore model we devise a generally applicable approach based on the analysis of the distribution of intermolecular orientations. Our simulations suggest that, while confinement in nano-pores inhibits the formation of known crystal structures, it induces a remarkable variety of ordered packings unrelated to their bulk counterparts, and favours the establishment of short range order in the fluid phase. We summarise our findings by proposing a qualitative phase diagram for this model.
Design, System, ApplicationUnderstanding the effect of confinement on polymorph selection is key to direct the assembly of the next generation of self assembled molecular materials. In particular predicting the effect of confinement in inhibiting or enhancing the nucleation of ordered phases is pivotal to develop efficient crystallization processes. In this paper, using a combination of molecular dynamics and well tempered metadynamics, we analyse the effect of cylindrical nano confinement on the phase behaviour of CO2. Our analysis is relevant to gain insight into the behaviour of CO2 porous matrices with potential impact on carbon capture processes. Furthermore it allows to identify general principles of confinement-induced polymorph selection. For instance we find that confinement inhibit the nucleation of bulk crystal forms, while promoting the formation of distinct ordered packings. This work paves the way for a systematic exploration of confinement as a tool for directing the assembly of molecular materials. |
1 Introduction
Confinement is known to play a role in the phase behaviour of molecular solids, most notably affecting polymorph selection.1,2 For instance, a paradigmatic example of the dramatic effects of confinement on the spatial arrangement of molecules is provided by water, which, as proven both experimentally and computationally, displays a counter-intuitively complex phase diagram under confinement.3–10 Understanding polymorphism in confined volumes is relevant both to describe natural processes11,12 as well as for driving rational materials and process development.13,14 Despite its importance a systematic understanding of confinement effects is still lacking.Following up a recent work, in which we have investigated the thermodynamics and mechanism of phase transition between CO2 forms I and III in bulk, we set out to study the effect of confinement on CO2 condensed phases. We tackle this problem by carrying out a systematic analysis of CO2 phase behaviour confined in weakly interacting cylindrical nano pores.
Cylindrical confinement is known to markedly affect phase behaviour. Even in systems of spherical particles, both rigid and soft, cylindrical nano-confinement has been found to induce characteristic packing structures, as well as abrupt transitions from order to disorder as a function of the void fraction.15–20
Our work has a two-fold aim: on the one hand understanding phase behaviour of confined CO2 is relevant due to its prominent role within the carbon cycle, and the surging needs for mitigating its emissions in atmosphere by implementing capture and storage technologies based on adsorption in porous solids.21–24 On the other hand due to its modest structural complexity accompanied with a rich phase diagram, CO2 represents a convenient model system to perform extensive sampling of polymorphic transitions at finite temperature25 and gain insight on general aspects of molecular phase transitions under confinement.
Both experiments and theory highlight remarkable effects of confinements on CO2 phase behaviour. For instance, the density of confined CO2 can significantly exceed the fluid phase bulk density26–31 reaching values comparable to that of solid CO2 and displaying signs of orientational correlations and structural rearrangements.26,27
Several examples of molecular modelling studies can be found investigating the transport of CO2 in a confined fluid phase,30,32,33 and the modelling literature characterising structural features of CO2 under confinement is limited. An insightful work from Elola and Rodriguez has recently proposed a detailed analysis of the CO2 fluid structure within silica pores, highlighting how confinement induces a layered arrangement in the fluid phase and determines a significant slowdown of both translational and rotational diffusion of CO2 molecules.31
In our work we aim complementing the state of the art by understanding whether confinement promotes or inhibits the formation of ordered phases. To this aim we systematically analyse the intermolecular structural organisation of CO2 confined in a simplified pore geometry consisting of a cylinder of Lennard-Jones (LJ) particles. We carry out a systematic study as a function of the cylinder radius (spanning from 1 to 5 nm), the nominal density of CO2 molecules (5–15 molecules per nm3), and the interaction potential with the pore walls. We investigate this parameter space by systematically carrying out unbiased molecular dynamics simulations starting from liquid-like initial conditions, and by enhancing the exploration of ordered molecular packings with metadynamics.
Our analysis shows that, while the formation of known solid CO2 arrangements is inhibited, confinement unveils a rather complex behaviour. Depending on the location in parameter space, confined CO2 can either approach a completely disordered fluid state, exhibit short-range orientation correlations or arrange into long-range ordered packings. By systematically analysing relative orientations distributions we have systematically detected ordering events from molecular trajectories and classified ordered configurations.
This paper is organized as follows: firstly, in section 2, we introduce the model system, methods, parameters space, and the analysis tools developed to characterise ordering transitions. In section 3 we present and discuss our results, and finally in section 4 we summarise our findings by proposing a qualitative phase diagram in the space defined the nominal density of the pore and its normalised radius.
2 Methods
To investigate the effect of confinement on liquid carbon dioxide we have employed both standard molecular dynamics (MD)34–36 and well-tempered metadynamics (WTMetaD).37 For a detailed description of metadynamics we refer to Barducci et al.,37,38 and Valsson et al.,39 and for a brief overview of its applications in crystallisation studies to Giberti et al.40 In the following we report the setup of the molecular model investigated, the details of MD simulations and WTmetaD simulations setup, and the analysis approach implemented to detect and characterise the emergence of an ordered phase from an initial liquid state.CO2 potential
In order to model CO2 we employ the transferable potentials for phase equilibria (TraPPE) force field41,42 with introduction of dummy atoms. As we aim at keeping the molecules rigid, this strategy, previously employed by Sanghi et al.30 to represent 3-site CO2, allows to avoid instabilities in MD simulations caused by constraining planar angles. The TraPPE force field is chosen among the models available for CO2 for two reasons: on the one hand, it works reasonably well in the representation of the fluid at high pressure as well as of the liquid–solid border;43,44 on the other hand, this choice is consistent with our previous work on carbon dioxide polymorphism at high pressure,25 and allows for a direct comparison with results obtained in bulk.Pore model
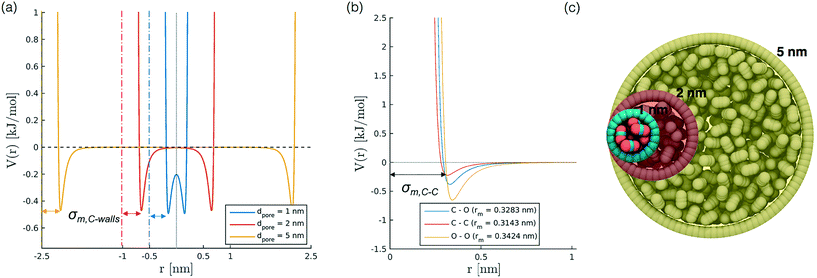
To develop a simplified model to study confinement in a weakly interacting porous medium, we build a single-wall cylindrical nanopore of LJ particles. We consider different pore diameters (1, 1.3, 2, 5 nm) with a constant wall density of 33.104 atoms per nm2 and a height of 10 nm for all diameters except the case with diameter 5 nm, where the height has been limited to 5 nm for the sake of computational efficiency. The selection of pore diameters is based on literature works on confined CO2;27,31,45,46 we did not include larger sizes, as for values bigger than 2 nm we observe a bulk-like behaviour of the fluid. The cylinder axis aligns with z. We also investigate the effect induced by variations in the wall potential induced by keeping constant εwall (0.9977 kJ mol−1) while varying the σwall, in the interval between 0.253 to 0.405 nm.Simulation set up
For our simulations we choose temperature conditions of 323 K and nominal carbon dioxide densities compatible with supercritical CO2.24,28,30 The position of the wall atoms is frozen, but their intermolecular interaction with carbon dioxide molecules is taken into account, and, as presented in the results, plays a major role in the organization of the fluid inside the pore; CO2 particles are instead allowed to move.Firstly, we run NVT molecular dynamics simulations of the described system, with Bussi–Donadio–Parrinello47 thermostat. We apply periodic boundary conditions (pbc) to ensure continuity along z, i.e. the cylinder axis. To avoid overlapping effects in the radial direction from periodic images, the simulation box is much larger (around 10 times) than the pore diameter. Lennard-Jones potential with Lorentz-Berthelot combination rules and long-range corrections is employed. Typical MD simulations are 20 ns-long, starting from disordered configurations equilibrated for 100 ps.
We use the same setup to carry out WTMetaD simulations aimed at exploring the space of accessible packings beyond the timescale limit of unbiased MD. As collective variable we employ an order parameter, hereafter indicated with λ, that expresses the degree of crystallinity of a system based on the local environment around each molecule and is able to distinguish not only between liquid and solid phases but also among polymorphs. A complete description of the mathematical formulation of λ has been reported by Giberti et al.48 Explorative WTMetaD simulations are carried out biasing two distinct formulations of the λ order parameter: λI, tuned to capture the molecular arrangement of CO2 bulk form I, which we have recently developed to investigate CO2 polymorphism at high pressure;25 and λB, based instead on the characteristic angles and local density of the most abundant ordered structure observed under confinement (configuration B in Table 2). Further explanation of the formulation and parameters for λI and λB, and details about the WTMetaD set up are available in the ESI.†
Parameter space representation
In order to represent our results throughout parameter space in a rational and efficient form we define a single adimensional radius, r′, which accounts for variations in both LJ potential (σwall) and pore size and quantifies the void space available within the pore.5 The adimensional radius r′ is defined by the following expression: | (1) |
| r′ | d pore [nm] | ||||
|---|---|---|---|---|---|
| 1 | 1.3 | 2 | 5 | ||
| σ wall [nm] | 0.253 | 0.639 | 1.116 | 2.230 | 7.003 |
| 0.315 | 0.528 | 1.006 | 2.119 | 6.892 | |
| 0.340 | 0.484 | 0.961 | 2.075 | 6.847 | |
| 0.372 | 0.472 | 0.904 | 2.017 | 6.790 | |
| 0.405 | 0.368 | 0.845 | 1.959 | 6.731 | |
Systematic detection of ordered arrangements
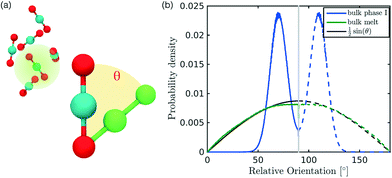
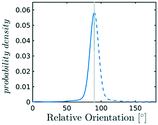
In the definition of ordered parameters such as λ the identification of characteristic relative orientations is key.25,40,49 This is typically based on the analysis of the distribution of relative orientations that characterises a relevant structure, as extensively discussed for bulk CO2 in ref. 25. Indeed the relative orientation between molecular axes of neighbouring molecules represents a fingerprint of each arrangement and in principle allows to distinguish not only between liquid and solid, but also among different solid structures. An example of such distributions for bulk dry ice and liquid CO2 is reported in Fig. 2. In the following we build on this observation to systematically detect ordering phenomena in within molecular trajectories.As reported in Fig. 2, crystal and liquid carbon dioxide display significantly different characteristic orientation distributions. In order to quantitatively capture such difference we apply the Bhattacharyya distance,50 a metric that quantifies the dissimilarity of two probability densities. The Bhattacharyya distance DB between two angle distributions p(θ) and q(θ) is defined as:
DB(p,![[thin space (1/6-em)]](https://www.rsc.org/images/entities/char_2009.gif) q) = −ln(CB(p, q) = −ln(CB(p,![[thin space (1/6-em)]](https://www.rsc.org/images/entities/char_2009.gif) q)) q)) | (2) |
 | (3) |
In our analysis we take advantage of the fact that a completely random arrangement of linear molecules displays a relative orientation probability density characterised by the functional form pref = 1/2![[thin space (1/6-em)]](https://www.rsc.org/images/entities/char_2009.gif) sin
sin![[thin space (1/6-em)]](https://www.rsc.org/images/entities/char_2009.gif) θ. For a derivation of the reference distribution functional form see the ESI.† As shown in Fig. 2 the distribution of angles in the bulk of liquid CO2 closely resembles the theoretical random distribution pref.
θ. For a derivation of the reference distribution functional form see the ESI.† As shown in Fig. 2 the distribution of angles in the bulk of liquid CO2 closely resembles the theoretical random distribution pref.
Given a molecular trajectory, we can therefore define a time dependent measure of the deviation from an ideal random packing of CO2 molecules as:
 | (4) |
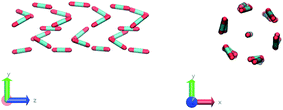
The construction of p(θ,t) is straightforward for carbon dioxide, due to its linear, symmetrical geometry. For each molecule we evaluate the polar angle between its molecular axis and the analogous vector in each one of its nearest neighbours, i.e. molecules within a cut-off radius of 4 Å for ordered phases and 5 Å for the liquid as shown in Fig. 2(a).
Tools
Pores are built using an in-house FORTRAN code, while we use Packmol51 to insert carbon dioxide molecules at random positions and orientations in order to avoid any creation of patterns. For MD and WTMetaD simulations we employ Gromacs 5.2.152 and Plumed 2.2.53 Post-processing of the results is carried on with MATLAB (R2015a), Visual Molecular Dynamics (VMD)54 and Plumed 2.2.533 Results and discussion
In this section we present and discuss the results of our molecular dynamics investigation of the effect of confinement on CO2 ordering. Preliminary simulations were carried out to investigate the equilibrium distribution of a single CO2 molecule in the presence of a cylindrical LJ wall and are discussed in ESI.† In the following we begin by discussing the arrangement of CO2 molecules within the pore as a function of pore size and density, and we continue by reporting an analysis of the ordered arrangements identified within our parameter space.Molecular arrangement within the pore
We begin by analysing the arrangement of CO2 molecules in the pores at increasing ρCO2. In the case of low densities we observe the formation of a single layer of adsorbed CO2 molecules in contact with the pore surface associated with a hollow structure. With increasing ρCO2 larger pores (dpore = 2 and 5 nm), can accommodate a second layer of CO2, and then display bulk-like filling as shown in Fig. 3(a and c). This finding is in agreement with the results obtained by Elola and Rodriguez31 for CO2 confined in silica pores. Furthermore, the identified arrangement is reminiscent of the layered structure, identified by Prestipino et al.,20 that emerges in a system of nanoconfined soft spheres due to the geometrical frustration of the freezing transition.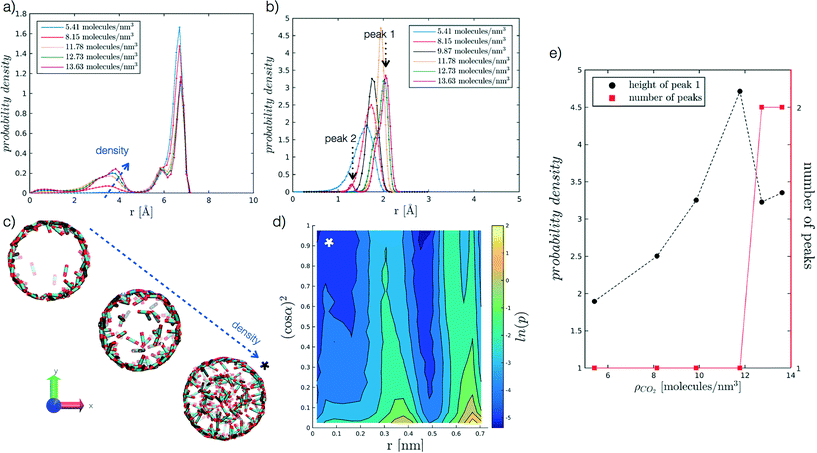 | ||
Fig. 3 Probability density profiles associated with the position of CO2 molecules in the radial direction of the pore, for the range of densities investigated at different values of r′. In particular, (a) refers to r′ = 2.075, and (b) to r′ = 0.484. Along the abscissa, i.e. the pore radius, zero corresponds to the cylinder axis, while the maximum value reported to the radius of the pore. For the case in (b), (e) further analyses the height of the adsorbed layer peak and the number of peaks as a function of ρCO2. For the case in (a), instead, (c) reports snapshots of hollow to filled structures for increasing ρCO2, from 5.41 to 8.15 to 12.73 molecules per nm3. More in detail, (d) presents the probability density of the angle a as a function of the radial distance, for r′ = 2.075 and ρCO2 = 12.73 molecules per nm3. The angle α, reported as (cos![[thin space (1/6-em)]](https://www.rsc.org/images/entities/char_2009.gif) α),2 is evaluated between CO2 molecular axis and the vector normal to the pore walls; to enhance the differences on the plot the probability density is represented by its logarithm. The x-axis convention is the same as before, with cylinder axis in zero. α),2 is evaluated between CO2 molecular axis and the vector normal to the pore walls; to enhance the differences on the plot the probability density is represented by its logarithm. The x-axis convention is the same as before, with cylinder axis in zero. | ||
Furthermore, we analyse CO2 molecular orientation within the pore by evaluating the angle α between the molecular axis and the normal to the pore surface. As shown in Fig. 3(d), we can clearly note the high probability regions in the r, (cos![[thin space (1/6-em)]](https://www.rsc.org/images/entities/char_2009.gif) α)2 plane, corresponding to individual layers. We note that in both layers α is narrowly distributed around 90°. This indicates that CO2 molecules arrange parallel to the pore surface, in agreement with observations reported in the literature.27,30,31,55
α)2 plane, corresponding to individual layers. We note that in both layers α is narrowly distributed around 90°. This indicates that CO2 molecules arrange parallel to the pore surface, in agreement with observations reported in the literature.27,30,31,55
In smaller pores (dpore = 1 and 1.3 nm) a layered structure is not observed and the decrease in height of the dominant peak (peak 1 in Fig. 3(b)), accompanied by the appearance of a secondary peak (peak 2 in Fig. 3(b)) is instead associated with a reorganisation of the CO2 packing within the pore (see Fig. 3(b and e)). For instance, we note that at dpore = 1.3 nm, CO2 arranges as a chain along the z axis for densities equal or above 9.87 molecules per nm3.
Detecting emerging order
After discussing the position and alignment of CO2 molecules with respect to the pore wall, we delve into the analysis of intermolecular arrangement. In particular, we analyse the arrangement of the local environment around each CO2 molecule by monitoring the distribution of relative orientations. As mentioned in section 2, this information constitutes a structural fingerprint and can discriminates not only between ordered and disordered arrangements but also among different ordered packings.As discussed in section 2, to detect the unfolding of ordering events we compute the Bhattacharyya distance, DB(t) with respect to an ideal random packing for each MD trajectory. When ordered arrangements nucleate within a pore, the DB metric displays a sharp increase. An example of this behaviour in a typical trajectory is reported in Fig. 4, where in (b) we compare the trend of DB(t) for a trajectory undergoing an ordering transition (violet) and a trajectory that remains stable in the fluid state (green). In Fig. 4(a) the evolution of the instantaneous intermolecular angle distribution p(θ,t) is reported together with the pref(θ) corresponding to an ideal random packing.
Mapping phase behaviour in the (ρCO2,![[thin space (1/6-em)]](https://www.rsc.org/images/entities/h3_char_2009.gif) r′) parameter space
r′) parameter space
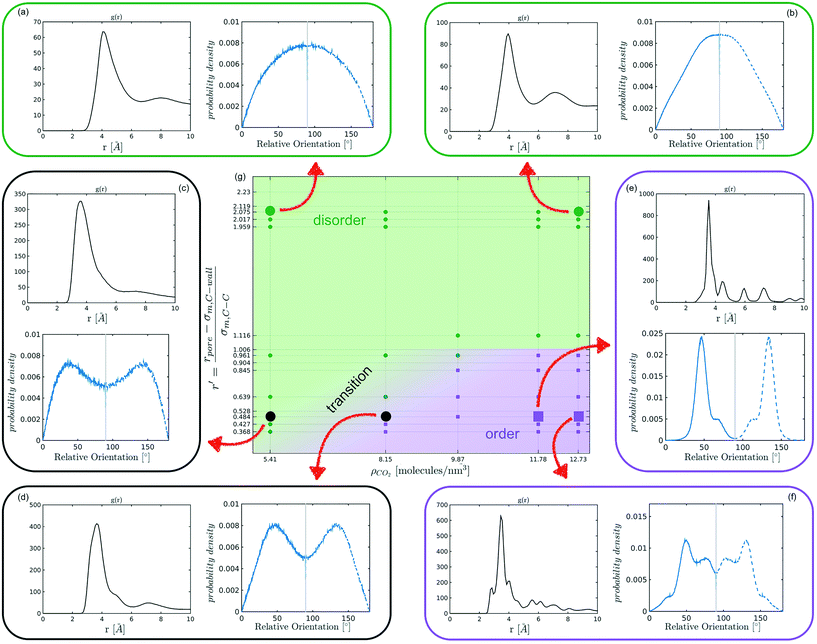
The systematic analysis of the deviation from an ideal random packing and the contextual detection of the appearance of ordered phases from a liquid configuration allows to clearly map the qualitative behaviour of confined CO2 within the (ρCO2,![[thin space (1/6-em)]](https://www.rsc.org/images/entities/char_2009.gif) r′) parameter space. In particular we can identify areas where CO2 under confinement spontaneously evolves to ordered packings within the characteristic timescale of MD simulations. To further analyse our finding, we complement the analysis of the angle distribution by reporting the C–C radial pair distribution function g(r). Inspecting both g(r) and relative orientation distribution we can identify three regions in parameter space: a disordered region (Fig. 5 green area, examples (a and b)), an ordered region (Fig. 5 violet area, examples (e–f)), and a transition region between them (Fig. 5 green-to-violet area, examples (c and d)). We note that in the disordered region, at large r′ and low density, the distribution of relative orientations approaches the ideal random distribution and the g(r) displays the short-range order typical of a liquid. On the contrary, in the ordered region both the angle distribution and the g(r), deviate from the typical liquid behaviour denoting long-range order through the presence of characteristic peaks in both orientation distribution and g(r). Finally, the transition region denotes a peculiar behaviour. In this region of parameter space, while g(r) maintains a close resemblance to that of a liquid phase, the distribution of relative orientations displays significant deviations from an ideal random packing suggesting the development of correlation in the relative orientation of CO2 molecules.
r′) parameter space. In particular we can identify areas where CO2 under confinement spontaneously evolves to ordered packings within the characteristic timescale of MD simulations. To further analyse our finding, we complement the analysis of the angle distribution by reporting the C–C radial pair distribution function g(r). Inspecting both g(r) and relative orientation distribution we can identify three regions in parameter space: a disordered region (Fig. 5 green area, examples (a and b)), an ordered region (Fig. 5 violet area, examples (e–f)), and a transition region between them (Fig. 5 green-to-violet area, examples (c and d)). We note that in the disordered region, at large r′ and low density, the distribution of relative orientations approaches the ideal random distribution and the g(r) displays the short-range order typical of a liquid. On the contrary, in the ordered region both the angle distribution and the g(r), deviate from the typical liquid behaviour denoting long-range order through the presence of characteristic peaks in both orientation distribution and g(r). Finally, the transition region denotes a peculiar behaviour. In this region of parameter space, while g(r) maintains a close resemblance to that of a liquid phase, the distribution of relative orientations displays significant deviations from an ideal random packing suggesting the development of correlation in the relative orientation of CO2 molecules.
From the analysis of the transitions obtained in the structured region of parameter space we notice a finer grained level of structural complexity. As displayed by the qualitative comparison of both the distribution of relative orientations and the g(r) reported in examples Fig. 5(e) and (f) multiple ordered packings can be obtained.
Stable ordered packings
We now move on to present a detailed analysis of the ordered structures encountered within the ordered region of the (ρCO2,![[thin space (1/6-em)]](https://www.rsc.org/images/entities/char_2009.gif) r′) phase diagram. We shall note that, in order to confirm the finding emerging from unbiased simulations, we have applied WTMetaD simulations to further sample the configuration space of confined CO2. This allows to verify that in the disordered or transition regions ordered arrangements cannot be found or, when found do not states with a finite lifetime and spontaneously revert to liquid in unbiased MD.
r′) phase diagram. We shall note that, in order to confirm the finding emerging from unbiased simulations, we have applied WTMetaD simulations to further sample the configuration space of confined CO2. This allows to verify that in the disordered or transition regions ordered arrangements cannot be found or, when found do not states with a finite lifetime and spontaneously revert to liquid in unbiased MD.
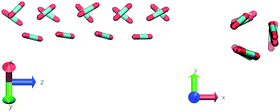
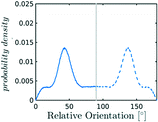
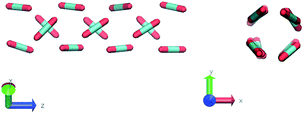
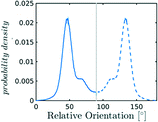
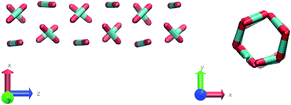
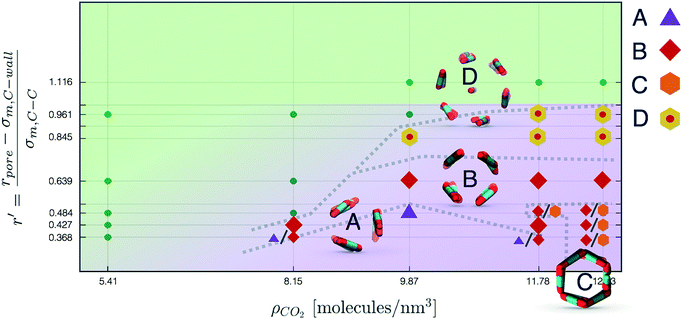
Nevertheless, in the region of the phase diagram where confinement-induced order emerges, we identify four different stable arrangements. We assign to such arrangements a label progressing from A to D, based on their structural features. As we can see in Table 2, progressing from A to D these structures present an increasing number of molecules in their repeating unit. Moreover, the same classification applies when analysing the geometry of the apparent ring that characterises the horizontal cross-section of the pore (see Table 2). The number of ring members is 3 in A, 4 in B, and 6 in both C and D, with D displaying one molecule in the middle of the pore oriented parallel to the pore longitudinal axis.
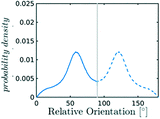
As far as the packing of these four ordered structures is concerned, it can be seen that the characteristic angle distribution represents a clear fingerprint of their molecular arrangement (Table 2), while the coordination number appears to be a function of the total density inside the pore and cannot clearly discriminate between different arrangements. In particular, the orientation distribution of B presents well-defined peaks in θ1 = 46.2° and symmetrically in θ2 = 133.8°, while C a very sharp single one in θ = 90°. Structure A, instead, appears to be an intermediate between B and C both from the inspection of the coordinates and from its characteristic angle distribution. Indeed, while the most densely populated orientations closely resemble those of B, the peak at 90° is more pronounced than in B. Form D present instead wider peaks in θ1 = 57.9° and the additional peak θ2 = 122.1°.
Interestingly, three out of four ordered structures, more precisely A, B, and D, form spontaneously in unbiased MD simulations; phase C, instead, is generated from metadynamics simulations performed in conditions that spontaneously yielded other ordered arrangements (violet area in the r′/ρCO2 phase diagram in Fig. 5 and 6); structure C is confirmed to be a metastable state for the system possessing a finite lifetime through 20 ns long unbiased MD simulations, initialised in configuration C, which do not display any sign of instability transition.
It should be noted that the exploration carried out with WTMetaD yields additional ordered arrangements, which, however, do not survive unbiased MD and are therefored considered to be unstable (see ESI†).
In addition metadynamics further confirms that for ρCO2-r′ conditions that induce spontaneous ordering, the disordered liquid state is strongly disfavoured with respect to the ordered phases. Indeed even in extended WTMetaD simulations, characterised by the deposition of significant bias, no melting event can be observed, while transitions between ordered arrangements are routinely detected. This finding is consistent irrespective of the set of CVs used to enhance the exploration and suggests that the energetic barrier associated with melting is higher than the barriers associated with solid–solid interconversion.
Furthermore, the conversion from hollow (A, B, C) to filled (D) ordered structures and vice versa is not sampled during WTMetaD simulations; this transition appears unlikely in the conditions investigated since, as discussed before, different values of r′ can accommodate different numbers of CO2 layers.
On the other hand, transition between phase A, B and C is possible and consistently sampled. More precisely, it takes place though a gradual reorganisation of the layers that starts in a localised region and then spreads through the entire pore length. Interestingly, WTMetaD allows to sample mixed arrangements of different packings, (e.g. half ordered as B and half as C) which reveal to be stable in subsequent MD simulation, confirming that solid–solid interconversion is an activated event. Moreover, in these structures it is common to find boundary regions in which the order is not well-defined, effectively acting as defects within the pore.
4 Conclusions
In this work we present a systematic investigation of the effects of confinement in cylindrical nanopores on CO2, as a function of pore size, wall potential and CO2 density. To systematically detect the formation of ordered packings we have devised a general analysis approach based on the calculation of the time-dependent Bhattacharyya distance between a reference probability density and the instantaneous probability density of the relative orientation of nearest neighbours. Here we have adopted as a reference an ideal random packing, which closely approximates the distribution of relative orientations in the bulk of the liquid phase. This analysis approach is general and we anticipate its applicability to a much wider range of phase transitions in molecular solids.We find that cylindrical confinement induces polymorph selection by inhibiting the nucleation of known solid forms of CO2 while at the same time inducing the organisation of CO2 into a series of distinct ordered arrangements, which do not resemble any of the known CO2 polymorphs. Using a combination of unbiased MD and WTMetaD we identify four ordered packing that are stable in the region of parameter space corresponding to small pore radii and large densities. These configurations have been labelled A, B, C and D following the progression in the number of CO2 molecules visible in a cross-section of a pore. Interestingly, none of these configurations corresponds to known bulk structures. It should be noted that, while A, B, and D emerge spontaneously from unbiased MD, C is found from the enhanced exploration of the configuration space achieved with WTmetaD.
In Fig. 6 we report a qualitative phase diagram that summarizes the identified structures and the regions of parameter space where such structures have obtained. Markers point the location in parameter space where specific packings have been observed. Cases in which multiple configurations are indicated on the phase diagram represent points in which multiple arrangements have been observed either with unbiased MD or through WTMetaD. We observe that, in the ordered region of the phase diagram WTMetaD was quite efficient in promoting transitions between ordered packings, however it was unable to induce melting. Despite its qualitative character, this observation suggests that within the ordered region of the phase diagram solid–solid interconversion is energetically favoured with respect to liquid mediated transitions.
Finally we observe that, even in the disordered region confinement induces a short-range organisation of the liquid phase, in which the distribution of relative orientations departs from an ideal random packing, as shown in Fig. 5. At large volumes and low densities the bulk behaviour is recovered as expected.
To conclude we note how such a simple model system such as CO2 confined in a simple nanometric pore model unveils remarkable structural complexity, showcasing the profound effect of confinement on the phase behaviour of molecular solids. This work paves the way for a systematic assessment of CO2 packing polymorphism in systems characterised by realistic pore geometries and surface chemistry.
Conflicts of interest
There are no conflicts to declare.Acknowledgements
The authors acknowledge EPSRC (Engineering and Physical Sciences Research Council) for PhD scholarship (EPSRC Award ref 1760926), and UCL Legion High Performance Computing Facility for access to Legion@UCL and associated support services, in the completion of this work.References
- J.-M. Ha, J. H. Wolf, M. A. Hillmyer and M. D. Ward, J. Am. Chem. Soc., 2004, 126, 3382–3383 CrossRef CAS PubMed.
- A. Llinàs and J. M. Goodman, Drug Discovery Today, 2008, 13, 198–210 CrossRef PubMed.
- Y. Maniwa, H. Kataura, M. Abe, S. Suzuki, Y. Achiba, H. Kira and K. Matsuda, J. Phys. Soc. Jpn., 2002, 71, 2863–2866 CrossRef CAS.
- A. Striolo, A. A. Chialvo, K. E. Gubbins and P. T. Cummings, J. Chem. Phys., 2005, 122, 234712 CrossRef CAS PubMed.
- H. Kyakuno, K. Matsuda, H. Yahiro, Y. Inami, T. Fukuoka, Y. Miyata, K. Yanagi, Y. Maniwa, H. Kataura, T. Saito, M. Yumura and S. Iijima, J. Chem. Phys., 2011, 134, 244501 CrossRef PubMed.
- G. Algara-Siller, O. Lehtinen, F. C. Wang, R. R. Nair, U. Kaiser, H. A. Wu, A. K. Geim and I. V. Grigorieva, Nature, 2015, 519, 443–445 CrossRef CAS PubMed.
- A. K. Soper, Nature, 2015, 519, 417–418 CrossRef CAS PubMed.
- K. V. Agrawal, S. Shimizu, L. W. Drahushuk, D. Kilcoyne and M. S. Strano, Nat. Nanotechnol., 2016, 12, 267–273 CrossRef PubMed.
- J. Chen, G. Schusteritsch, C. J. Pickard, C. G. Salzmann and A. Michaelides, Phys. Rev. Lett., 2016, 116, 025501 CrossRef PubMed.
- J. Chen, A. Zen, J. G. Brandenburg, D. Alfè and A. Michaelides, Phys. Rev. B, 2016, 94, 220102 CrossRef.
- C. J. Stephens, S. F. Ladden, F. C. Meldrum and H. K. Christenson, Adv. Funct. Mater., 2010, 20, 2108–2115 CrossRef CAS.
- Y.-W. Wang, H. K. Christenson and F. C. Meldrum, Adv. Funct. Mater., 2013, 23, 5615–5623 CrossRef CAS.
- A. Y. Lee, I. S. Lee, S. S. Dette, J. Boerner and A. S. Myerson, J. Am. Chem. Soc., 2005, 127, 14982–14983 CrossRef CAS PubMed.
- M. Beiner, G. T. Rengarajan, S. Pankaj, D. Enke and M. Steinhart, Nano Lett., 2007, 7, 1381–1385 CrossRef CAS PubMed.
- R. O. Erickson, Science, 1973, 181, 705–716 CAS.
- F. Durán-Olivencia and M. Gordillo, Phys. Rev. E: Stat., Nonlinear, Soft Matter Phys., 2009, 79, 061111 CrossRef PubMed.
- M. Maddox and K. Gubbins, J. Chem. Phys., 1997, 107, 9659–9667 CrossRef CAS.
- M. A. Lohr, A. M. Alsayed, B. G. Chen, Z. Zhang, R. D. Kamien and A. G. Yodh, Phys. Rev. E: Stat., Nonlinear, Soft Matter Phys., 2010, 81, 040401 CrossRef CAS PubMed.
- A. Mughal, H. Chan, D. Weaire and S. Hutzler, Phys. Rev. E: Stat., Nonlinear, Soft Matter Phys., 2012, 85, 051305 CrossRef CAS PubMed.
- S. Prestipino, F. Saija, A. Sergi and P. V. Giaquinta, Soft Matter, 2013, 9, 9876–9886 RSC.
- S. M. Benson, in Carbon Dioxide Capture for Storage in Deep Geologic Formations, Elsevier, 2005, vol. 2, pp. 665–672 Search PubMed.
- F. M. Orr, Science, 2009, 325, 1656–1658 CrossRef CAS PubMed.
- N. MacDowell, N. Florin, A. Buchard, J. Hallett, A. Galindo, G. Jackson, C. S. Adjiman, C. K. Williams, N. Shah and P. Fennell, Energy Environ. Sci., 2010, 3, 1645–1669 CAS.
- S. Krevor, M. J. Blunt, S. M. Benson, C. H. Pentland, C. Reynolds, A. Al-Menhali and B. Niu, Int. J. Greenhouse Gas Control, 2015, 40, 221–237 CrossRef CAS.
- I. Gimondi and M. Salvalaglio, J. Chem. Phys., 2017, 147(11), 114502 CrossRef PubMed.
- G. K. Papadopoulos, J. Chem. Phys., 2001, 114, 8139–8144 CrossRef CAS.
- T. Steriotis, K. Stefanopoulos, N. Kanellopoulos, A. Mitropoulos and A. Hoser, Colloids Surf., A, 2004, 241, 239–244 CrossRef CAS.
- Y. B. Melnichenko, H. Mayama, G. Cheng and T. Blach, Langmuir, 2010, 26, 6374–6379 CrossRef CAS PubMed.
- G. Rother, E. G. Krukowski, D. Wallacher, N. Grimm, R. J. Bodnar and D. R. Cole, J. Phys. Chem. C, 2012, 116, 917–922 CAS.
- T. Sanghi and N. R. Aluru, J. Chem. Phys., 2012, 136, 024102 CrossRef CAS PubMed.
- M. D. Elola and J. Rodriguez, J. Phys. Chem. C, 2016, 120, 1262–1269 CAS.
- X. Yang and C. Zhang, Chem. Phys. Lett., 2005, 407, 427–432 CrossRef CAS.
- A. Botan, B. Rotenberg, V. Marry, P. Turq and B. Noetinger, J. Phys. Chem. C, 2010, 114, 14962–14969 CAS.
- M. E. Tuckerman, Statistical Mechanics: Theory and Molecular Simulation, OXFORD UNIVERSITY PRESS, 2010 Search PubMed.
- D. Frenkel and B. Smit, Understanding Molecular Simulation-From Algorithms to Applications, ACADEMIC PRESS, 2nd edn., 2002 Search PubMed.
- J. C. Palmer and P. G. Debenedetti, AIChE J., 2015, 61, 370–383 CrossRef CAS.
- A. Barducci, G. Bussi and M. Parrinello, Phys. Rev. Lett., 2008, 100, 1–4 CrossRef PubMed.
- A. Barducci, M. Bonomi and M. Parrinello, WIREs Comput. Mol. Sci., 2011, 1, 826–843 CrossRef CAS.
- O. Valsson, P. Tiwary and M. Parrinello, Annu. Rev. Phys. Chem., 2016, 67, 159–184 CrossRef CAS PubMed.
- F. Giberti, M. Salvalaglio and M. Parrinello, IUCrJ, 2015, 2, 256–266 CrossRef CAS PubMed.
- J. J. Potoff, J. R. Errington and A. Z. Panagiotopoulos, Mol. Phys., 1999, 97, 1073–1083 CrossRef CAS.
- J. J. Potoff and J. I. Siepmann, AIChE J., 2001, 47, 1676–1682 CrossRef CAS.
- C. G. Aimoli, E. J. Maginn and C. R. Abreu, Fluid Phase Equilib., 2014, 368, 80–90 CrossRef CAS.
- G. Pérez-Sanchéz, D. Gonzaléz-Salgado, M. M. Piñeiro and C. Vega, J. Chem. Phys., 2013, 138, 084506 CrossRef PubMed.
- E. Pantatosaki, D. Psomadopoulos, T. Steriotis, A. Stubos, A. Papaioannou and G. Papadopoulos, Colloids Surf., A, 2004, 241, 127–135 CrossRef CAS.
- S. K. Bhatia, K. Tran, T. X. Nguyen and D. Nicholson, Langmuir, 2004, 20, 9612–9620 CrossRef CAS PubMed.
- G. Bussi, D. Donadio and M. Parrinello, J. Chem. Phys., 2007, 126, 014101 CrossRef PubMed.
- F. Giberti, M. Salvalaglio, M. Mazzotti and M. Parrinello, Chem. Eng. Sci., 2015, 121, 51–59 CrossRef CAS.
- M. Salvalaglio, T. Vetter, F. Giberti, M. Mazzotti and M. Parrinello, J. Am. Chem. Soc., 2012, 134, 17221–17233 CrossRef CAS PubMed.
- A. Bhattacharyya, Bull. Calcutta Math. Soc., 1943, 35, 99–109 Search PubMed.
- D. G. Truhlar, J. Comput. Chem., 2009, 28, 73–86 CrossRef PubMed.
- M. Abraham, D. van der Spoel, E. Lindahl, B. Hess and the GROMACS development Team, GROMACS User Manual version 5.1.1, www.gromacs.org, 2015 Search PubMed.
- G. A. Tribello, M. Bonomi, D. Branduardi, C. Camilloni and G. Bussi, Comput. Phys. Commun., 2014, 185, 604–613 CrossRef CAS.
- W. Humphrey, A. Dalke and K. Schulten, J. Mol. Graphics, 1996, 14, 33–38 CrossRef CAS PubMed.
- A. Vishnyakov, P. I. Ravikovitch and A. V. Neimark, Langmuir, 1999, 15, 8736–8742 CrossRef CAS.
Footnote |
| † Electronic supplementary information (ESI) available: Single molecule probability distribution in the model pore, derivation of the ideal random distribution pref(θ), details of the setup and results of explorative metadynamics simulations, additional analysis of the radial density profiles. See DOI: 10.1039/c7me00103g |
| This journal is © The Royal Society of Chemistry 2018 |

