Cancer immunotherapy μ-environment LabChip: taking advantage of optoelectronic tweezers†
Ling-Yi
Ke
a,
Zong-Keng
Kuo
bc,
Yu-Shih
Chen
b,
Tsu-Yi
Yeh
a,
Minxiang
Dong
a,
Hsiang-Wen
Tseng
c and
Cheng-Hsien
Liu
 *ab
*ab
aDepartment of Power Mechanical Engineering, National Tsing Hua University, Hsinchu City 30013, Taiwan, R.O.C. E-mail: liuch@pme.nthu.edu.tw
bInstitute of Nanoengineering and Microsystems, National Tsing Hua University, Hsinchu City 30013, Taiwan, R.O.C
cPharmacodynamics Technology Department, Center of Excellence for Drug Development, Biomedical Technology and Device Research Labs, Industrial Technology Research Institute, Hsinchu City 30011, Taiwan, R.O.C
First published on 6th December 2017
Abstract
A cancer immunotherapy μ-environment LabChip, equipped with titanium oxide phthalocyanine (TiOPc)-based optoelectronic tweezers (OET) to achieve direct cell–cell contact, can be used to study the interaction between immune cells and other cells for real-time analysis of NK cells' behavior. In microfluidic devices, it is difficult to solve dead zone problems and observe dynamic cell–cell interactions. We have created a stable and static culture μ-environment which can enhance NK cell activities. In addition, OET is used to solve dead zone problems by manipulating a single cell into four-leaf-clover-shaped (FLCS) microwells made of poly(ethylene glycol) diacrylate (PEG-DA) through optofluidic maskless lithography, causing direct cell–cell contact. Our design reconstructed an in vitro human immune system for the study of dynamic immunological response. When the NK cells came into contact with the target cells in the μ-environment LabChip, we observed that the target cells showed apoptotic characteristics (i.e. cell shrinkage and blebbing within 2 h and then die within 3 h). In addition, our μ-environment LabChip demonstrated higher NK cell activity compared with conventional analysis. We have created an innovative cancer immunotherapy μ-environment LabChip to provide a stable and static μ-environment for cell–cell interaction study. Furthermore, our μ-environment LabChip showed the potential to enhance NK cell activity and to study immunological interactions between immune cells and cancer cells dynamically.
Introduction
The first line of defense for maintaining a healthy human body is the immune system, whose necessary responses of single cell and intercellular interactions function through versatile mechanisms.1,2However, effector natural killer (NK) cells in the immune system could be in direct contact with target cells and cause their death.3 Immune cells execute their physical activities through versatile mechanisms where cell–cell interaction is one of the important mechanisms. Furthermore, through observing the immune cytotoxic activity of individual NK cell during the interaction with the target cell, the overall performance of immune system could be predicted.4 Manipulating a single cell in a suitable environment can provide an immediate and direct observation of its cellular behavior. Recently, using microfluidic techniques to manipulate and observe single cells has been widely applied to clinical research,5 such as drug and toxicity screening,6 tissue engineering,7,8 and cancer immunotherapy.9 NK cells are effector cells accounting for approximately 5–15% of peripheral blood lymphocytes and they play important roles in the innate immune system inside the human body.10,11 Among the lymphocytes in the immune system, NK cells and T cells demonstrate the function of cytolysis through direct contact with target cells causing their death.12–14 Conventional methods for NK cell activity analysis rely on flow cytometry,15 and a large number of immune and target cells were used, in which the interaction between single cells cannot be observed in a dynamic way.16,17 To overcome the disadvantages of the present techniques, biomedical microfluidic technology could be utilized to manipulate a few single cells instead of requiring a large number of cells for this immune toxicity assay.18,19 Recently, microchips with multiple microwells and automated image analysis facilitate live cell imaging and observation of NK activity heterogeneity within a population of NK cells.4,16 However, seeding cells onto these microchips relies on the sedimentation of the cell suspension into each well, which cannot directly and precisely control the cell number and cell contact within a microwell.16 It is relatively easier to observe long-term cell interactions, in which further comprehension of single-cell function and response in the immune system would be obtained.20,21
Recently, biomedical microfluidic techniques have been widely used to enhance the functions of immune assays, e.g. using the DEP array to trap and manipulate immune cells to perform specific immunotherapy.22 Furthermore, it is essential to note that the immune cells come into direct contact with the target cells through cell–cell interaction.23 According to previous studies, the analysis of NK cells' activity has been widely applied for the investigation of cell–cell interactions between a single immune cell and its target cell.24 It is important to note that the immune cells are in direct contact with target cells and carry out further activities through cell–cell interactions.25 Researchers have adopted various conventional capturing methods to trap suspended cells, including the design of shallow well interiors26 and wells with high aspect ratios.27 Moreover, microfluidic chips for single cell analysis and manipulation have been developed using different methods, including chemical,28 optical,29–31 dielectrophoresis (DEP),32,33 microdroplets,34 magnetic,35 microstructure arrays,36,37 and hydrodynamic methods.38,39 By using microfluidic devices, there is an increased possibility of observing cell–cell interactions at the single cell level and a high-throughput analysis could be achieved.40,41
Moreover, through different microfluidic designs, single cells can be isolated, which facilitates the analysis of a large scale of specific cell responses.42 DEP and OET have been developed and used for trapping and manipulating single cells for a variety of applications recently. However, they are still some challenges in observing single cell activity in real time with culture medium and drug perfusion using recently developed DEP and OET. A dead zone could form in microfluidic channels because specific microfluidic channel and microstructure designs allow in vitro static cell culture,43–46 which provides a μ-environment without shear stress and affects the performance of the cells. However, the dead zone would block the cells from flowing into the microwell for in vitro static cell culture. Recently, there have been a few reports addressing the manipulation of cells into the dead zone, which include changing the structure design and using hydrogels, DEP and OET.47,48 For example, hydrogels have been widely used in complex device fabrication as biomaterial scaffolds for drug release, and tissue engineering.49–52
Among the hydrogels, photo-responsive poly(ethylene glycol) diacrylate (PEG-DA)-based hydrogels are often used for the formation of microstructures inside microfluidic chips because of their good biocompatibility and high mass transfer efficiency.53–55 On the other hand, the cells are pulled and pushed in a designed non-uniform fixed electric field by traditional DEP, while optoelectronic tweezers (OET) combines the characteristics of DEP to utilize light-emitting diodes operating at a wavelength between 700 and 800 nm. This changes the conductivity of the light-exposed material surface and dynamically modifies the electric field to manipulate the cells into specific dead zones.56
In this paper, we report the design of PEG-DA hydrogel four-leaf-clover-shaped (FLCS) microwells that ameliorate the dead zone problems by using OET to manipulate NK cells and target cells into a static culture μ-environment to bring them into direct contact with each other. These microwells, the dead zones, can provide a stable and static culture μ-environment to observe the interaction between NK cells and their target cells and to build up the in vitro μ-environment for immunotherapy studies. We designed FLCS hydrogel arrays with different internal diameters by using PEG-DA for the purpose of optimizing the culture-microwell design with respect to culture medium diffusion and cell trapping. Through the modification of the TiOPc surface used for OET manipulation in the immunotherapy μ-environment LabChip, the other surfaces including the TiOPc surface become biocompatible which helps to prevent cytotoxicity in the cells. Our immunotherapy μ-environment LabChip is a promising device which can be a simple alternative tool for studying cell interactions and can ameliorate the disadvantages of conventional analysis tools.
Materials and methods
Design concept
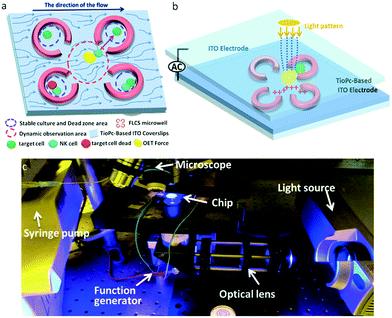
In this cancer immunotherapy μ-environment LabChip, PEG-DA hydrogel FLCS microwells were designed to ameliorate dead zone problems by integrating TiOPc-based OET to manipulate the desired NK cells and target cells to be in direct contact with each other. Our cancer immunotherapy μ-environment LabChip has excellent features that can be used to solve the following two critical issues existing in traditional methods for the analysis of NK cell activities. First, we took advantage of OET to ensure direct cell–cell contact, which helps to clearly observe the NK cells killing the target cells. Second, we have created a stable μ-environment through avoiding continuous fluid flow and shear stress in the desired experimental zones on the chip to meet biomimetic requirements. Without the FLCS design, the continuous perfusion would easily wash the secreted proteins away, which would impair cell–cell interactions. Our LabChip design aims to study the immune cell behavior at the single cell level, establish a stable and static culture μ-environment to keep the secreted proteins, and minimize the shear stress so as to increase NK cell activities causing immune cell–cell interactions. On the other hand, the use of FLCS microwells results in changes in flow velocity in the microfluidic channel, such that a slow flow velocity zone exists in the center which provides a suitable environment for OET force to manipulate single cells (Fig. 1a). The desired electric-field distribution in the chip can be controlled by our dynamic light pattern. The light-induced non-uniform electrical field produces the OET non-contact force, so that the single cell could be guided into the FLCS microwells made of PEG-DA hydrogels. For our immunotherapy μ-environment LabChip, the advantage of the OET non-contact force is the real-time dynamical control of the vertical virtual electrodes via the programmed light pattern through a projector (Fig. 1b). For the experimental setup, our immunotherapy μ-environment LabChip is operated by only a simple system, including a microscope, a syringe pump, a function generator, a projector (illuminating light source), an optical lens, computers, and a charge-coupled device (CCD) (Fig. 1c).Device fabrication
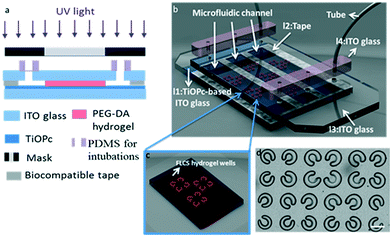
Our cancer immunotherapy μ-environment LabChip for cancer and immune cell culture consists of a PEG-DA FLCS microwell array, which is located on the TiOPc-coated ITO glass substrate. The photoconductive TiOPc is an organic light sensitive material, which increases its conductivity via absorbing energy from electromagnetic radiation. First, a 1000 μl TiOPc droplet was placed on a 6 cm × 2 cm ITO glass and was spread on the ITO glass at 1200 rpm for 20 s. The glass was baked at 120 °C for evaporation of organic solvents and to increase the contact of TiOPc with the glass substrate. In the field of tissue engineering, hydrogels have been widely employed because of their biocompatibility. A prepolymer solution containing PEG-DA (Mn = 700 Da, Sigma-Aldrich, USA) with 10% (w/v) photoinitiator, 2,2′-dimethoxy-2-phenylacetophenone (DMPA, 99% Sigma-Aldrich, USA), was injected into the microfluidic channels in the immunotherapy μ-environment LabChip. Furthermore, to prevent the cells from sticking on the walls of the microchannels, surface modification is required. The fabrication process is shown in Fig. 2a. Thus, we coated Pluronic F127 (F127, Sigma-Aldrich, USA) as a surfactant on the surface of the microchannels to reduce stickiness. The TiOPc-based immunotherapy μ-environment LabChip is a multilayer chip, comprising four layers (l1, l2, l3, and l4) and three channels (Fig. 2b). After chip fabrication, the photocrosslinkable PEG-DA solution was injected into the microchannels, followed by UV light (365 nm) exposure to form the FLCS microwells. The exposure was done using a maskless exposure machine (XPRESS, SF-100, USA) which utilized a digital micromirror device (DMD) system to transfer the predesigned patterns from the computer to the immunotherapy μ-environment LabChip (Fig. 2c). The exposure area of this maskless exposure machine when using a 4× reduction lens is 1280 μm × 960 μm, corresponding to 1024 × 768 pixels on the computer. Furthermore, whole chip exposure can be achieved by moving the exposure window step by step with the help of auto-stage (Fig. 2d).Simulation
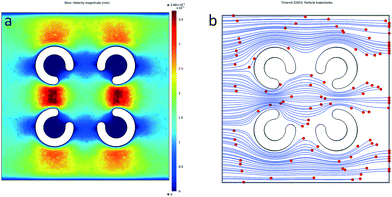
To improve the cell manipulation and optimize the immunotherapy μ-environment LabChip design, COMSOL Multiphysics was utilized to simulate the microfluidic field, flow velocity and particle streamlines (Fig. 3a and b). The inlet flow velocity was set to 1 μl min−1. We observed that the presence of FLCS microwells helps to decrease the fluid velocity and changes the particle streamlines, which make it easier for the TiOPc-based OET to manipulate the single cells. The velocity distribution of the fluid around the FLCS microwells forms a stable dead zone in the center of each FLCS microwell. In addition, there is a slow flow velocity zone in the middle area of the FLCS microwells, so that this area can be easily observed for the simulation of particle trajectory.OET operation
The immunotherapy μ-environment LabChip which takes advantage of TiOPc-based OET manipulation consists of two parallel ITO glasses, one of which is coated with TiOPc, a photoconductive material. A light source of 700–800 nm wavelength was used for illumination. The light patterns on the TiOPc layer were generated by computer software through a liquid-crystal display (LCD) projector. Accordingly, the light patterns, which acted as virtual electrodes, could be dynamically controlled and positioned to make the electrical field mobile as we desired to manipulate the NK and target cells on the chip in real time. The NK and target cells were separately dispersed in a DEP-manipulating buffer (8.5% sucrose, 0.3% dextrose, 10 mM HEPES, and 0.1 mM CaCl2 in ddH2O) and pumped into the chip, respectively. Then OET was operated under the conditions of 3–5 V at 10–100 kHz after the microchannel was filled with the cell-suspension buffer.57 Before introducing the second kind of cells into the immunotherapy μ-environment LabChip, chip washing was needed to remove the excess cells, to avoid the pairing of the same kind of cells in one microwell. Since the cells were manipulated to the dead zone where were free from the influence of the flow field, they could stay stable during the washing step. It is worth noting that the TiOPc layer tends to deteriorate under the OET operating conditions of low AC frequency and high voltage.Cell culture
L929 cells were obtained from American Type Culture Collection (ATCC). Mouse fibroblast (L929) cells were cultured and maintained in minimum essential medium with 10% horse serum. The NK-92MI (NK) cell line (BCRC, Taiwan) which stably expressed interleukin-2 (IL-2) was used in the experiments. NK cells were maintained in alpha minimum essential medium (α-MEM) without ribonucleosides and deoxyribonucleosides, with 2 mM L-glutamine adjusted to contain 1.5 g L−1 sodium bicarbonate, supplemented with 0.2 mM inositol, 0.1 mM 2-mercaptoethanol, 0.02 mM folic acid, and 12.5% horse serum, and 12.5% fetal bovine serum. K562-EGFP (target) cells, which stably expressed enhanced green fluorescent protein (EGFP), were maintained in RPMI-1640 medium (Invitrogen, USA) supplemented with 4 mM L-glutamine adjusted to contain 1.5 g L−1 sodium bicarbonate, 10% fetal bovine serum (FBS), and 500 μg mL−1 Geneticin (G418). When performing the NK cell-mediated cytotoxicity assay, the target cells and NK cells were maintained in target culture medium without G418.On chip cell culture and activity analysis
After OET operations, the DEP buffer, which could not provide a suitable culture environment for long term culture, was replaced with culture medium. Because of the dead zone created by the FLCS microwells, no disturbance could be observed on the paired cells during this process. Then the chip was connected to a syringe pump filled with 1000 μl of pre-equilibrated culture medium to start perfusion with a flow rate of 1 μl min−1. The perfusion was done in an incubator at 37 °C with 5% CO2 and lasted for 4 h. To record the cell states after 2 h, 3 h, and 4 h of perfusion, the target cells were stained with propidium iodide (PI, Sigma-Aldrich, USA) first to identify whether they were killed by the NK cells. The dead cells with red fluorescence were marked as PI-positive while the living target cells with green fluorescence were marked as EGFP-positive. Therefore, the percentage of target cells killed by the NK cells could be obtained by calculating the percentage of PI-positive cells in the EGFP-positive cells.Conventional NK cell activity analysis
We further mixed NK and K562-EGFP (target) cells with different ratios in a 96 well culture plate and an Eppendorf tube, and incubated them at 37 °C with 5% CO2 for 4 h. Afterwards, PI staining was used to identify and calculate the performance of the NK cells in killing the target cells. Based on conventional studies using flow cytometry, the NK and target cells were adjusted to the indicated ratio in either the 96 well culture plate or the Eppendorf tube, which lasted for 4 h inside the incubator. The cell mixture was stained with 4 μg mL−1 PI, and fixed with 4% formaldehyde for analysis by flow cytometry.Results and discussion
Diffusion in FLCS microwells
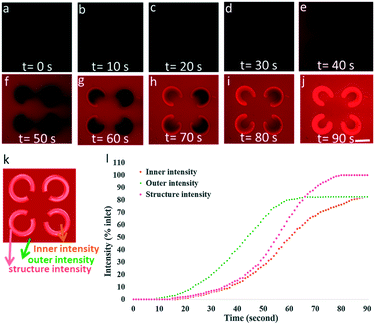
Rhodamine B (Sigma-Aldrich, USA) is a commonly used fluorescent dye in biology and microfluidics studies. A 1% Rhodamine B solution was loaded into the microfluidic channel of the immunotherapy μ-environment LabChip using a syringe pump at a flow rate of 1 μl min−1, wherein the area outside the FLCS microwells turned red quickly due to the continuous flow transport. The extent of time-variant diffusion within the arrays of FLCS microwells could be monitored through observing the distribution of rhodamine B (red) fluorescent dye. Fig. 4a–j show the chronological real-time diffusion where the medium diffuses into the FLCS microwells, in which the series of photos indicate the result of the diffusion experiment. These results suggested that the diffusion process in the FLCS microwells reached equilibrium after 90 s when the intensity of the fluorescent dye was stable. Fig. 4k presents the analysis of the fluorescence intensity in different areas of the structure, i.e., the structure, the inner area, and the outer area. Because of the solvent absorption characteristics of the PEG-DA hydrogel, the fluorescence intensity increases in all three areas, although it increased the most in the structure as shown in Fig. 4. The fluorescence intensity in the outer area reached a relatively high point after 65 s, but the fluorescence intensity in the structure and the inner area reached a maximum value after 90 s. Among these three parts, the PEG-DA hydrogel structure shows the highest fluorescence intensity at 90 s. Finally, due to the diffusion characteristics of the hydrogel, differences in intensity from the outer to the inner structure are identified in a short period of time, while the diffusion reaches equilibrium after a long period (Fig. 4l).Biocompatibility assay
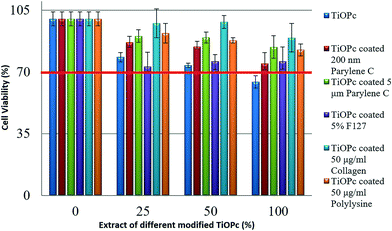
A biocompatibility assay protocol was performed according to international standard ISO10993-5. Briefly, we immersed chips with different coatings in L929 culture medium for 24 h at 37 °C to obtain the sample extracts. We seeded L929 cells into the wells of a 96 well culture plate and incubated them overnight in an incubator. Then, samples diluted via serial dilution were added into each of the cell-seeded wells. After culturing for 24 h at 37 °C and 5% CO2, the cytotoxicity was determined using the 3-(4,5-dimethylthiazol-2-yl)-2,5-diphenyltetrazolium bromide (MTT) assay. All experiments were performed in triplicate. L929 medium without exposed chips was used as the internal control. L929 cells treated with the TiOPc-contact medium showed viability a little bit lower than 70%. To eliminate cytotoxicity and increase biocompatibility, which could bring benefits to future studies, we coated different materials on top of TiOPc, such as 200 nm parylene C, 5 μm parylene C, 5% F127, 50 μg ml−1 collagen and 50 μg ml−1 polylysine. Fig. 5 summarizes the viability testing results of L929 cells with different material coatings and different concentration combinations of the TiOPc-contact medium. All modified TiOPc showed higher cell viability compared with unmodified TiOPc, which suggests the better biocompatibility of these modified TiOPc than that of unmodified TiOPc. Moreover, our chips showed good biocompatibility according to the protocol of ISO10993-5. In the following experiments, the cancer immunotherapy μ-environment LabChip with the 50 μg ml−1 collagen coated TiOPc was selected for further studies.TiOPc-based OET for manipulation of single beads and cells
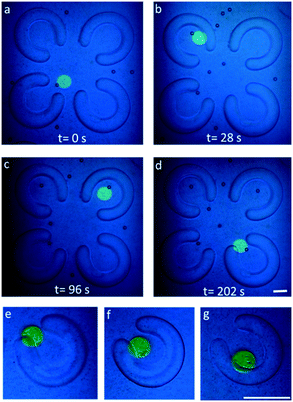
The dead zone problem has been solved in our chip design, in which the low flow field creates a stable and static μ-environment at the center of the PEG-DA FLCS microwells. To demonstrate the features of our TiOPc-based OET for precise manipulation of single micro-objects on our chip, both beads and cells were used and recorded as shown in Fig. 6. After loading the beads in the microfluidic channel of the immunotherapy μ-environment LabChip, we utilized the negative DEP forces generated by the TiOPc-based OET to manipulate the beads around the microwells into the FLCS microwells. Precisely programmed light patterns were projected onto the TiOPc photoconductive layer, while an AC signal of 3–5 V peak-to-peak at a frequency of 10–100 kHz was applied between the top and bottom ITO electrodes in the immunotherapy μ-environment LabChip. Fig. 6a–d show that the beads were manipulated by the TiOPc-based OET into the FLCS microwells whose internal diameter was 120 μm. The dynamic manipulation photos reveal that the cells were manipulated by the TiOPc-based OET into the PEG-DA FLCS microwells gradually. The direct cell–cell contact will enhance the NK cells' activity inside the stable culture environment with extremely low shear stress (Fig. 6e and f). Furthermore, the medium must be diffused into the PEG-DA FLCS microwells to maintain the vitality of the NK cells. As a result, a single target cell and a single NK cell were manipulated by the TiOPc-based OET to move into the PEG-DA FLCS microwells in a sequential order for direct cell–cell contact.Testing different sizes of FLCS hydrogel microwells
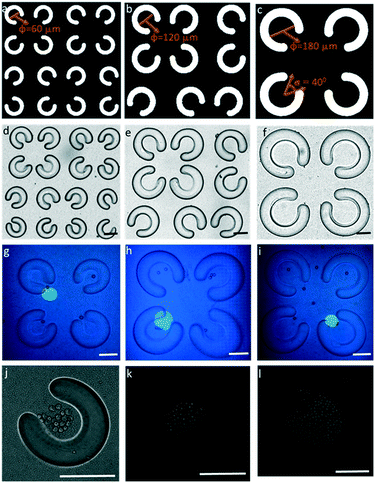
Based on the optofluidic maskless lithography technique, we used a biocompatible material, PEG-DA, to fabricate arrays of FLCS microwells by using maskless exposure. Here, three types of FLCS microwell arrays with different internal diameters were designed by using PEG-DA, including 60 μm, 120 μm, and 180 μm. We modified the opening angle of the PEG-DA microwells to 40°, according to the simulation of the flow field and cell streamline (Fig. 7a–f). TiOPc-based OET force can precisely manipulate the desired beads into FLCS microwells of different sizes on our immunotherapy μ-environment LabChip and bring the beads into contact with each other. Moreover, a large number of cells were also manipulated into the three different sized FLCS microwells, suggesting that our design accommodated not only a single cell, but also a larger number of cells for cell–cell interactions, which can enable further applications for quantitative analysis of immune cells (Fig. 7g–l).Immune cell activity assay
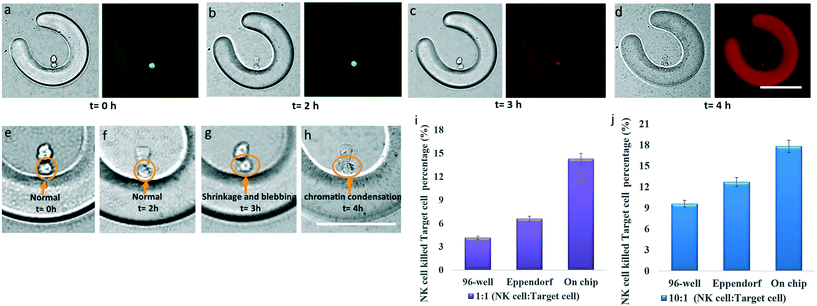
The NK cell activities not only involve cytotoxicity, which is mediated through the polarized release of cytolytic granules towards target cells, but also the secretion of cytokines and chemokines. In the following experiment, to reduce the shear stress and damage to cells, the activities of NK cells are observed when they come into contact with the target cells, where the cells are manipulated into PEG-DA FLCS microwells by TiOPc-based OET. Then, culture medium with propidium iodide (PI) dye was perfused into the FLCS microwells, and used for monitoring the viability of the target cells. The NK cells and target cells were both alive after undergoing TiOPc-based OET manipulation inside the microwells and live/dead assay (Fig. 8a).Fig. 8b shows that the target cell still survived after being in contact with the NK cell for 2 h. The microwells gradually became red after loading PI fluorescent dye because water was absorbed by the PEG-DA hydrogel via diffusion. Three hours later, it was observed that the target cell turned red (Fig. 8c), which implies that the NK cell successfully causes target cell apoptosis by releasing cytotoxic proteins (i.e. granzymes and perforin).3,58 Moreover, it can be clearly seen that the NK cells came into contact with the target cells which then caused shrinkage, blebbing and chromatin condensation of the target cells (Fig. 8d–h), which are typical morphological characteristics of apoptotic cells.36,59,60 These results demonstrated that the immune activity of NK cells was successfully observed via the design of the FLCS microwells on our immunotherapy μ-environment LabChip. The dynamic live cell imaging of the target cells killed by the NK cells showed similar morphological characteristics (i.e. cell shrinkage, blebbing and chromatin condensation) to those of apoptotic cells killed by NK cells in previous studies using microchips with multiple microwells and a cell counting slide.36,60 It's worth noting that our immunotherapy μ-environment LabChip can provide precise control of the cell contact to effectively observe the intercellular interaction between NK and target cells.
In order to quantify the NK activities, the percentage of the target cells killed by the NK cells was obtained by calculating the percentage of PI-positive cells in the EGFP-positive cells. Here, we manipulated a single cells to each microwell and controlled the cell number to achieve the NK activity assay, taking advantage of our FLCS microwell design on the immunotherapy μ-environment LabChip. Fig. 8i and j show a comparative study of the NK cell activity by analyzing the percentage of NK cells which killed target cells. We compared the NK cell activity by using flow cytometry in a 96 well cell culture plate, an Eppendorf tube, and our immunotherapy μ-environment LabChip. respectively. The ratio of NK cells which killed target cells was compared at 10![[thin space (1/6-em)]](https://www.rsc.org/images/entities/char_2009.gif) :
:![[thin space (1/6-em)]](https://www.rsc.org/images/entities/char_2009.gif) 1 and 1
1 and 1![[thin space (1/6-em)]](https://www.rsc.org/images/entities/char_2009.gif) :
:![[thin space (1/6-em)]](https://www.rsc.org/images/entities/char_2009.gif) 1, which revealed that more NK cells in immunological interactions exhibited highly efficient performance in killing target cells. Most importantly, our immunotherapy μ-environment LabChip demonstrates the highest NK activity among these three experiments, in which the percentage of target cells killed by the NK cells on the chip was almost twice those of the traditional assays when using the NK cell to target cell ratio of 1
1, which revealed that more NK cells in immunological interactions exhibited highly efficient performance in killing target cells. Most importantly, our immunotherapy μ-environment LabChip demonstrates the highest NK activity among these three experiments, in which the percentage of target cells killed by the NK cells on the chip was almost twice those of the traditional assays when using the NK cell to target cell ratio of 1![[thin space (1/6-em)]](https://www.rsc.org/images/entities/char_2009.gif) :
:![[thin space (1/6-em)]](https://www.rsc.org/images/entities/char_2009.gif) 1. This observation proves that in traditional methods different cells were mixed, making them interact with each other randomly with no direct cell–cell contact, whereas our LabChip solves this problem by ensuring perfect cell–cell interaction.
1. This observation proves that in traditional methods different cells were mixed, making them interact with each other randomly with no direct cell–cell contact, whereas our LabChip solves this problem by ensuring perfect cell–cell interaction.
Conclusions
In this paper, we report the development of our immunotherapy μ-environment LabChip. Using this immunotherapy μ-environment LabChip, a stable and static μ-environment is provided. The placement of PEG-DA FLCS microwells alters the velocity zones resulting in a slow velocity and dead zone in the center of the FLCS microwells. Furthermore, it stabilizes the flow field and decreases shear stress to maintain and accumulate the secretions from NK cells so as to enhance their activities and toxicities used for cancer immunotherapy. The TiOPc-based OET causes direct cell–cell contact for interactions among immune cells for real-time analysis of NK cells' behavior.In the immune cell activity assay, our immunotherapy μ-environment LabChip provided a suitable environment to observe the dynamic progress of the NK cells killing the target cells and showed enhanced NK activity through using TiOPc-based OET to directly and precisely bring the NK cells into contact with the target cells. The results suggest that our immunotherapy μ-environment LabChip provides a more suitable experimental environment than other traditional methods and current microfluidic devices to observe interactions between NK cells and target cells. Thus our proposed immunotherapy μ-environment LabChip has the potential to offer a stable and static culture environment for in vitro immunological studies.
Conflicts of interest
There are no conflicts to declare.Acknowledgements
This work was financially supported by the Ministry of Science and Technology, Taiwan, under grant no. MOST 104-2221-E-007-020-MY2. The authors also thank the Biomedical Engineering Research Laboratory at the Industrial Technology Research Institute, and the Center for Nanotech, Material Science and Microsystems at the National Tsing Hua University for research and facility support.References
- L. M. Weiner, R. Surana and S. Wang, Nat. Rev. Immunol., 2010, 10, 317–327 CrossRef CAS PubMed.
- H. S. Warren, Immunol. Cell Biol., 1996, 74, 473 CrossRef CAS PubMed.
- M. J. Smyth, E. Cretney, J. M. Kelly, J. A. Westwood, S. E. Street, H. Yagita, K. Takeda, S. L. van Dommelen, M. A. Degli-Esposti and Y. Hayakawa, Mol. Immunol., 2005, 42, 501–510 CrossRef CAS PubMed.
- K. Guldevall, L. Brandt, E. Forslund, K. Olofsson, T. W. Frisk, P. E. Olofsson, K. Gustafsson, O. Manneberg, B. Vanherberghen, H. Brismar, K. Kärre, M. Uhlin and B. Önfelt, Front. Immunol., 2016, 7, 119 Search PubMed.
- C. Ma, R. Fan, H. Ahmad, Q. Shi, B. Comin-Anduix, T. Chodon, R. C. Koya, C.-C. Liu, G. A. Kwong and C. G. Radu, Nat. Med., 2011, 17, 738–743 CrossRef CAS PubMed.
- D. K. Wood, D. M. Weingeist, S. N. Bhatia and B. P. Engelward, Proc. Natl. Acad. Sci. U. S. A., 2010, 107, 10008–10013 CrossRef CAS PubMed.
- J. A. Hubbell, Nat. Biotechnol., 1995, 13, 565–576 CrossRef CAS.
- A. Khademhosseini and R. Langer, Biomaterials, 2007, 28, 5087–5092 CrossRef CAS PubMed.
- M. Cheng, Y. Chen, W. Xiao, R. Sun and Z. Tian, Cell. Mol. Immunol., 2013, 10, 230–252 CrossRef CAS PubMed.
- E. Vivier, E. Tomasello, M. Baratin, T. Walzer and S. Ugolini, Nat. Immunol., 2008, 9, 503–510 CrossRef CAS PubMed.
- E. O. Mecha, Natural Killer Cells as Potential Markers for HIV/AIDS Progression, BoD–Books on Demand, 2014 Search PubMed.
- Q. A. Acton, Mononuclear Leukocytes—Advances in Research and Application: 2013 Edition, ScholarlyEditions, 2013 Search PubMed.
- E. Vivier, D. H. Raulet, A. Moretta, M. A. Caligiuri, L. Zitvogel, L. L. Lanier, W. M. Yokoyama and S. Ugolini, Science, 2011, 331, 44–49 CrossRef CAS PubMed.
- A. Moretta, E. Marcenaro, S. Parolini, G. Ferlazzo and L. Moretta, Cell Death Differ., 2008, 15, 226–233 CrossRef CAS PubMed.
- F. Kandarian, G. M. Sunga, D. Arango-Saenz and M. Rossetti, J. Visualized Exp., 2017, e56191 Search PubMed.
- E. Forslund, K. Guldevall, P. E. Olofsson, T. Frisk, A. E. Christakou, M. Wiklund and B. Önfelt, Front. Immunol., 2012, 3, 300 Search PubMed.
- B. Villas, Cell Vision, 1997, 5, 56–61 Search PubMed.
- S. Halldorsson, E. Lucumi, R. Gómez-Sjöberg and R. M. Fleming, Biosens. Bioelectron., 2015, 63, 218–231 CrossRef CAS PubMed.
- L. Zaritskaya, M. R. Shurin, T. J. Sayers and A. M. Malyguine, Expert Rev. Vaccines, 2010, 9, 601–616 CrossRef CAS PubMed.
- V. Proserpio and B. Mahata, Immunology, 2016, 147, 133–140 CrossRef CAS PubMed.
- P. K. Chattopadhyay, T. M. Gierahn, M. Roederer and J. C. Love, Nat. Immunol., 2014, 15, 128–135 CrossRef CAS PubMed.
- M. Abonnenc, M. Borgatti, E. Fabbri, R. Gavioli, C. Fortini, F. Destro, L. Altomare, N. Manaresi, G. Medoro and A. Romani, J. Immunol., 2013, 191, 3545–3552 CrossRef CAS PubMed.
- C. M. Nelson and C. S. Chen, FEBS Lett., 2002, 514, 238–242 CrossRef CAS PubMed.
- S. Lindstrom and H. Andersson-Svahn, Lab Chip, 2010, 10, 3363–3372 RSC.
- E. Assarsson, T. Kambayashi, J. D. Schatzle, S. O. Cramer, A. Von Bonin, P. E. Jensen, H.-G. Ljunggren and B. J. Chambers, J. Immunol., 2004, 173, 174–180 CrossRef CAS.
- S. Yamamura, H. Kishi, Y. Tokimitsu, S. Kondo, R. Honda, S. R. Rao, M. Omori, E. Tamiya and A. Muraguchi, Anal. Chem., 2005, 77, 8050–8056 CrossRef CAS PubMed.
- G. Trinchieri, Adv. Immunol., 1989, 47, 376 Search PubMed.
- Y. Lin, R. Trouillon, G. Safina and A. G. Ewing, Anal. Chem., 2011, 83, 4369–4392 CrossRef CAS PubMed.
- P. Y. Chiou, A. T. Ohta and M. C. Wu, Nature, 2005, 436, 370–372 CrossRef CAS PubMed.
- N.-T. Huang, H.-L. Zhang, M.-T. Chung, J. H. Seo and K. Kurabayashi, Lab Chip, 2014, 14, 1230–1245 RSC.
- A. T. Ohta, A. Jamshidi, H.-Y. Hsu, J. K. Valley, M. C. Wu, P.-Y. Chiou and S. L. Neale, Optoelectronic Tweezers for the Manipulation of Cells, Microparticles, and Nanoparticles, INTECH Open Access Publisher, 2010 Search PubMed.
- J. Voldman, Annu. Rev. Biomed. Eng., 2006, 8, 425–454 CrossRef CAS PubMed.
- J. Luo, E. L. Nelson, G. Li and M. Bachman, Biomicrofluidics, 2014, 8, 034105 CrossRef PubMed.
- L. Mazutis, J. Gilbert, W. L. Ung, D. A. Weitz, A. D. Griffiths and J. A. Heyman, Nat. Protoc., 2013, 8, 870–891 CrossRef CAS PubMed.
- P. Kauffmann, A. Ith, D. O'Brien, V. Gaude, F. Boué, S. Combe, F. Bruckert, B. Schaack, N. M. Dempsey and V. Haguet, Lab Chip, 2011, 11, 3153–3161 RSC.
- K. Guldevall, B. Vanherberghen, T. Frisk, J. Hurtig, A. E. Christakou, O. Manneberg, S. Lindström, H. Andersson-Svahn, M. Wiklund and B. Önfelt, PLoS One, 2010, 5, e15453 Search PubMed.
- S. Lindström, M. Eriksson, T. Vazin, J. Sandberg, J. Lundeberg, J. Frisén and H. Andersson-Svahn, PLoS One, 2009, 4, e6997 Search PubMed.
- D. Di Carlo, N. Aghdam and L. P. Lee, Anal. Chem., 2006, 78, 4925–4930 CrossRef CAS PubMed.
- M. Nourmohammadzadeh, Y. Xing, J. W. Lee, M. A. Bochenek, J. E. Mendoza-Elias, J. J. McGarrigle, E. Marchese, Y. Chun-Chieh, D. T. Eddington and J. Oberholzer, Lab Chip, 2016, 16, 1466–1472 RSC.
- D. Longo and J. Hasty, Mol. Syst. Biol., 2006, 2, 64 CrossRef PubMed.
- L. S. Cram, in Advanced Flow Cytometry: Applications in Biological Research, Springer, 2003, pp. 1–9 Search PubMed.
- T. Thorsen, S. J. Maerkl and S. R. Quake, Science, 2002, 298, 580–584 CrossRef CAS PubMed.
- H. Song, Y. Wang and K. Pant, Biomicrofluidics, 2011, 5, 024107 CrossRef PubMed.
- M. Li, W. Li, J. Zhang, G. Alici and W. Wen, J. Phys. D: Appl. Phys., 2014, 47, 063001 CrossRef.
- E. D. Pratt, C. Huang, B. G. Hawkins, J. P. Gleghorn and B. J. Kirby, Chem. Eng. Sci., 2011, 66, 1508–1522 CrossRef CAS PubMed.
- L. Wang, J. Lu, S. A. Marchenko, E. S. Monuki, L. A. Flanagan and A. P. Lee, Electrophoresis, 2009, 30, 782–791 CrossRef CAS PubMed.
- M. S. Kim, J. H. Yeon and J.-K. Park, Biomed. Microdevices, 2007, 9, 25–34 CrossRef CAS PubMed.
- C. Iliescu, G. Tresset and G. Xu, Appl. Phys. Lett., 2007, 90, 234104 CrossRef.
- J. L. Curley and M. J. Moore, J. Biomed. Mater. Res., Part A, 2011, 99, 532–543 CrossRef PubMed.
- S. Zalipsky and J. M. Harris, Poly(Ethylene Glycol) Chem., 1997, 680, 1–13 CAS.
- A. S. Hoffman, Adv. Drug Delivery Rev., 2012, 64, 18–23 CrossRef.
- J. J. Moon, M. S. Hahn, I. Kim, B. A. Nsiah and J. L. West, Tissue Eng., Part A, 2008, 15, 579–585 CrossRef PubMed.
- V. Hagel, T. Haraszti and H. Boehm, Biointerphases, 2013, 8, 36 CrossRef PubMed.
- C.-Y. Fu, S.-Y. Tseng, S.-M. Yang, L. Hsu, C.-H. Liu and H.-Y. Chang, Biofabrication, 2014, 6, 015009 CrossRef PubMed.
- S. Sivashankar, S. V. Puttaswamy, L.-H. Lin, T.-S. Dai, C.-T. Yeh and C.-H. Liu, Sens. Actuators, B, 2013, 176, 1081–1089 CrossRef CAS.
- W. Hu, Q. Fan and A. T. Ohta, Lab Chip, 2013, 13, 2285–2291 RSC.
- S.-M. Yang, S.-Y. Tseng, H.-P. Chen, L. Hsu and C.-H. Liu, Lab Chip, 2013, 13, 3893–3902 RSC.
- N. J. Topham and E. W. Hewitt, Immunology, 2009, 128, 7–15 CrossRef CAS PubMed.
- S. Elmore, Toxicol. Pathol., 2007, 35, 495–516 CrossRef CAS PubMed.
- S. S. Somanchi, K. J. McCulley, A. Somanchi, L. L. Chan and D. A. Lee, PLoS One, 2015, 10, e0141074 Search PubMed.
Footnote |
| † Electronic supplementary information (ESI) available: Video S1 shows the demonstration of TiOPc-based OET for precise manipulation of single micro-beads in a cancer immunotherapy μ-environment LabChip. Video S2 shows the diffusion in time series for PEG-DA hydrogel FLCS microwells. See DOI: 10.1039/c7lc00963a |
| This journal is © The Royal Society of Chemistry 2018 |

