
 Open Access Article
 This Open Access Article is licensed under a
 Creative Commons Attribution 3.0 Unported Licence
Flocculation on a chip: a novel screening approach to determine floc growth rates and select flocculating agents†
Anand N.
P. Radhakrishnan‡
 ,
Marco P. C.
Marques
,
Matthew J.
Davies
,
Brian
O'Sullivan
,
Daniel G.
Bracewell
and
Nicolas
Szita
*
,
Marco P. C.
Marques
,
Matthew J.
Davies
,
Brian
O'Sullivan
,
Daniel G.
Bracewell
and
Nicolas
Szita
*
Department of Biochemical Engineering, University College London, Bernard Katz Building, Gordon Street, London WC1H 0AH, UK. E-mail: n.szita@ucl.ac.uk; Tel: +44 (0) 207 679 9814
First published on 18th January 2018
Abstract
Flocculation is a key purification step in cell-based processes for the food and pharmaceutical industry where the removal of cells and cellular debris is aided by adding flocculating agents. However, finding the best suited flocculating agent and optimal conditions to achieve rapid and effective flocculation is a non-trivial task. In conventional analytical systems, turbulent mixing creates a dynamic equilibrium between floc growth and breakage, constraining the determination of floc formation rates. Furthermore, these systems typically rely on end-point measurements only. We have successfully developed for the first time a microfluidic system for the study of flocculation under well controlled conditions. In our microfluidic device (μFLOC), floc sizes and growth rates were monitored in real time using high-speed imaging and computational image analysis. The on-line and in situ detection allowed quantification of floc sizes and their growth kinetics. This eliminated the issues of sample handling, sample dispersion, and end-point measurements. We demonstrated the power of this approach by quantifying the growth rates of floc formation under forty different growth conditions by varying industrially relevant flocculating agents (pDADMAC, PEI, PEG), their concentration and dosage. Growth rates between 12.2 μm s−1 for a strongly cationic flocculant (pDADMAC) and 0.6 μm s−1 for a non-ionic flocculant (PEG) were observed, demonstrating the potential to rank flocculating conditions in a quantitative way. We have therefore created a screening tool to efficiently compare flocculating agents and rapidly find the best flocculating condition, which will significantly accelerate early bioprocess development.
1. Introduction
The pressure to decrease operation costs and to increase the efficiency of existing industrial bioprocesses has led to a renewed interest in flocculation.1,2 During flocculation, colloidal particles are selectively aggregated with the aid of a flocculating agent and then subsequently settle under the influence of gravity.3,4 In industrial bioprocesses, this selective removal of key impurities is applied to remove cells and cellular debris from the fermentation medium during primary recovery, i.e. before further purification steps yield the desired product. Intensified fermentation processes have led to higher cell densities, and have thus increased the load on the downstream purification steps, putting higher demands on flocculation as the solid–liquid clarification step. An increased purification performance in a primary recovery step such as flocculation improves the efficacy of all subsequent downstream unit operation steps which in turn lowers the overall operational costs of bioprocesses.5–10Flocculation is a highly dynamic process which is typically initiated with the addition of a flocculating agent, the flocculant, to a suspension. The majority of flocculation processes use a polymeric flocculant, such as polyethylenimine, polyethylene glycol, or chitosan. The flocculant then adsorbs onto the colloidal particles, i.e. in the case of an industrial bioprocess onto the cells and the cellular debris. Once adsorbed, the polymer re-conforms to attain an energy-minimised state with the colloid. As these new individual entities collide with each other, they form larger aggregates called flocs, for example due to charge or bridging effects. Flocs that settle faster facilitate the removal in settlement tanks. It is therefore critical to understand floc growth and the physical characteristics of flocs to enhance removal efficiency. However, these depend on a number of process parameters. The growth rate of the flocs is known to depend strongly on the dosage of the flocculants,2,11,12 on their physical properties, such as charge densities and molecular weight, but also on the properties of the solution they are in, for example its pH and ionic strength.11 Additionally, hydrodynamic shear stress plays an important role in flocculation. Shear stress can affect adsorption and collision rates but can also lead to floc breakage.1,3,11,13 Under turbulent mixing, floc growth and floc breakage are typically in a dynamic equilibrium, and their individual rates are thus difficult to discern.
A variety of analytical methods to size and count flocs have been established. Light microscopy alone,14,15 or enhanced with image processing methods to avoid microscopist bias,16,17 is per se a non-destructive measurement method, yet suffers from the distortion that occurs in the sample preparation stage; flocs must be removed ex situ from the suspension, and thus they aggregate, settle or break before they can actually be sized and counted. This limitation also applies for all electron microscopy methods.18,19 Similarly, methods involving light transmission or scattering offer quick and non-invasive detection of a broad band of floc sizes, but do not allow in situ characterisation and quantification of floc morphology. To monitor flocs in situ, digital image analyses with CCD cameras have been applied, but there are limitations which relate to the magnifications available from the CCD camera lens. Individual particle sensors based either on optical or electrical detection, e.g. the coulter principle,2 are reliable, but the size of the aperture narrows the sizes of flocs that can be detected, and can induce floc breakage itself. Additionally, for electrical detection, flocs must be suspended in an electrolyte solution which itself can impact on the shape and the porosity of the flocs. Light scattering methods apply Lorenz–Mie and Fraunhofer diffraction theory to determine particle size distributions from light signals.11,14,20–22 As they can be implemented with recirculation systems, where a pump flows the flocs from the flocculation vessel to the analytical part and back, they offer continuous monitoring which provides statistical rigor. However, sample dispersion and pumping can affect the floc size, thus these methods are not strictly in situ either. Finally, focused-beam reflectance measurement (FBRM) methods23 are probes that can be directly immersed in a stirred suspended fluid, and thus offer true in situ detection, but require a high particle velocity to produce an optimal detection result. However, in stirred vessels, shear rates vary significantly with location, and it is thus not possible to study floc-growth mechanisms under controlled conditions. To further our understanding of floc-growth mechanisms, there is thus clearly a need for a flocculator capable of operating at steady-state and with a fine control over the flocculation microenvironment, whilst offering both in situ and on-line detection of floc-growth.
In this contribution, we present for the first time a microfluidic approach to analyse flocculation. We hypothesised that the laminar flow conditions afforded by microfluidic devices and their ease of coupling with light microscopy would allow investigation of floc formation and floc growth independent from floc breakage and floc ageing phases. Saccharomyces cerevisiae was selected as a model system due to its widespread use in the biotechnology industry, particularly for the study of flocculation, and several commercially available flocculants were evaluated. To study flocculation growth kinetics in situ and in real-time, the microfluidic device was combined with high-speed imaging and flocculation kinetics were studied for forty different conditions. The growth analysis of individual flocs obtained by this new screening tool, as opposed to the population analysis approach typical of conventional systems, will allow rapid selection of flocculating agents and conditions for early process development, which is relevant for both microbial fermentation21 and mammalian cell processes.24–26
2. Experimental
2.1. Device fabrication
The microfluidic flocculation device (μFLOC) was designed using SolidWorks® (Dassault Systèmes SolidWorks Corporation, USA) and fabricated out of 1.5 mm thick poly(methyl methacrylate) sheet (PMMA, 824-480, RS Components Ltd., UK) using a micro milling machine (Folken IND, USA). The PMMA layers were thermo-compression bonded at 105 °C for 1 hour. Bonding strength was tested as described in O'Sullivan et al., 2012.272.2. Mixing characterisation
Mixing was characterized by analysing a sequence of images taken of a coloured dye when mixing with water. This was performed by injecting a solution of 4 mM Allura Red (Sigma Aldrich, UK) and Milli-Q® water (Millipore Ltd, UK) into the focusing stream and sheath stream inlets, respectively, and vice versa. The μFLOC was placed on a motorised stage of an inverted microscope (Nikon Ti-E, Nikon UK Ltd., UK) equipped with a colour CCD camera (DS Fi-1, Nikon UK Ltd., UK).Bright field images were captured at 30 W illumination (2560 × 1920 pixels) at different locations of the μFLOC and at 10× magnification. A computational script was developed in Python for image analysis, calculating the mixing time based on absorbance values28 (ESI† A). Experiments were performed in triplicates.
2.3. Flocculation of Saccharomyces cerevisiae
| Flocculant | Molecular weight (kDa) | Sizea (nm) | Cationic charge densities (mol%) | Cationic charge densities (mEq g−1) | Supplier |
|---|---|---|---|---|---|
| a Size measured assuming zero charge density.29 Note: PEI – polyethylenimine; PEG – polyethylene glycol; pDADMAC – poly(diallyldimethylammonium chloride). For all flocculants, the concentrations listed represent the concentration of the stock solution. | |||||
| PEI (99% w/v) | 10 | 6 | 20–45 (ref. 30) | 20 (ref. 31) | Alfa Aesar, USA |
| PEI (30% w/v) | 70 | 15.9 | |||
| PEI (30% w/v) | 50–100 | 13.4–19 | |||
| PEG (100% w/v) | 6 | 4.6 | — | — | VWR Chemicals, UK |
| PEG (100% w/v) | 100 | 19 | Alfa Aesar, USA | ||
| pDADMAC (35% w/v) | <100 | <19 | 100 (ref. 29) | 6.2 (ref. 29) | Sigma-Aldrich, UK |
| pDADMAC (20% w/v) | 200–350 | 26.8–35.5 | |||
| pDADMAC (20% w/v) | 400–500 | 37.9–42.4 | |||
2.4. Analytical methods
The μFLOC was connected to the dispersion unit with a 10 cm long PTFE tube (ID = 0.8 mm, S1810-10, Bola, Germany). Samples from the bench-scale studies (section 2.3.4.) were added manually directly into the dispersion unit with the aid of a Pasteur pipette.
Experiments were repeated at least 5 times with each sample being measured three times by the instrument. Floc diameters were calculated using the Fraunhofer model, and reported as calculated averages (volume basis) from the three measurements. Particle size distribution (PSD) is given in % volume. Refractive indices (RI) of 1.59 and 1.33 were used, corresponding to S. cerevisiae homogenate (as for latex particles21) and Milli-Q® water,32 respectively.
The μFLOC was connected to the disposable zeta cell by PTFE tubing (ID = 0.8 mm, S1810-10, Bola, Germany). Fluid flow was stopped prior to the measurements. Samples from the bench-scale studies were manually added into the zeta cell using a Pasteur pipette as in section 2.4.1. Measurements were performed in triplicates, and electrophoretic mobility readings of the instrument indicated that no sedimentation was occurring. Calculations were automatically made using the Zetasizer software 6.20 (Malvern Instruments Ltd., UK).
A computational script was developed for image analysis calculating the area occupied by the flocs (ESI† B). Briefly, the floc-area measured in pixels2 was converted to μm2 and used to determine the equivalent circular diameter. To create PSDs in terms of % volume (to be comparable with the light-scattering instrument), a histogram of the number of flocs was generated. The histogram containing hundred equal-sized bins between 0 μm and the largest particle-size was transformed to a % number. The % number was converted into % volume by multiplying this value by the volume of a sphere at the corresponding particle size (histogram bin size) and the resulting PSDs were plotted using OriginPro 8.6 software (OriginLab Corporation, Massachusetts, USA).
3. Results
3.1. Microfluidic device design
The microfluidic device (μFLOC) was comprised of a ψ-shaped hydrodynamic focussing inlet evolving into a 607 mm long inwards spiralling channel with the width (w) and depth (d) of the channels being 0.5 mm (Fig. 1). The micromachined poly(methyl methacrylate) (PMMA) substrate was sealed with a second PMMA layer with through holes for the inlet and outlet, using thermo-compression bonding. The bond strength was tested to resist up to 1.5 bar, while the theoretical pressure drop within the channels was only around 9.4 mbar. At the flow rates used for flocculation experiments, the calculated mixing time (tmix) and mixing length (zmix) were 7.5 s and 80.3 mm, respectively. | ||
| Fig. 1 Microfluidic flocculation device (μFLOC). Schematic representation of the 607 mm long μFLOC comprising of a ψ-shaped hydrodynamic focussing inlet. The channels have an aspect ratio of 1. The width of the channel after the inlet (w0) is 500 μm. | ||
3.2. Zeta potential analysis
The zeta potential (ζ) analysis of the flocs showed strong similarity between the μFLOC and the bench-scale measurements under varying pH and polyethylenimine (PEI) concentrations (Fig. 2). A decrease in the ζ potential values was observed with increasing pH at both scales for a flocculant concentration of 20 gPEI kg−1packed yeast. From pH 5 to 7.5, the ζ potentials decreased from 20.6 mV to −1.02 mV, and from 16.4 mV to −0.67 mV, in the bench-scale and in the μFLOC, respectively. Over this pH range, there is no parity between the scales, but a good linear correlation (R2 = 0.96). The point of zero mobility falls between pH 7.0 and pH 7.5 (Fig. 2A). At pH 7.4, for varying concentrations of PEI (5–20 gPEI kg−1packed yeast), there is a better linear correlation (R2 = 0.99) between the two ζ potentials (Fig. 2B), and the point of zero mobility lies between 15 gPEI kg−1packed yeast and 20 gPEI kg−1packed yeast. With increasing concentrations of PEI, the ζ potentials increased from −11.4 mV to 1.38 and from −15.7 mV to 1.79 mV in the bench-scale and the μFLOC, respectively. Similar results and correlations of ζ potential values can be found in previously published work.11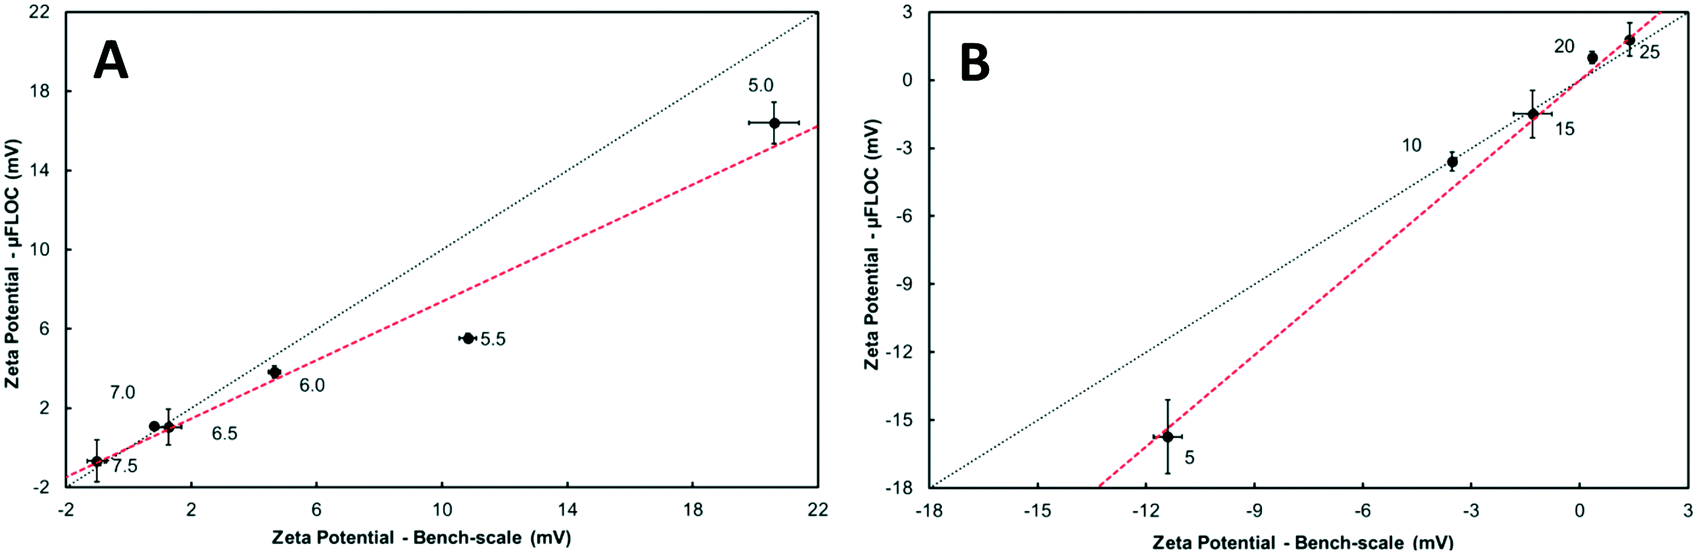 | ||
| Fig. 2 Zeta potential of Saccharomyces cerevisiae in the microfluidic flocculation device (μFLOC) and bench-scale measurements. (A) – Parity analysis between the μFLOC and bench-scale measurements at different values of pH (5–7.5, data labels). The concentration of flocculant, PEI (MW 50–100 kDa), was 20 g kg−1packed yeast. (B) Parity analysis between the μFLOC and bench-scale measurements at pH 7.4 with different concentrations of the flocculant, PEI (MW 50–100 kDa), in the range of 5–20 g kg−1packed yeast (data labels). The dashed lines (red) denote the linear trend line between the two scales. Experiments were performed in triplicates, error bars represent plus or minus one standard deviation. | ||
3.3. Off-line floc size characterisation
Off-line floc size measurements were performed using a laser-scattering instrument (Mastersizer) and compared with bench-scale results (Fig. 3). Two parameters were tested, pH and PEI concentrations (Fig. 3A and B), and their influence was similar in both systems (p ≤ 0.05). The floc size increased in both systems with increasing pH (from 5 to 7.5) observing a similar trend in the d(0.5) (size of a floc which is the 50th percentile of the volume distribution or mass median diameter) and d(0.9) (the size which is the 90th percentile of the volume distribution). However, floc sizes were consistently larger in the μFLOC device, reaching a maximum of 51.6 ± 1.7 μm at pH 7.5, in comparison with 29.4 ± 1.7 μm at the bench-scale (Fig. 3A). | ||
| Fig. 3 Saccharomyces cerevisiae floc size characterisation using laser-scattering in the microfluidic flocculation device (μFLOC) and bench-scale measurements. (A) Particle size variation with pH. The concentration of flocculant, PEI (MW 50–100 kDa), was 20 g kg−1packed yeast. (B) Particle size variation at pH 7.4 with different concentration of the flocculant, PEI (MW 50–100 kDa), in the range of 5–20 g kg−1packed yeast. Error bars represent one standard deviation about the mean of five independent data points (n = 5). (C) Particle size distributions (PSD) of flocs from the μFLOC and bench-scale experiments for 20 gPEI kg−1packed yeast at pH 7.4. | ||
Under varying PEI concentrations (Fig. 3B), a maximum floc size was obtained at 20 gPEI kg−1packed yeast, and pH 7.4, reaching a size of 55.3 ± 6.7 μm and 23.7 ± 1.1 μm, in the μFLOC and bench-scale, respectively.
The particle size distribution (PSD) of both systems was significantly distinct (Fig. 3C). Two different populations can be observed for the bench-scale experiments, one with an average floc size of ∼3 μm and another with an average size of approximately 25 μm. With increasing concentrations of PEI, a shift of the smaller population occurred towards the larger particle size until only one population of flocs was observed (ESI† C). In the μFLOC a single PSD population with a broad size distribution was observed. The PSD did not change significantly with increasing concentrations of PEI (ESI† C).
3.4. Real-time observation of flocs in the μFLOC
The floc characterisation presented in the previous sections was performed with flocs obtained at the outlet of the μFLOC device, i.e. they were likely influenced by sample handling and preparation for the detection with the Mastersizer. To enable in situ floc size measurements and to calculate the growth kinetics of flocs formed in the μFLOC, flocs were imaged via a high-speed camera, at different locations (x1,…x7), i.e. for different mean residence times (Fig. 4A). Floc sizes increased steadily along the microfluidic channel, as seen for example in Fig. 4B for 20 gPEI kg−1packed yeast at pH 7. We then employed the μFLOC and image analysis to measure floc sizes and to quantify floc growth rates for different concentrations of PEI at pH 7.4. The floc sizes ranged from approximately 50 μm (at position x1) to a maximum of approximately 250 μm (Fig. 5). Up to a size of 250 μm, which corresponds to half the channel width, the flocs increased linearly with distance in the channel (with coefficients of determination, R2, approaching 1). Beyond this size, the growth plateaued (Fig. 5B). With increased loading of PEI, the growth rate increased from 3.1 to 8.8 μm s−1 for PEI concentrations of 5 to 25 gPEI kg−1packed yeast. A linear regression thus represents a convenient way to analyse the impact of the flocculating agent on floc growth. | ||
| Fig. 4 (A) Photograph of the microfluidic flocculation device (μFLOC) filled with coloured dyes showing the seven positions where flocs were imaged along the channel. The x positions from the point of confluence (x = 0 mm) are x1 = 14, x2 = 143, x3 = 259, x4 = 363, x5 = 454, x6 = 533, and x7 = 599 mm. (B) S. cerevisiae flocs formed along the μFLOC, from x2 to x7. Images were taken at 2000 fps and 16.67 μs exposure time. Scale bars represent 50 μm. | ||
 | ||
| Fig. 5 Saccharomyces cerevisiae flocs in the μFLOC for different concentrations of flocculant (PEI) at pH 7.4. (A) Particle size distributions (PSD) of S. cerevisiae flocs in the presence of 5, 15 and 25 g kg−1packed yeast of PEI (MW 50–100 kDa). (B) Floc growth recorded along the length of the μFLOC for different imaging positions (x1,…x7) and different concentrations of PEI, i.e. 5 (green), 15 (purple) and 25 (red) gPEI kg−1packed yeast. The data points represent the average of the d(0.9) flocs. Full lines represent linear regression (R2 > 0.97 for all three concentrations) which are a convenient way to analyse floc growth. Growth of flocs plateaued as the particle sizes approached 250 μm; dashed vertical and dashed horizontal lines indicate the points where complete mixing is achieved and half of the channel width (250 μm), respectively. Error bars represent one standard deviation about the mean of five independent data points (n = 5). The data points shown within the box with black lines correspond to the d(0.9) values of the PSD in (A). | ||
3.5. Floc growth kinetics with different flocculants
To further evaluate the utility of μFLOC, we studied the impact of different flocculating agents on floc-growth in the device. For this set of experiments, we exposed the yeast homogenate to the cationic flocculants poly(diallyldimethylammonium chloride) (pDADMAC) and PEI, and to the non-ionic flocculant polyethylene glycol (PEG). Different molecular weights and different concentrations were applied for each of the three flocculants. The results of the 40 different conditions and the corresponding measured growth rates are summarised in Table 2. The choice of flocculating agent, molecular weight and concentration all had their influence on growth rates. Higher rates were obtained at high flocculant concentrations and higher molecular weight, reaching a maximum of 12.2 μm s−1 with pDADMAC (400–500 kDa), at 25 gpDADMAC kg−1packed yeast. At this concentration, the floc sizes attained a plateau at 200 μm. A solution of branched PEI with a broad molecular weight range (500–100 kDa) showed the highest growth rate (8.8 μm s−1 at 25 gPEI kg−1packed yeast) in comparison with two other linear PEI flocculants of molecular weights 10 kDa (3.1 μm s−1 at 15 gPEI kg−1packed yeast) and 70 kDa (5.6 μm s−1 at 25 gPEI kg−1packed yeast). PEG, a non-ionic polymer, did not follow this trend. The maximum growth rate observed, 0.6 μm s−1, was obtained using 100 KDa PEG at 25 gPEG kg−1packed yeast.| Flocculant | Flocculation growth rate (μm s−1) | |||||
|---|---|---|---|---|---|---|
| Flocculant concentrations (gflocculant kg−1packed yeast) | ||||||
| PEG – polyethylene glycol, PEI – polyethylenimine, pDADMAC – poly(diallyldimethylammonium chloride).a The growth rate of 0 μm s−1 indicates that an increase in floc size was not observed. | ||||||
| Mol. wt (kDa) | 5 | 10 | 15 | 20 | 25 | |
| PEG | 6 | 0.3 | 0a | 0a | 0.5 | 0.2 |
| 100 | 0a | 0a | 0a | 0a | 0.6 | |
| PEI | 10 | 1.5 | 2.9 | 3.1 | 3.1 | 2.6 |
| 70 | 3.0 | 4.5 | 4.3 | 3.9 | 5.6 | |
| 50–100 | 3.1 | 4.9 | 6.5 | 6.0 | 8.8 | |
| pDADMAC | <100 | 3.6 | 1.3 | 5.1 | 6.9 | 7.6 |
| 200–350 | 0.4 | 3.2 | 8.3 | 10.7 | 8.1 | |
| 400–500 | 4.5 | 3.8 | 10.2 | 9.3 | 12.2 | |
4. Discussion
We set out to develop a platform to study flocculation by integrating high-speed imaging and computational analysis with a microfluidic device. Microfluidic devices nowadays are well-established experimental tools for process characterisation due to the precise control over the microenvironment and the possibility to integrate analytical tools.33–36 These systems have been used extensively to study upstream bioprocessing steps,37–41 but the number of reports of microfluidic devices developed to study process optimisation of downstream processing steps, such as purification and separation of biomolecules, is still limited.27,42–48 In downstream bioprocessing, flocculation has attracted renewed interest but suitable analytical tools to comprehensively understand the flocculation mechanism have been absent. The precise control over the microenvironment afforded by microfluidic devices opened up an opportunity to investigate, for the first time, the formation and growth of flocs independently from floc breakage and ageing phases.Yeast homogenate and flocculant were brought into contact in a controlled way in the microfluidic flocculation device (μFLOC) by hydrodynamic focussing, with the flocs growing in the long spiral-shaped channel (Fig. 1). Fresh flocculant molecules were constantly supplied from the sheath flow streams to the centre stream wherein the floc-growth occurred. The spiral-shaped channel had a relatively large cross-sectional area with an aspect ratio of 1 thus avoiding restrictions on floc-growth, for example due to channel walls, during the floc-formation and early growth phase. Dean numbers (De) calculated for the μFLOC varied from 0.008 (spiralling channel close to the outlet, radius of 10 mm) to 0.011 (close to the inlet, radius of 21 mm), thus the effect from Dean flow was negligible.49 Furthermore, the compact footprint afforded by the spiralling channel facilitated the coupling with light microscopy, enabling the visual observation of floc-formation and growth as the flocs travelled along the channel (Fig. 4).
Validation experiments performed with the μFLOC showed a decrease in the ζ potential with increasing pH values. This indicated that the configuration of polyethylenimine (PEI) strands became more energy stabilised as the pH shifted from 5 to 7.5,50,51 enhancing the rate of flocculation at near-zero mobility (Fig. 2). (Energy stabilisation is the relaxation or re-conformation of an already adsorbed flocculant; it has a significant effect on flocculation rates and determines whether charge neutralisation or polymer-bridging is the dominant mechanism50). This is also supported by the increasing floc sizes (Fig. 3A). This energy stabilisation of PEI leads to an increase in the electrostatic attraction in the microenvironment and higher surface site coverage, thereby enhancing the rate of flocculation. An exact parity was not observed between the μFLOC and bench-scale experiments, for both pH and PEI. Lower ζ potentials were observed in the μFLOC and can be attributed to either the difference in the measurement setup or the difference in the concentration profiles of flocculants in the liquid bulk. For the former, samples from the bench-scale were manually added with a Pasteur pipette, whereas the outlet of the μFLOC was connected directly to the cuvette in the Zetasizer, preventing sedimentation of the flocs in the measurement cuvette. Furthermore, a focussed flow within the μFLOC which leads to the formation of larger flocs could have led to the depletion of the cationic flocculants in the bulk. In contrast, higher ζ potential values were consistently recorded at the bench-scale. A uniform mixing homogeneity leading to the formation of smaller flocs may have resulted in a higher concentration of cationic flocculant in the liquid bulk. Even though these are possible explanations for the lack of exact parity, it should be noted that there is a strong linear correlation between the μFLOC and the bench-scale experiments for both pH and PEI. There is thus no other effect apart from pH and flocculant dosage that affects the ζ potential, underlining the validity of the microfluidic approach to analyse flocculation.
Higher floc sizes were observed in the μFLOC compared to the bench-scale, which agrees with the lower zeta potential in the μFLOC (Fig. 3). This can also be attributed to negligible breakage in the μFLOC device, indicated by the low shear rate (80 s−1; ESI† D) as compared to values typically encountered in batch flocculation systems, such as systems comprising of a 6-blade Rushton turbine (>200 s−1).21 After mixing, all the PEI strands are bound to the yeast homogenate particles. This results in a prolonged growth phase which ultimately leads to the formation of larger particles without the flocs suffering breakage (for the PSDs of flocs measured in situ in the μFLOC see ESI† E). This is further corroborated by the plateauing observed in particle size at approx. 250 μm, when the flocs in the μFLOC were monitored by image analysis (Fig. 5). Flocs larger than 250 μm were exposed to increasing shear rates closer to the walls, and hence growth continued only in the direction of the flow (ESI† D). Floc sizes above 300 μm were therefore disregarded from the growth kinetics calculations. Similarly, a filter was implemented for flocs smaller than 5 μm to facilitate image analysis.
Two distinct size populations were seen in the PSD in the bench-scale, with the floc population at 3 μm shifting towards the larger floc population with increasing PEI concentration (Fig. 3C). From a flocculation point of view, this indicates a reduction in the charge-imbalance between the cationic polymer and anionic cell homogenate.11,50,52 The shift in the PSD peaks also demonstrates the change in the flocculation mechanism.52 A low surface site coverage of the colloidal particles by the flocculant (5–15 g kg−1packed yeast) leads to the destabilisation of the particles, whereas at higher surface site coverage (at 20–25 g kg−1packed yeast), the colloidal particles are sterically stabilised. In contrast, the presence of only a single size (mono-modal) population in the μFLOC can be attributed to a nucleation zone near the centre of the channel formed by the hydrodynamic focussing. This yields a high-concentration region of oppositely charged particles increasing the proximity between the flocculant and the yeast homogenate. Furthermore, the presence of convective forces (Pe = 2500) facilitates the adsorption of flocculants onto the cell suspension in this nucleation zone. There were no other observable effects within the current device & buffer system that affected the zeta potential of flocs, underlining the validity of the μFLOC to analyse flocculation.
Flocculation growth rates are known to be influenced by the charge density, concentration and molecular weight of the flocculant. In particular, the charge density decides the optimum dosage concentration for the charge neutralisation mechanism and typically, concentrations of 0.1 to 0.2 mg L−1 are used,29 while the molecular weight of the polymer influences the polymer bridging mechanism. PEI carries a high cationic charge density53 and is affected by the pH and the ionic strength of the aqueous medium.31,51,54 pDADMAC has a higher cationic charge density than PEI, having a value of 100 mol%.29 PEG, on the contrary, is a non-ionic polymer and its action is attributed to its capability to alter the interactions of cells and proteins with water, and also between each other.55 Therefore, one would expect the highest growth rates for pDADMAC, followed by PEI, with little growth when PEG is used.
Forty different conditions were evaluated with the μFLOC. As can be seen from Table 2, the highest growth rates in the μFLOC were measured for pDADMAC, followed by PEI. No growth or low growth rates were recorded for PEG. Furthermore, in general, when the dosage was increased a higher growth rate was detected. The growth rates measured with the μFLOC are therefore consistent with the effects of charge density, concentration and molecular weight of the flocculant. In some cases, for example for PEI (10 kDa) and pDADMAC (200–350 kDa), increasing the concentration of the flocculant above 20 gflocculant kg−1packed yeast did not yield a higher growth rate, revealing the optimal point of flocculation. Addition of flocculants beyond the optimal level hinders the flocculation process, due to charge imbalance and electrostatic repulsion between the excess flocculants and the ones adsorbed. The μFLOC thus allows rapid and inexpensive screening of new flocculants and cell suspensions, and offers growth-kinetics based ranking of flocculating conditions in a quantitative way.
In the future, this device could also be employed to further our model understanding of flocculation and colloidal science.56 The most widely used model for flocculation is the classical expression of Smoluchowski's equation4,57,58 for hetero-aggregation. This expression is governed by two aspects, perikinetic (due to Brownian motion and diffusive adsorption, leading to attachment) and orthokinetic flocculation (transport of flocculants due to shear). While solving the classical form of the Smoluchowski's equation, one typically assumes that a) the collision efficiency is equal to unity (i.e. any collision between two particles will lead to the formation of an aggregate), b) flow is laminar (laminar shear stress profile), c) floc breakage does not occur, d) all particles are monodisperse, e) all particles are spherical, and f) collision occurs only between two particles.4,59 By isolating floc growth from breakage with the μFLOC, we have developed a device for which the assumptions a) to c) hold. The other assumptions are particle specific and are difficult, if not impossible to fulfill with biological systems. By implementing additional monitoring capabilities, such as in situ dynamic light scattering (DLS), floc sizes (and their aggregation) in the micron and sub-micron range, i.e. in the range of particle sizes for which models based on the Smoluchowski's equation have typically been applied (primary flocculation phase), could be detected. For larger floc sizes, i.e. the secondary flocculation phase, current models are typically limited to extrapolating from Smoluchowski's model, using for example population balancing methods. With our device, however, we do not have to resort to such approaches, since floc growth kinetics for floc sizes above 50 μm are directly accessible. Thus, with additional detection capabilities, the μFLOC could be employed to describe and verify models for both primary and secondary flocculation phases.
5. Conclusions
We successfully developed for the first time a microfluidic device for flocculation analysis, the μFLOC, and we have shown for the first time on-line and in situ detection and quantification of floc sizes and of growth kinetics of floc formation. Real-time monitoring of floc formation was enabled by combining the μFLOC with high-speed imaging and related image processing. The obtained time-course values for floc formation represents a degree of monitoring not attainable with traditional macroscopic systems, which rely on sample dispersion and sample handling steps, and largely depend on end-point measurements. The fine control over the fluid flow afforded by microfluidics facilitated the observation of individual flocs, decoupled the growth phase from the breakage phase of flocs, and therefore enabled quantification of flocculation growth. The μFLOC was challenged with a set of industrially relevant flocculation agents to study the impact of charge density, molecular weight and concentration on the flocculation in forty different growth conditions.We have therefore established and characterised a new screening tool for the rapid and cost-effective analysis of flocculation processes from tiny amounts of flocculating reagents and cell material. This novel tool enables both the rapid testing of new flocculant formulations and the determination of process conditions to achieve rapid and effective flocculation, which thus far has been a tedious and expensive task for bioprocess engineers. Only one flow rate was required to evaluate forty different growth conditions, yet flow rates could easily be changed to analyse a broader range of flocculating agents, conditions and shear rates (for example to promote floc breakage). Measuring the sizes of the sub-micron particles in the sample suspension, a critical feature to fully understand flocculation processes, is currently outside the detection limit of the developed optical methodology, but could be implemented by incorporating an in situ dynamic light scattering (DLS) technique with our device. This may then also open the opportunity to derive more accurate mechanistic models of flocculation. In the future, we envisage that this tool will be employed to rapidly establish a ranking of different flocculation conditions for microbial fermentation and mammalian cell cultures, which can then subsequently be verified at larger scales.
Conflicts of interest
There are no conflicts of interest to declare.Acknowledgements
The authors acknowledge the Biological Sciences Research Council (BBSRC, BB/L000997/1) for funding and the UCL Overseas Research Scholarship program and the Peter Dunnill Scholarship Fund for providing funding for Anand Radhakrishnan's PhD studentship. The Engineering and Physical Sciences Research Council (EPSRC Instrument Pool) is acknowledged for the loan of the high-speed camera. The authors would like to thank Dr Jonathan Skelton for his help in the development of the computational code and Prof Michael Hoare for his valuable suggestions and comments to the manuscript.References
- N. B. Wyatt, T. J. O'Hern, B. Shelden, L. G. Hughes and L. A. Mondy, Biotechnol. Bioeng., 2013, 110, 3156–3163 CrossRef CAS PubMed.
- S. Mondal, Y. K. Leong, J. L. Liow and S. R. Wickramasinghe, Powder Technol., 2013, 235, 426–430 CrossRef CAS.
- V. K. La Mer and R. H. Smellie Jr., Clays Clay Miner., 1960, 9, 295–314 Search PubMed.
- D. N. Thomas, S. J. Judd and N. Fawcett, Water Res., 1999, 33, 1579–1592 CrossRef CAS.
- D. E. Salt, S. Hay, O. R. T. Thomas, M. Hoare and P. Dunnill, Enzyme Microb. Technol., 1995, 17, 107–113 CrossRef CAS.
- A. Berrill, S. V. Ho and D. G. Bracewell, Biotechnol. Prog., 2008, 24, 426–431 CrossRef CAS PubMed.
- P. Milburn, J. Bonnerjea, M. Hoare and P. Dunnill, Enzyme Microb. Technol., 1990, 12, 527–532 CrossRef CAS PubMed.
- R. M. Cordes, W. B. Sims and C. E. Glatz, Biotechnol. Prog., 1990, 6, 283–285 CrossRef CAS PubMed.
- G. B. Habib, I. Holwill and M. Hoare, J. Biotechnol., 1997, 59, 91–101 CrossRef CAS.
- S. R. Wickramasinghe, Y.-K. Leong, S. Mondal and J.-L. Liow, Adv. Powder Technol., 2010, 21, 374–379 CrossRef CAS.
- D. E. Salt, A. C. Bentham, S. Hay, A. Idris, J. Gregory, M. Hoare and P. Dunnill, Bioprocess Eng., 1996, 15, 71 CrossRef CAS.
- P. Narong and A. E. James, Colloids Surf., A, 2006, 274, 130–137 CrossRef CAS.
- J. Gregory, Colloids Surf., 1988, 31, 231–253 CrossRef CAS.
- G. Espuny Garcia del Real, J. Davies and D. G. Bracewell, Biotechnol. Bioeng., 2014, 111, 2486–2498 CrossRef CAS PubMed.
- L. Sadasivan and C. A. Neyra, J. Bacteriol., 1985, 163, 716–723 CAS.
- A. Vicente, J. M. Meinders and J. A. Teixeira, Biotechnol. Bioeng., 1996, 51, 673–678 CrossRef CAS PubMed.
- M. Zelger, S. Pan, A. Jungbauer and R. Hahn, Process Biochem., 2016, 51, 1610–1621 CrossRef CAS.
- S. Sharma, C.-L. Lin and J. D. Miller, Miner. Eng., 2017, 101, 20–29 CrossRef CAS.
- R. Kothari, V. V. Pathak, A. Pandey, S. Ahmad, C. Srivastava and V. V. Tyagi, Bioresour. Technol., 2017, 225, 84–89 CrossRef CAS PubMed.
- Y. Zhou and G. V. Franks, Langmuir, 2006, 22, 6775–6786 CrossRef CAS PubMed.
- A. Chatel, P. Kumpalume and M. Hoare, Biotechnol. Bioeng., 2014, 111, 913–924 CrossRef CAS PubMed.
- N. B. Wyatt, L. M. Gloe, P. V. Brady, J. C. Hewson, A. M. Grillet, M. G. Hankins and P. I. Pohl, Biotechnol. Bioeng., 2012, 109, 493–501 CrossRef CAS PubMed.
- R. Ferron and S. Shah, Transp. Res. Rec., 2010, 2141, 89–91 CrossRef CAS.
- Y. K. Kang, J. Hamzik, M. Felo, B. Qi, J. Lee, S. Ng, G. Liebisch, B. Shanehsaz, N. Singh, K. Persaud, D. L. Ludwig and P. Balderes, Biotechnol. Bioeng., 2013, 110, 2928–2937 CrossRef CAS PubMed.
- N. Singh, K. Pizzelli, J. K. Romero, J. Chrostowski, G. Evangelist, J. Hamzik, N. Soice and K. S. Cheng, Biotechnol. Bioeng., 2013, 110, 1964–1972 CrossRef CAS PubMed.
- S. Akeprathumchai, B. Han, S. R. Wickramasinghe, J. O. Carlson, P. Czermak and K. Preiβ, Biotechnol. Bioeng., 2004, 88, 880–889 CrossRef CAS PubMed.
- B. O'Sullivan, H. Al-Bahrani, J. Lawrence, M. Campos, A. Cázares, F. Baganz, R. Wohlgemuth, H. C. Hailes and N. Szita, J. Mol. Catal. B: Enzym., 2012, 77, 1–8 CrossRef.
- M. H. V. Werts, V. Raimbault, R. Texier-Picard, R. Poizat, O. Français, L. Griscom and J. R. G. Navarro, Lab Chip, 2012, 12, 808 RSC.
- B. Bolto and J. Gregory, Water Res., 2007, 41, 2301–2324 CrossRef CAS PubMed.
- J. Suh, H.-J. Paik and B. K. Hwang, Bioorg. Chem., 1994, 22, 318–327 CrossRef CAS.
- M. Neu, D. Fischer and T. Kissel, J. Gene Med., 2005, 7, 992–1009 CrossRef CAS PubMed.
- A. D. Anastasiou, C. Makatsoris, A. Gavriilidis and A. A. Mouza, Exp. Therm. Fluid Sci., 2013, 44, 90–99 CrossRef CAS.
- M. P. C. Marques and P. Fernandes, Molecules, 2011, 16, 8368–8401 CrossRef CAS PubMed.
- M. R. Leyden, R. J. Messinger, C. Schuman, T. Sharf, V. T. Remcho, T. M. Squires and E. D. Minot, Lab Chip, 2012, 12, 954–959 RSC.
- Q.-S. Kang, X.-F. Shen, N.-N. Hu, M.-J. Hu, H. Liao, H.-Z. Wang, Z.-K. He and W.-H. Huang, Analyst, 2013, 138, 2613–2619 RSC.
- N. Jaccard, R. J. Macown, A. Super, L. D. Griffin, F. S. Veraitch and N. Szita, J. Lab. Autom., 2014, 19, 437–443 CrossRef PubMed.
- D. Schäpper, M. N. H. Z. Alam, N. Szita, A. Eliasson Lantz and K. V. Gernaey, Anal. Bioanal. Chem., 2009, 395, 679–695 CrossRef PubMed.
- A. Zanzotto, N. Szita, P. Boccazzi, P. Lessard, A. J. Sinskey and K. F. Jensen, Biotechnol. Bioeng., 2004, 87, 243–254 CrossRef CAS PubMed.
- T. V. Kirk and N. Szita, Biotechnol. Bioeng., 2013, 110, 1005–1019 CrossRef CAS PubMed.
- M. J. Davies, D. N. Nesbeth and N. Szita, Chim. Oggi, 2013, 31, 46–49 CAS.
- P. Gruber, M. P. C. Marques, P. Sulzer, R. Wohlgemuth, T. Mayr, F. Baganz and N. Szita, Biotechnol. J., 2017, 1600475 CrossRef PubMed.
- M. S. Shapiro, S. J. Haswell, G. J. Lye and D. G. Bracewell, Biotechnol. Prog., 2009, 25, 277–285 CrossRef CAS PubMed.
- J. Wen, E. W. Wilker, M. B. Yaffe and K. F. Jensen, Anal. Chem., 2010, 82, 1253–1260 CrossRef CAS PubMed.
- H. Yang, J. M. Mudrik, M. J. Jebrail and A. R. Wheeler, Anal. Chem., 2011, 83, 3824–3830 CrossRef CAS PubMed.
- N. Assmann, A. Ładosz and P. Rudolf von Rohr, Chem. Eng. Technol., 2013, 36, 921–936 CrossRef CAS.
- J. Huft, C. A. Haynes and C. L. Hansen, Anal. Chem., 2013, 85, 2999–3005 CrossRef CAS PubMed.
- P. Vázquez-Villegas, E. Ouellet, C. González, F. Ruiz-Ruiz, M. Rito-Palomares, C. A. Haynes and O. Aguilar, Lab Chip, 2016, 16, 2662–2672 RSC.
- M. P. C. Marques and N. Szita, Curr. Opin. Chem. Eng., 2017, 18, 61–68 CrossRef PubMed.
- D. Di Carlo, D. Irimia, R. G. Tompkins and M. Toner, Proc. Natl. Acad. Sci. U. S. A., 2007, 104, 18892–18897 CrossRef CAS PubMed.
- J. Gregory and S. Barany, Adv. Colloid Interface Sci., 2011, 169, 1–12 CrossRef CAS PubMed.
- R. Mészáros, I. Varga and T. Gilányi, Langmuir, 2004, 20, 5026–5029 CrossRef.
- S. Barany and A. Szepesszentgyörgyi, Adv. Colloid Interface Sci., 2004, 111, 117–129 CrossRef CAS PubMed.
- M. X. Tang and F. C. Szoka, Gene Ther., 1997, 4, 823–832 CrossRef CAS PubMed.
- Z. R. Amin, M. Rahimizadeh, H. Eshghi, A. Dehshahri and M. Ramezani, Iran. J. Basic Med. Sci., 2013, 16, 150–156 Search PubMed.
- J. Israelachvili, Proc. Natl. Acad. Sci. U. S. A., 1997, 94, 8378–8379 CrossRef CAS.
- J. C. Berg, An Introduction to Interfaces & Colloids: The Bridge to Nanoscience, World Scientific Publishing Co. Pte. Ltd., New Jersey, 2010 Search PubMed, illustrate.
- K. Rahn-Chique, A. M. Puertas, M. S. Romero-Cano, C. Rojas and G. Urbina-Villalba, Adv. Colloid Interface Sci., 2012, 178, 1–20 CrossRef CAS PubMed.
- S. K. Friedlander and C. S. Wang, J. Colloid Interface Sci., 1967, 24, 170–179 CrossRef.
- S. R. Wickramasinghe, B. Han, S. Akeprathumchai, A. Jaganjac and X. Qian, Powder Technol., 2005, 156, 146–153 CrossRef CAS.
Footnotes |
| † Electronic supplementary information (ESI) available. See DOI: 10.1039/c7lc00793k |
| ‡ Current affiliation: Department of Chemical Engineering, University College London, Torrington Place, London WC1E 7JE, UK. |
| This journal is © The Royal Society of Chemistry 2018 |