 Open Access Article
How many ritonavir cases are there still out there?
Marcus A.
Neumann
* and
Jacco
van de Streek

Avant-garde Materials Simulation, Alte Str. 2, 79249 Merzhausen, Germany. E-mail: marcus.neumann@avmatsim.eu
First published on 17th May 2018
Abstract
Based on a thorough and critical analysis of the commercial crystal structure prediction studies of 41 pharmaceutical compounds, we conclude that for between 15 and 45% of all small-molecule drugs currently on the market the most stable experimentally observed polymorph is not the thermodynamically most stable crystal structure and that the appearance of the latter is kinetically hindered.
Introduction
In the summer of 1998, the sudden appearance of a previously unknown and significantly more stable polymorph of ritonavir halted the production of Norvir capsules: because the new crystal form was significantly more stable, the compound had turned nearly insoluble and therefore largely inactive when taken orally.1 Moreover, being thermodynamically more stable, the presence of the new form now made it impossible to obtain the old form, in what turned out to be one of the most infamous cases of a “disappearing polymorph”.2 The estimated cost of 250 million USD in lost revenue made the ritonavir incident a high-profile case, but it certainly was not an isolated case. Bučar et al.3 describe more than ten additional cases, including rotigotine and ranitidine hydrochloride. These disasters highlight how a thermodynamically unstable crystal structure can be kinetically stable for years. This begs the question of whether any of the drugs currently sold or under development have as-yet undiscovered more stable polymorphs. Ritonavir, rotigotine and ranitidine hydrochloride had been under development for years without a trace of the more stable polymorphs, demonstrating that it is impossible for any approach relying solely on experiments to exclude possible kinetic factors.Crystal structure prediction (CSP) attempts to give an overview of all relevant polymorphs based solely on their thermodynamic stability, i.e. irrespective of possible kinetic considerations. It therefore comes as no surprise that the pharmaceutical industry is adopting a combination of experimental and computational polymorph screens to prevent disappearing polymorph accidents in the future.4
This, then, suggests an obvious approach to our question “How many ritonavir cases are there still out there?”: use CSP to process a large number of small molecules with at least one known crystal structure and count in how many cases, according to the CSP results, the thermodynamically most stable crystal form has been missed.
It is not that straightforward, however. First, the answer to our question requires statistics over a significant number of compounds, not merely a case study. Second, the compounds must be relevant for the problem at hand: pharmaceutical compounds tend to be large and flexible, whereas most published CSP studies report results for small compounds of limited flexibility. Third, a thorough experimental polymorph screen must have been conducted for each of the compounds to ensure that missed polymorphs are due to consistently hindered kinetics and not merely a one-off. Fourth, the error bars on the lattice energies of the CSP studies must be known (or, as a minimum, a reasonable estimate must be available) to distinguish between those cases where the prediction of a thermodynamically more stable form is due to a missed experimental form and those cases where the prediction of a thermodynamically more stable form is merely caused by an incorrect assessment of the relative stabilities of the predicted crystal structures by the energy potential used. Fifth, the structure generation step must be complete enough to render statistics regarding the possibility of additional polymorphs meaningful.
To assess the feasibility of current CSP methodologies to answer the question in the title, it pays to take a closer look at the results of the periodically published crystal structure prediction blind tests. CSP blind tests have been organised in 1999, 2001, 2004, 2007, 2010 and 2015. The results can be found in the most recent publication5 and references therein. For each blind test, crystallographers are invited to submit unpublished experimental crystal structures, the molecular 2D diagrams for which are then sent out to the participants together with a deadline for the submission of their predictions. The target crystal structures are guaranteed to be free from disorder and certain limits on the chemical elements, space-group symmetry and number of molecules in the asymmetric unit are also specified. After the submission deadline, the experimental crystal structures are made public and the computational results are published in a joint publication. In earlier blind tests, the compounds were small, rigid, neutral molecules, but the compounds became increasingly more complex as time progressed (and methods improved). For the purpose of our discussion, we will focus on two aspects: the results for all small, rigid, neutral molecules and the results of the most recent (2015) blind test.5
In gathering our statistics for large, flexible molecules, we are hampered by three error sources that may be hard to disentangle: the error bars on the lattice energies, the completeness of the computational structure generation step and the completeness of the experimental polymorph screen (which we presume to be hindered by kinetics). When investigating the relationship between ease of crystallisation and molecular descriptors, it was found that the smaller and the more rigid a molecule, the easier it crystallises.6 For small, rigid, neutral molecules we can therefore expect both the computational and the experimental polymorph screens to be essentially complete, at least significantly more complete than those for large, flexible molecules. So as a first approximation we can make the assumption that the number of missed most stable polymorphs for small, rigid, neutral molecules (both computationally and experimentally) is equal to zero, and consequently any discrepancies between the experimental and the predicted results can be attributed solely to shortcomings in the energy potential. The results for all small, rigid, neutral CSP blind test molecules should therefore tell us something about the error bar on our energy potential. Focussing exclusively on the results obtained with our own method, the results are reported in four papers7–10 and in total provide data for 17 small molecules. All 17 experimental target structures were successfully located in the structure generation steps. Thirteen times an experimental structure is identified as the global minimum, three times an experimental structure is ranked second and once an experimental structure is fourth in the list of predicted structures. The energy differences between the predicted polymorphs are very small, of the order of 0.1 kcal mol−1, suggesting error bars for our energies of the order of 0.1 kcal mol−1 for small, rigid, neutral molecules. However, although these results provide a lower limit for the estimated standard deviation of our energy function, small, rigid, neutral molecules are not what we are interested in. In order to answer our question in the title, we must establish how current methods perform for compounds that reflect the complexities of pharmaceutically active molecules.
The most recent CSP blind test featured four target compounds of a complexity approaching that found in pharmaceutical compounds (Fig. 1). For targets XXIV, XXV and XXVI (the molecules have been numbered consecutively since the first blind test in 1999), one polymorph is known, each with one molecule in the asymmetric unit. For target XXIII, five polymorphs are known, of which two contain two molecules in the asymmetric unit. Twenty-five research groups participated in the blind test, providing a good overview of the state-of-the-art in molecular crystal structure prediction. First, let’s take a look at the results of the other 24 participants, keeping in mind the requirements that will lead us to our goal of using the state-of-the-art in molecular crystal structure prediction to answer the question in the title. Of these 24 participants, four did not have access to a structure generation tool of their own and relied on the list of generated structures of one of the other participants. Of the remaining 20 participating research groups (still excluding our own contribution), only seven attempted all four compounds, and only two attempted the difficult Z′ = 2 polymorphs. In other words, of the 24 research groups involved in the development of methods for crystal structure prediction, only two submitted candidate structures for target molecule XXIII with two molecules in the asymmetric unit. Adding together all polymorphs, eight distinct experimental structures should be found for these four compounds. The best results were obtained by the research group of Prof. Price, who were the only group to successfully predict four of the eight crystal structures, including one of the two Z′ = 2 polymorphs. The latest CSP blind test therefore paints a very sobering picture: large-scale prediction of the crystal structures of large, flexible molecules with one and two molecules in the asymmetric unit is hard and is currently beyond the capability of most CSP methods, either due to limitations in the available hardware or due to limitations in the available software. In addition, the blind test compounds, with the exception of molecule XXIII, have not been experimentally screened for polymorphism.
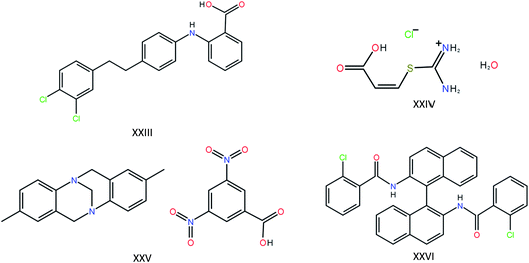 | ||
| Fig. 1 The four large and flexible chemical compounds that were provided as targets in the last crystal structure prediction blind test. | ||
The results with our in-house developed software for crystal structure prediction and our in-house hardware were more promising: seven of the eight experimentally observed crystal structures were generated in our searches, missing out only one of the more challenging Z′ = 2 targets. Furthermore, the compounds we are sent to investigate have always been thoroughly experimentally screened. These results should stand us in good stead to use our crystal structure prediction technology to address the question in the title: “How many ritonavir cases are there still out there?”.
Methods
Software
The CSP studies were carried out with the software package GRACE.11 Conceptually, a CSP study consists of two steps: the crystal structure generation step, which attempts to generate all relevant polymorphs, and the stability ranking step, which attempts to predict the relative thermodynamic stability of each generated polymorph. The way GRACE was designed is more easily understood if the ranking is described first.Energy potential
In GRACE, the thermodynamic stability of a crystal structure is approximated as its enthalpy, U + PV. In other words, the temperature is set to 0. At ambient pressure, PV is negligible and set to 0. U is calculated using density functional theory (DFT) with the software package VASP.12–14 Zero-point vibrations are not included. Even though our lattice energies are calculated in the classical 0 K approximation, for instances in which the predictions suggest the possibility of disorder, the configurational entropy at 300 K is included. The exchange–correlation functional used is the PBE functional15 with a plane-wave basis set with an energy cut-off of 520 eV and an approximate k-point spacing of 0.07 Å−1. The core electrons are described by projector-augmented wave (PAW) pseudo-potentials. Dispersion correction is indispensable for molecular crystals. VASP is only used for pure DFT calculations, to which GRACE adds a dispersion correction; the combination of DFT with a dispersion correction is referred to as DFT-D. Two choices for the dispersion correction are currently implemented in GRACE: Neumann & Perrin16 and Grimme 2010.17 The results in the crystal structure prediction blind tests and the results reported in the current paper were obtained with the Neumann & Perrin dispersion correction. Further details can be found elsewhere.16The last CSP blind test revealed that one group had succeeded in the development of a more accurate method for the energy ranking of molecular crystals.18 The new method, here called PBE(0) + MBD + Fvib, combines energy calculations with the PBE functional with a method for the calculation of Many-Body Dispersion (MBD), a PBE0 correction to include exact exchange and a calculation of the vibrational free energy in the harmonic approximation. By comparison with PBE(0) + MBD + Fvib we will assess the energy error of our own energy potential.
Structure generation and tailor-made force fields
DFT-D is too slow to be used in structure generation, which can involve generating millions and millions of trial crystal structures. An off-the-shelf force field can be used, but that approach would have two disadvantages. First, the large estimated standard deviation between DFT-D and the force field means that very many of the generated structures must be optimised to ensure that the global minimum (in the DFT-D potential) has been optimised. Second, the force field might be so poor for the compound under consideration that none of the local minima in the force field optimise to the polymorph of interest during the ranking stage. In GRACE, this is solved by parameterising a tailor-made force field (TMFF) for the compound under consideration, i.e. a force field that is not transferable but in which all force-field parameters have been optimised for that one particular compound. The reference data against which the force-field parameters are fitted are generated with the DFT-D potential. In other words, the tailor-made force field is parameterised to mimic the DFT-D potential. A detailed description of the reference data and the fitting process are published elsewhere.19 Larger molecules are divided up into smaller fragments that are parameterised individually and from which the tailor-made force field of the original compound is assembled afterwards, ensuring that tailor-made force fields can be prepared for molecules of virtually any size.The crystal structure generation algorithm is described in some detail elsewhere.20 In brief, a parallel-tempering algorithm is used for a given number of space groups with a fixed number of molecules in the asymmetric unit. Crystal structures are generated in an energy window equal to four times the estimated standard deviation of the tailor-made force field with respect to the DFT-D energies. During the search, the completeness is estimated by counting how often each unique structure has been generated, and the search is continued until it is estimated that 99% of the structures in the search space have been generated.
Search space
The space groups and the Z′ values that are selected depend on the chirality of the molecule, the size of the molecule, the complexity of the energy landscape and the available budget. Z′ = 1 was included for all cases reported here, and searches with Z′ = 2 were also included for most cases. For Z′ = 1, if the compound is enantiomerically pure, 21 space groups are included in the search, otherwise the number of space groups is 38. For Z′ = 2, a reduced number of space groups is searched and the structure generation step is split into two parts. In a first round, space groups P1, P21 and, if relevant, P![[1 with combining macron]](https://www.rsc.org/images/entities/char_0031_0304.gif) are searched. These three space groups each have at most two symmetry operators, and generally convergence is reached within the time (=budget) available even for the more problematic energy landscapes. In a second round, Z′ = 2 structures are generated in six (for enantiomerically pure compounds) or eight space groups, namely C2, P212121, P41, I41, R3 and P43 or C2, Pc, Cc, P21/c, C2/c, P212121, Pca21, and Pna21 respectively. This second Z′ = 2 round is regularly aborted for economic reasons while still incomplete, although any generated structures are included in the final results.
are searched. These three space groups each have at most two symmetry operators, and generally convergence is reached within the time (=budget) available even for the more problematic energy landscapes. In a second round, Z′ = 2 structures are generated in six (for enantiomerically pure compounds) or eight space groups, namely C2, P212121, P41, I41, R3 and P43 or C2, Pc, Cc, P21/c, C2/c, P212121, Pca21, and Pna21 respectively. This second Z′ = 2 round is regularly aborted for economic reasons while still incomplete, although any generated structures are included in the final results.
Hardware
Each CSP study was carried out on a high-performance computing cluster consisting of 32 INTEL Xeon E5-2650 v4 2.2 GHz 12 core CPUs (= 384 cores in total) with 2 GB memory per core connected by an InfiniBand network or equivalent hardware.Compounds
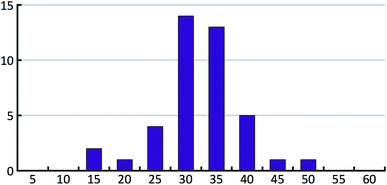
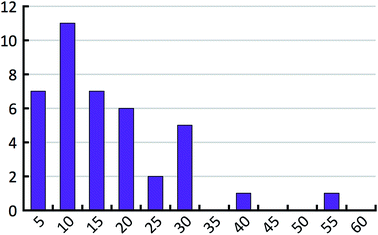
The 41 compounds used in this paper were 41 compounds for which commercial, confidential CSP studies were commissioned. Most of the compounds were under active development at the time of the CSP study. Although no specific compounds can be shown for confidentiality reasons, the average complexity is illustrated in Fig. 2. On average, each compound had 30 non-hydrogen atoms, 23 hydrogen atoms, three trivial flexible torsions such as –CH3, six non-trivial flexible torsion angles and one flexible ring. Among the compounds were five hydrates, one salt and two zwitterions. Twenty-six of the 41 compounds were enantiomerically pure. Fig. 3 and 4 show histograms for the distributions of the number of non-hydrogen atoms and the number of degrees of freedom across the 41 compounds. The statistical analysis presented in this paper only holds for the size and flexibility range of the test set.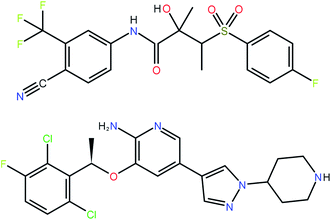 | ||
| Fig. 2 Two molecules (bicalutamide and crizotinib) illustrating the average size and flexibility of the 41 compounds used in this study. | ||
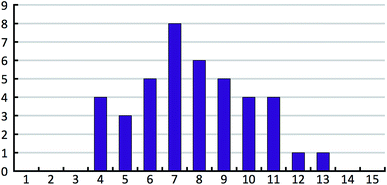 | ||
| Fig. 4 Histogram of the number of non-trivial flexible torsion angles in the 41 compounds of our test set. Each flexible ring is counted as two flexible torsion angles. | ||
Comparison to experimental data
The CSP studies were blind studies and it is only after the predictions had finished that the experimental data were made available. The experimental data may consist of single-crystal structures and X-ray powder diffraction patterns. The single-crystal structures were energy minimised and compared to the list of predicted structures to identify which predicted structures correspond to experimentally observed forms. If the experimental structure was not already present in the list, for example because the polymorph has unusual space-group symmetry, it was added to the list of predicted structures. For two of the 41 studies the most stable experimental structure crystallised with a space-group symmetry that had not been included in the structure generation step. The experimental X-ray powder diffraction patterns were compared to the simulated powder diffraction patterns of all the predicted structures to establish if there were any matches. If a match was found and confirmed by Rietveld refinement, the predicted structure was labelled as being an experimentally observed form. The results of the crystal structure prediction study were then summarised in energy landscapes (Fig. 5). For the purpose of this paper, the main result of each crystal structure prediction study is the energy gap between the predicted crystal structure with the lowest lattice energy and the experimental crystal structure with the lowest lattice energy after lattice energy minimization; for the energy landscape in Fig. 5, for example, this energy gap has a value of 0.0 kcal mol−1. The energy gaps of the 41 studies can be summarised in a histogram (Fig. 8 in the Results and discussion). It is this histogram that is the key to the number of kinetically hindered polymorphs.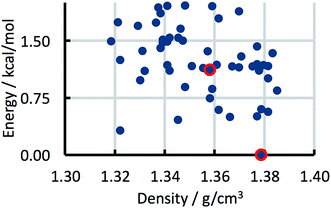 | ||
| Fig. 5 Example energy landscape. Each dot represents a predicted crystal structure. Two predicted structures that have been matched with experimental structures are indicated by red circles. | ||
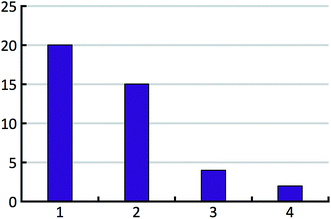
The distribution of the number of experimentally observed forms over the test set is shown in Fig. 6.
Statistical model for the number of kinetically hindered polymorphs
If in the energy landscape (Fig. 5) the global minimum in the predictions does not match an experimentally observed structure, then this can have one of two possible causes. Either the global minimum is kinetically hindered in experiment (the cases we are interested in), or the approximations in our energy potential are at fault and an experimental structure should have been the global minimum. In other words, if our energy potential were perfect, the number of kinetically hindered polymorphs would simply be the number of compounds for which the global minimum in the predictions does not match an experimentally observed structure. In practice, however, the number of predicted global minima that are experimentally unobserved is a function of both the fraction of kinetically hindered structures, h, and the error in the lattice energies, σ. In order to determine h, it is therefore necessary to construct a statistical model that relates h and σ (and an additional parameter b) to the results of the 41 crystal structure prediction studies. Ideally the model would allow for fitting all its parameters to the empirical histogram shown in Fig. 8, but initial tests showed that the parameters are strongly correlated and that the small number of only 41 cases results in high statistical noise that makes a direct fitting procedure unreliable. Instead, an approach is described in the next section in which σ is determined by comparison with a more accurate energy calculation method and b is tightly bracketed by additional considerations. The agreement between the statistical model and the 41 cases is then assessed for various values of h and σ.In order to construct a computational equivalent of the empirical histogram shown in Fig. 8 for a given set of parameters, we use a Monte Carlo procedure implemented in a computer program. The procedure generates 41 random energy landscapes (Fig. 5; the densities do not play a role and are ignored), which are combined into a histogram measuring the energy differences between the most stable predicted structure and the most stable experimental structure, analogous to Fig. 8 (see below in Results and discussion). For each set of parameter values, the random generation of 41 landscapes is repeated 100 times, generating 100 histograms. The 100 histograms are then averaged and the standard deviation for each is calculated. For each set of parameters, the average histogram is compared to the actual histogram resulting from our 41 crystal structure prediction studies (Fig. 8). To avoid confusion, we call the histogram in Fig. 8 the empirical histogram, as opposed to a single, randomly calculated histogram or the average calculated histogram for a set of parameters (we realise that the adjective “empirical” is somewhat ironic considering that the construction of the empirical histogram involved about six years of calculations on a high-performance computing cluster).
We now discuss the parameters of the model. The energy error, σ, is meant to be the root-mean-square deviation between the energies of lattice energy minima calculated at the DFT-D level and the true lattice free energies in the real world. The hindered fraction, h, is the fraction of lattice energy minima for which the appearance is strongly kinetically hindered. By definition, h is also the fraction of the thermodynamically most stable crystal structures that do not readily crystallise, i.e. the main quantity that we are trying to bracket in this paper. Finally, a parameter b is required that is the factor in the exponent of an exponential function describing the rapid increase of the effective number of lattice energy minima with increasing lattice energy.
The notion of the effective number of lattice energy minima, Neff, requires some further discussion. Crystal energy landscapes typically contain many structures that are too similar to be observed independently. We refer to such groups of similar structures as “families” and the effective number of lattice energy minima counts the number of families rather than the number of individual family members. Currently the decision whether two predicted crystal structures belong to the same family is taken based on manual examination of the structures. The differences between family members can be subtle, such as a different orientation of a terminal ethyl group, a small unit cell change or a small molecular displacement. Or there may be structures with two molecules per asymmetric unit that almost match a structure with only one molecule in the asymmetric unit. In such cases thermal motion will either average over the different configurations or result in rapid conversion to the most stable one. But family members may also only share a rod or sheet motif held together by strong interactions. In such cases, each family member can act as a nucleation substrate for all others and the crystal growth process will typically favour the thermodynamically most stable family member. Therefore, at a given pressure and temperature, only one family member will typically be observed experimentally. The stability ranking of family members may change as a function of pressure and temperature and more than one family member may be experimentally observable. The estimation of the average number of members per family will be discussed in the Results section. Our statistical analysis is based on the number of families rather than on the number of individual lattice energy minima for three reasons:
(1) The energy error (DFT-D versus reality) is typically smaller for members belonging to the same family than for members belonging to different families. In each family, structures are similar and error compensation is strong. The energy error σ can be expected to be dominated by the inter-family error.
(2) Many family members are too similar to be observed independently.
(3) Even if family members can be observed independently because they have different p–T stability domains, they must be expected to be either all kinetically hindered or not kinetically hindered, because of their structural similarity and the possibility of cross-nucleation.
The expectation value of the effective number of lattice energy minima per energy interval is assumed to be A·exp(b·E)·dE, were E is the energy per chemical unit. Without loss of generality, the prefactor A is adjusted to yield an expectation value of 10 in the energy interval from 0 to 1 kcal mol−1 (note that 0.0 kcal mol−1 does not correspond to the energy of the most stable structure). The energy range from −5.0 to 5.0 kcal mol−1 is subdivided into 100![[thin space (1/6-em)]](https://www.rsc.org/images/entities/char_2009.gif) 000 intervals. To each interval, a number of structures is randomly attributed following a Poisson distribution that yields the correct mean value according to the exponential function mentioned above. Structures are randomly marked to have kinetically hindered dynamics according to the hindered fraction h. The number of experimentally observed polymorphs, Np, is randomly chosen according to the experimental distribution for the 41 test cases shown in Fig. 6. The first Np non-hindered low energy structures in the 100
000 intervals. To each interval, a number of structures is randomly attributed following a Poisson distribution that yields the correct mean value according to the exponential function mentioned above. Structures are randomly marked to have kinetically hindered dynamics according to the hindered fraction h. The number of experimentally observed polymorphs, Np, is randomly chosen according to the experimental distribution for the 41 test cases shown in Fig. 6. The first Np non-hindered low energy structures in the 100![[thin space (1/6-em)]](https://www.rsc.org/images/entities/char_2009.gif) 000 intervals are marked as experimental. Finally, the energy of each structure is randomly shifted following a normal distribution with a standard deviation that corresponds to the energy error σ.
000 intervals are marked as experimental. Finally, the energy of each structure is randomly shifted following a normal distribution with a standard deviation that corresponds to the energy error σ.
To measure the deviation between the empirical histogram and an average histogram calculated from 100 randomly generated histograms, we use a Figure Of Merit (FOM) that is the sum over the absolute differences between the number of structures in each bin:
 | (1) |
 , can be determined for the randomly calculated histograms. The fluctuation of the randomly generated histograms corresponds to the changes that would be observed if the empirical histogram was reassessed for many independent sets of 41 test cases. Any set of three parameters for which the FOM value of the empirical histogram is lower than or equal to
  must be considered in agreement with the empirical histogram. For the parameter set of Fig. 7 we found
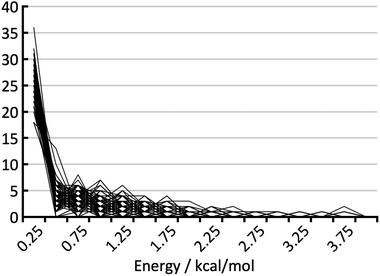 | ||
| Fig. 7 Fluctuation of the 100 randomly calculated histograms for σ = 0.5 kcal mol−1, b = 1.609 mol kcal−1 and h = 0.3 (cf. Fig. 9b). | ||
Results and discussion
Error bars on the energies
For the blind test compounds XXIII, XXIV and XXVI we calculated the root mean square deviation, σrel, between our own DFT-D lattice energies and the corresponding PBE(0) + MBD + Fvib energies. The error of the PBE(0) + MBD + Fvib method itself, σref, is of the order of 1 kJ mol−1, or 0.25 kcal mol−1.18 To estimate the total error of our DFT-D method we combine both errors according to: | (2) |
The results are presented in Table 1. Compound XXV was not included in the comparison because PBE(0) + MBD + Fvib energies were available for only 4 structures, some of which are co-crystals and others are salts. Our DFT-D method is known to suffer from an increased energy error when it comes to the comparison of co-crystal and salt structures, but this is irrelevant for the present analysis because none of the 41 test cases presents this kind of ambiguity.
| Compound | N | σ rel | σ tot |
|---|---|---|---|
| XXIII | 46 | 0.44 | 0.51 |
| XXIV | 8 | 0.57 | 0.62 |
| XXVI | 8 | 0.26 | 0.36 |
The average total error for our method over compounds XXIII, XXIV and XXVI is 0.5 kcal mol−1. With 26 and 40 non-hydrogen atoms, respectively, compounds XXIII and XXVI match the size range of the 41 test compounds. The flexibility of both compounds is slightly below average. With only 11 non-hydrogen atoms, compound XXIV is much smaller than any compound in the test set, but being the hydrate of a chloride salt, lattice energy calculations for compound XXIV are much more challenging than for most other structures in the test set. Overall, it can be assumed that the average energy error obtained for compounds XXIII, XXIV and XXVI is fairly representative for our test set. It is important to note that the error σtot in Table 1 compares the energies of minima on DFT-D lattice energy surfaces to the true lattice free energies. Our average total error of 0.5 kcal mol−1 hence includes not only the inherent inaccuracy of DFT-D, but also the neglect of zero-point vibrations and entropic effects.
Energy gap histogram
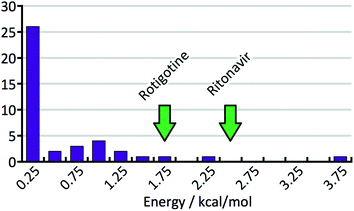
Fig. 8 shows the distribution of the energy gaps between the experimental structure with the lowest predicted energy and the global minimum of the predictions. In cases where the best predicted structure matches an experimental structure, the energy gap is zero. Twenty-three times an experimentally observed structure corresponded to the global minimum of the predicted structures. The width of the bins is 0.25 kcal mol−1, and the first bin not only contains the twenty-three rank-1 predictions but also three additional cases where an experimental structure falls just above the predicted global minimum. The large number of rank-1 predictions demonstrates satisfactory performance of our DFT-D method over the compounds in the test set.For an intuitive assessment of the number of missing thermodynamically stable forms, one may argue that, considering the low number of test cases, a more stable form has certainly been missed when the energy gap exceeds two standard deviations of the energy error. According to Fig. 8, this is the case for 6 out of 41 cases. For energy gaps of between one and two standard deviations, one may roughly assign half of the cases to the energy error, and half of the cases to a missing form problem. In the case of Fig. 8 that would add another 3.5 missing forms, resulting in a total of 9.5 out of 41 (23%). We will see in the next section that this value is in good agreement with a more careful statistical analysis.
In order to support our statement that energy gaps above two standard deviations of the energy error are likely to indicate missing, more stable forms, the energy differences between the first and the late discovered polymorphs of ritonavir and rotigotine are indicated in Fig. 8 by green arrows (no crystal structure prediction studies have been carried out). If an energy landscape had been calculated for these two compounds after the discovery of the first appearing polymorph but before the discovery of the late appearing form, the energy gap would have been as indicated in Fig. 8, or greater.
Statistical analysis
To understand the shape of the histogram in Fig. 8 and to extract quantitative information, we have used the statistical model described in the Methods section. Because of the small size of the test set, many fairly different parameter sets are in agreement with the empirical histogram. It is not possible to determine the three parameters of the statistical model independently by comparison of the FOM values obtained for the various parameter sets.As an example, Fig. 9 shows the average calculated histograms for the two parameter sets presented in Table 2. Both parameter sets are in equally good agreement with the empirical histogram. However, in one case the energy error is 0.75 kcal mol−1 and the hindered fraction is 0.0, whereas in the other case the energy error is 0.5 kcal mol−1 and the hindered fraction is 0.3. We note that because disappearing polymorph cases such as rotigotine, ranitidine and ritonavir are known to exist, our a priori knowledge tells us that it is not possible for h to be 0.0. We have shown both cases as a warning that the estimation of the number of missing thermodynamically most stable forms derived in this paper strongly depends on the estimated energy accuracy.
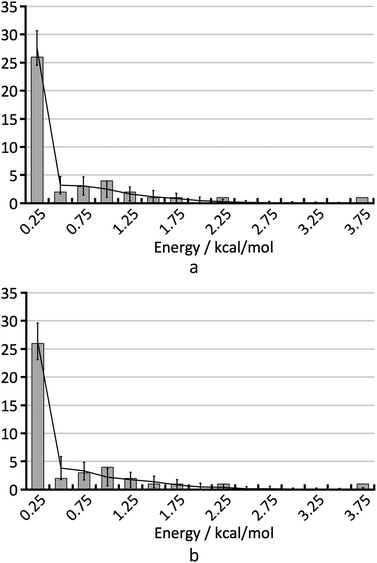 | ||
| Fig. 9 The two histograms corresponding to the parameter sets from Table 2. | ||
| Set | σ [kcal mol−1] | b [mol kcal−1] | h | FOM |
|---|---|---|---|---|
| a | 0.75 | 1.609 | 0.0 | 5.5 |
| b | 0.5 | 1.609 | 0.3 | 6.2 |
Fig. 7 shows the randomly calculated histograms for parameter set b. Some of these histograms actually have structures in the bin at 3.75 kcal mol−1, and what looks like an outlier in Fig. 8 and 9 is actually in agreement with the statistical model.
When the energy error σ and the exponential factor b go up, the hindered fraction has to go down in order to maintain the same level of agreement with the empirical histogram. Above we have already derived an estimate for the energy error. In order to estimate the hindered fraction h, we now also need to bracket the exponential factor b. The exponential factor b determines the effective number of lattice minima that are found on average in a 1 kcal mol−1 window above the most stable structure (see Table 3). We compare these values to the full number of lattice energy minima found for the 41 test compounds. Fig. 10 shows the distribution of the full number of lattice energy minima in a 1 kcal mol−1 window. The average value is 16.7 and goes down to about 14 if the outlier is not considered. The average full number of lattice energy minima, objectively determined from the computed crystal energy landscapes of the 41 test compounds, needs to be converted to an estimate of the effective number of lattice energy minima. This conversion is inevitably subjective at present, because there is no generally accepted measure of how similar structures need to be in order to belong to the same family. According to our experience, which is probably shared by other practitioners of CSP, families have on average about two members in the bottom 1 kcal mol−1 window, but certainly not less than 1.5 or more than 3. Using these last two values, we expect the effective number of lattice energy minima to be in the range of 5 to 10, which corresponds to exponential factors in the range from 1.61 to 2.30.
| b [mol kcal−1] | N eff |
|---|---|
| 0.693 | 2.3 |
| 0.125 | 3.5 |
| 1.61 | 5.0 |
| 2.01 | 7.5 |
| 2.30 | 10 |
| 2.70 | 15 |
| 3.00 | 20 |
Table 4 presents figures of merit for σ = 0.5 kcal mol−1 and various values of the exponential factor b and the hindered fraction h. Parameter sets for which the figure of merit is lower than  are marked by a grey background in the table. Considering only the range from 1.61 to 2.30 for the exponential factor, we conclude that the hindered fraction h must be in the range from 0.15–0.45.
 . The energy error σ is 0.5 kcal mol−1 in all cases
Target window for rational crystallisation experiment design
One approach to reduce the risk of a late appearing thermodynamically more stable form is to use the knowledge of the crystal energy landscape as input for rational crystallisation experiment design. In such an exercise, it is often not possible to explicitly consider more than the first few structures at the bottom of the crystal energy landscape. Our experience shows that it is typically possible to suggest crystallisation experiments through chemical modification21 for most structures in a 0.5 kcal mol−1 window, and the question is how likely it is to find a missing, more stable form in that region of the landscape. For parameter set b in Table 2, the probability of finding a missing most stable form in the bottom 0.5 kcal mol−1 window is 83%. If the energy accuracy improves to 0.25 kcal mol−1 as can be expected for the PBE(0) + MBD + Fvib method, this probability goes up to 97%.Number of molecules in the asymmetric unit
As mentioned in the Introduction, crystal structures with two molecules in the asymmetric unit (Z′ = 2) remain a challenge for current polymorph generation algorithms. For the 41 compounds in this work, in nine cases the polymorph with the lowest lattice energy crystallised with two molecules in the asymmetric unit, and in one case it crystallised with Z′ = 4. For the remaining 31 compounds, the polymorph with the lowest lattice energy could be described with a single molecule in the asymmetric unit (the large, asymmetrical molecules that are typical in pharmaceutical development tend not to have internal symmetry and therefore rarely occupy special positions in the solid state, i.e. cases where Z′ < 1 are rare for pharmaceutical compounds). In summary, 25% of typical pharmaceutical compounds require computational polymorph searches with more than one molecule in the asymmetric unit. Statistical studies against the Cambridge Structural Database22 show that for crystal structures of small molecules in general, only about 10% require Z′ > 1.23 A possible explanation is that for enantiomerically pure compounds the presence of two molecules in the asymmetric allows for pseudo-symmetry in the crystal structure in lieu of true inversion centres or glide planes, which are known to facilitate close packing of small molecules.CPU time consumption
Creating the tailor-made force field took between one and five weeks per compound. For each compound, a minimum of one full crystal structure prediction with one molecule in the asymmetric unit was completed, so the timings for Z′ = 1 can be compared between compounds. For Z′ = 1, the CPU resources varied between less than a day and more than two months. In total, including the predictions with two molecules in the asymmetric unit, approximately six years of continuous calculations on one 384-core cluster would be required to generate the results presented in this paper.Future perspectives
Improving the statistics
The conclusions drawn in this work lack precision because of the large statistical errors associated with the small size of the test set. As more and more CSP studies for pharmaceutical molecules are carried out, the statistics will gradually improve. However, many CSP studies and comparisons with experimental data are carried out by scientists in pharmaceutical companies, and it would be desirable to centralise metadata about such studies, including the ranking of the experimental forms, the energy gap between the most stable predicted and experimental form and the number of local lattice energy minima within a 1 kcal mol−1 window above the most stable predicted form.In addition, it is desirable to reassess the energy landscapes of the 41 test compounds at the PBE(0) + MBD + Fvib level of theory, and to benchmark both DFT-D and PBE(0) + MBD + Fvib against experimental free energy differences between crystal polymorphs for compounds that are similar to the test set in terms of size and flexibility.
Using the information to solve the problem
Knowing whether for a compound under development a more stable polymorph, à la ritonavir, exists, is a crucial first step in the right direction, but it is not a solution. However, the crystal structure prediction studies provide us with two key ingredients for the preparation of thermodynamically stable but kinetically hindered crystal structures: the crystal structure and the lattice energy of the target polymorph. Energy differences and structural differences between the currently observed forms and the kinetically hindered form can give vital clues to predict the experimental conditions under which the new form is favoured over the old forms.Conclusions
Based on 41 CSP crystal structure prediction studies on pharmaceutical compounds for which an extensive experimental polymorph screen had been conducted, we conclude that the thermodynamically most stable form has not yet been observed experimentally in 15 to 45% of the cases. Considering the fact that late appearing forms and disappearing polymorph events have been observed in the past, it is certainly not surprising that the fraction of missing polymorphs is not zero. However, the estimated fraction of compounds that potentially present the danger of a late appearing, more stable form is probably much larger than most crystallisation scientists would expect. In this context, it is important to note that experimental observation will always substantially underestimate the fraction of missing polymorphs. If a polymorph has not been obtained experimentally during the development phase of a pharmaceutical compound despite intense experimental screening efforts, its nucleation dynamics are surely very unfavourable, and it may take years, centuries or even aeons until the missing polymorph crystallises spontaneously for the first time. Many drugs on the market may simply not have been used and crystallised for long enough to allow for a correct empirical understanding of the scope of the phenomenon.Conflicts of interest
Both authors work for a company that develops software for crystal structure prediction. The findings of this work are likely to have a positive impact on software and contract research sales.Notes and references
- J. Bauer, S. Spanton, R. Henry, J. Quick, W. Dziki, W. Porter and J. Morris, Pharm. Res., 2001, 18, 859 CrossRef.
- J. D. Dunitz and J. Bernstein, Acc. Chem. Res., 1995, 28, 193 CrossRef.
- D.-K. Bučar, R. W. Lancaster and J. Bernstein, Angew. Chem., Int. Ed., 2015, 54, 6972 CrossRef PubMed.
- Y. A. Abramov, Org. Process Res. Dev., 2013, 17, 472 CrossRef.
- A. M. Reilly, et al. , Acta Crystallogr., Sect. B: Struct. Sci., Cryst. Eng. Mater., 2016, 72, 439 CrossRef PubMed.
- J. G. P. Wicker and R. I. Cooper, CrystEngComm, 2015, 17, 1927 RSC.
- A. Asmadi, M. A. Neumann, J. Kendrick, P. Girard, M.-A. Perrin and F. J. J. Leusen, J. Phys. Chem. B, 2009, 113, 16303 CrossRef PubMed.
- M. A. Neumann, F. J. J. Leusen and J. Kendrick, Angew. Chem., Int. Ed., 2008, 47, 2427 CrossRef PubMed.
- H. C. S. Chan, J. Kendrick and F. J. J. Leusen, Phys. Chem. Chem. Phys., 2011, 13, 20361 RSC.
- J. Kendrick, F. J. J. Leusen, M. A. Neumann and J. van de Streek, Chem.–Eur. J., 2011, 17, 10736 CrossRef.
- M. A. Neumann, et al., GRACE has been developed by Avant-garde Materials Simulation since 2002, 2002.
- G. Kresse and J. Furthmüller, Phys. Rev. B: Condens. Matter Mater. Phys., 1996, 54, 11169 CrossRef.
- G. Kresse and J. Hafner, Phys. Rev. B: Condens. Matter Mater. Phys., 1993, 47, 558 CrossRef.
- G. Kresse and D. Joubert, Phys. Rev. B: Condens. Matter Mater. Phys., 1999, 59, 1758 CrossRef.
- J. P. Perdew, K. Burke and M. Ernzerhof, Phys. Rev. Lett., 1997, 78, 1396 CrossRef.
- M. A. Neumann and M.-A. Perrin, J. Phys. Chem. B, 2005, 109, 15531 CrossRef PubMed.
- S. Grimme, J. Antony, S. Ehrlich and H. Krieg, J. Chem. Phys., 2010, 132, 154104 CrossRef PubMed.
- A. M. Reilly and A. Tkatchenko, Chem. Sci., 2015, 6, 3289 RSC.
- M. A. Neumann, J. Phys. Chem. B, 2008, 112, 9810 CrossRef PubMed.
- J. van de Streek and M. A. Neumann, CrystEngComm, 2011, 13, 7135 RSC.
- J.-B. Arlin, L. S. Price, S. L. Price and A. J. Florence, Chem. Commun., 2011, 47, 7074 RSC.
- C. R. Groom, I. J. Bruno, M. P. Lightfoot and S. C. Ward, Acta Crystallogr., Sect. B: Struct. Sci., Cryst. Eng. Mater., 2016, 72, 171 CrossRef PubMed.
- A. D. Bond, CrystEngComm, 2008, 10, 411 Search PubMed.
| This journal is © The Royal Society of Chemistry 2018 |

