Highly efficient and selective extraction of uranium from aqueous solution using a magnetic device: succinyl-β-cyclodextrin-APTES@maghemite nanoparticles†
A. S.
Helal
*abc,
E.
Mazario
a,
A.
Mayoral
d,
P.
Decorse
a,
R.
Losno
e,
C.
Lion
a,
S.
Ammar
 a and
M.
Hémadi
 *a
*a
aITODYS – Interfaces, Traitements, Organisation et Dynamique des Systèmes, Sorbonne Paris Cité, CNRS-UMR 7086, Université Paris Diderot, Paris, France. E-mail: hemadi@univ-paris-diderot.fr
bDepartment of Nuclear Science and Engineering, Massachusetts Institute of Technology, USA. E-mail: ashelal@mit.edu
cNuclear Materials Authority, P.O Box 540 El Maadi, Cairo, Egypt
dLaboratorio de Microscopias Avanzadas (LMA), Instituto de Nanociencia de Aragón (INA) – Universidad de Zaragoza, Spain
eInstitut de Physique du Globe de Paris, Sorbonne Paris Cité, UMR 7154, CNRS, F-75005 Paris, France
First published on 21st November 2017
Abstract
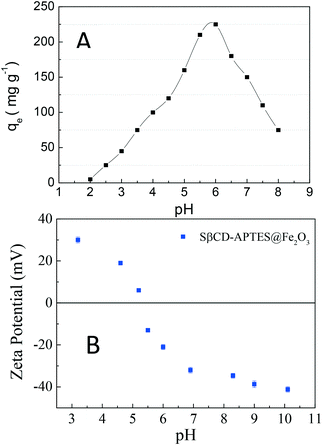
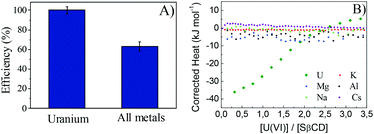
The removal of radio-elements, notably uranium, from wastewaters is crucial for public health and environmental remediation. To this end, succinyl-β-cyclodextrin (SβCD) is grafted onto maghemite nanoparticles (NPs) synthesized by a polyol method. The nanocomposite was characterized well. The adsorption of U(VI) by SβCD-APTES@Fe2O3 is pH-dependent with a maximum at pH 6. Adsorption occurs mainly by complex formation and displays a very good selectivity for U(VI) compared to other cations such as Cs+, K+, Na+, Mg2+ and Al3+. The data were plotted according to Langmuir, Freundlich, Elovich, Temkin and Halsey isotherms. The Langmuir isotherm maximum adsorption capacity (qmax) is 286 mg U per g and higher than that of other reported sorbents. Moreover, Cs-corrected STEM visualizes uranium on the NP surface, which is consistent with the Halsey isotherm model for multilayer adsorption. The U(VI) adsorbed on SβCD-APTES@Fe2O3 is easily recovered by magnetic sedimentation and desorption performed in a small volume in order to concentrate the extract. The nanocomposite can be regenerated and reused at least tenfold.
Environmental significanceThe production of low-carbon energy has a considerable global influence on social, economic, and environmental development. Nuclear energy offers a very high energy density with extremely low greenhouse gas emissions with unparalleled advantages as compared to other energies. Uranium is mainly used as a fuel in nuclear power plants for electricity production in many countries, such as France, the United Kingdom, the United States, etc. To a lesser extent, uranium is also used in reactors for the propulsion of naval vessels, for basic and applied research, and for the production of radioisotopes for multiple applications such as the treatment of cancer and medical imaging. Therefore, the release of hazardous radionuclides (e.g.235U, 238U, 235Np, 239Pu, 247Cm, 137Cs, etc.) into the environment and aquatic system by various nuclear processes, such as mining operations, refining of nuclear fuel, aboveground/underground nuclear tests and during nuclear disasters (e.g. Three Mile Island in Pennsylvania in 1979, Chernobyl in 1986, and Fukushima Daiichi in 2011), represents a serious environmental problem and endangers human health. Hence, highly efficient concentration of uranium, as well as its removal from aqueous solutions, is of extreme importance for the optimal utilization of uranium resources, environmental protection and environmental repair. In France, the Socialist-Green political project involves stopping one third of the nuclear parks. The shutdown, decommissioning and dismantling of nuclear power plants will inevitably lead to an increase in the amount of nuclear waste and in radioactive exposure of workers on site. Therefore, safe handling and disposal of nuclear waste is needed to avoid contamination. It is, thus, essential to find a cost-effective innovative system that can remove radioactive ions from nuclear wastewater and contaminated surfaces of nuclear power plants. In this paper, we propose an easy-to-implement nanocomposite device composed of succinyl-β-cyclodextrin-APTES@maghemite nanoparticles for sorting and concentrating radioactive waste, in this case U(VI), into a small volume. |
1. Introduction
Apart from being radioactive, uranium is highly toxic in all its oxidation states and causes severe damage to bones, kidney, the neurological system, etc.1–3 Nevertheless, it is used as a fuel in nuclear power plants and, to a lesser extent, in reactors for the propulsion of naval vessels, for basic and applied research, and for the production of radioisotopes for medical applications, such as cancer therapy and imaging.4,5 The contamination of soil and water by highly radiotoxic elements, not only by uranium but also by cesium and plutonium released accidentally during nuclear disasters or routine maintenance of power plants, can be the cause of severe health and ecological problems.6,7 For this reason, radioactive pollution is of high social and environmental concern, and it is increasingly important to devise procedures for depollution.1,2To date, many physical and chemical methods have been investigated and/or used for the remediation of heavy-metal contamination.8 These include solvent extraction,9–12 chemical precipitation,13,14 the use of ion-exchange resins,15–18 membrane-based extraction19,20 and electrochemical extraction.21–23 However, these processes are time-consuming and present several drawbacks, such as the excessive use of organic solvents, complex equipment, a large amount of secondary waste and prefiltration problems, which limit their efficiency. The aim is to overcome these disadvantages by the development of compact modular processes that provide an easy-to-handle separation technique.24 Recently, sorption has aroused interest as an alternative to the use of conventional ion-exchange resins for the recovery of metal ions from low-concentration effluents.25–29 It is now widely adopted in the field of environmental protection because it is a highly efficient, environmentally friendly and inexpensive technique. A great number of new adsorbent materials have been synthesized for the solid/liquid separation of metal ions, such as membranes, modified fibers, carbon nanotubes, hydrogels, mesoporous silica and magnetic materials.30,31 Despite this considerable progress, prior functionalization of the surface of the sorbent using specific chelating agents, such as polyamidoxime, metal ion-imprinted polymer materials, carboxylates or hydroxyls, is still required.32
Magnetic materials, especially iron oxide nanoparticles, are being investigated for a wide range of applications, including targeted drug delivery,33 hyperthermia,34,35 photothermia,36,37 bio-imaging,38 catalysis,39 and environmental remediation.40 They have several advantages, the six most important of which in our opinion are the following: (1) easy collection and removal from a complex multiphase system by an external magnetic field, which makes solid–liquid phase separation fast and simple, as well as highly effective;41 (2) low-cost and low reagent consumption; (3) high selectivity and easy automation; (4) high pre-concentration factors and eco-friendliness; (5) being reusable adsorbents; (6) combination with modern detection techniques in on-line or off-line mode.24
However, their main disadvantage lies in the strong dipole–dipole attraction between particles and their tendency to aggregate, which reduces their adsorption capabilities.42 To overcome this problem, specifically designed heavy-metal chelating groups are interesting candidates for functionalizing the surfaces of magnetic nanoparticles (MNPs). β-Cyclodextrin (β-CD) is a cyclic oligosaccharide consisting of seven α-D-glucose units connected through α-(1,4) bonds. These molecules are toroidal, truncated cones containing a cavity with primary and secondary hydroxyl groups at the smaller and larger openings, respectively.43–45 Cyclodextrins form inclusion complexes with a wide variety of organic and inorganic compounds in the relatively hydrophobic cavity.44 Some chemical properties, such as aqueous solubility and metal complexation potentials, can be altered by introducing functional groups onto the outside of cyclodextrin.46 This work aims at preparing a highly efficient functionalized magnetic nanocomposite adsorbent with high adsorption capacity (Scheme 1).
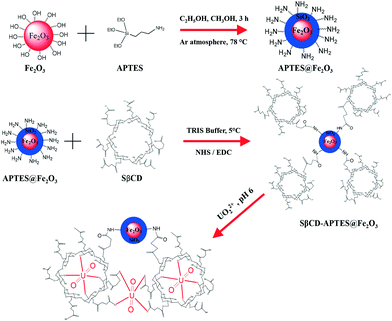 | ||
| Scheme 1 Synthesis, functionalization of nanoparticles (APTES@Fe2O3) and uranium(VI) extraction strategy using SβCD-APTES@Fe2O3. | ||
To this end, an original nanodevice, an SβCD-APTES@Fe2O3 nanocomposite, is synthesized by grafting succinyl-β-cyclodextrin (SβCD) onto APTES@Fe2O3. Indeed, prior functionalization of Fe2O3 by APTES covers its surface with amino functions which are used to attach SβCD to the nanoparticles via the formation of covalent amide bonds with the carboxylic groups. The resulting nanocomposite is characterized by a variety of techniques: spherical-aberration-corrected (Cs-corrected) STEM, FTIR spectroscopy, XRD, XPS, TGA, and VSM. Nano-isothermal titration calorimetry (nano-ITC) is used to investigate the coordination of uranium. The influence of various experimental parameters, such as pH, contact time and the initial U(VI) concentration, on adsorption is studied. The selectivity, adsorption isotherms and kinetic models of the sorption process are also investigated.
2. Results and discussion
2.1 Characterization
![[double bond, length as m-dash]](https://www.rsc.org/images/entities/char_e001.gif) O in the amide bond (H–N–C
O in the amide bond (H–N–C![[double bond, length as m-dash]](https://www.rsc.org/images/entities/char_e001.gif) O), and O–H bending vibrations, respectively (Fig. S4†).47,48 The peaks at 1077 and 1158 cm−1 are attributed to glycosidic C–O–C or C–C/C–O stretching vibrations.49,50 The peak at 1727 cm−1 is assigned to the C
O), and O–H bending vibrations, respectively (Fig. S4†).47,48 The peaks at 1077 and 1158 cm−1 are attributed to glycosidic C–O–C or C–C/C–O stretching vibrations.49,50 The peak at 1727 cm−1 is assigned to the C![[double bond, length as m-dash]](https://www.rsc.org/images/entities/char_e001.gif) O stretching vibration,43 which confirms the presence of SβCD in the adsorbent. After U(VI) adsorption, a new characteristic sharp peak of UO22+ is observed at 923 cm−1.12,51–55 Furthermore, the absorption frequency shifts from 1727 cm−1 to 1733 cm−1 due to the coordination of carbonyl groups with UO22+. Other shifts confirm the complex formation between UO22+ and the succinyl moiety: shifts of 23 cm−1 for the asymmetric carboxylic stretching from 1407 and 1563 cm−1 to 1384 and 1540 cm−1, respectively.49 The peaks at 1030, 1158, and 3407 cm−1, corresponding to anti-symmetric glycosidic C–O–C vibrations, coupled (C–C/C–O) and OH stretching vibrations, respectively, shift to 1028, 1157, and 3392 cm−1, respectively, indicating that the oxygen atom is directly involved in the interaction with UO22+.43 Therefore, uranium interacts and forms complexes with SβCD-APTES@Fe2O3 by coordination.
O stretching vibration,43 which confirms the presence of SβCD in the adsorbent. After U(VI) adsorption, a new characteristic sharp peak of UO22+ is observed at 923 cm−1.12,51–55 Furthermore, the absorption frequency shifts from 1727 cm−1 to 1733 cm−1 due to the coordination of carbonyl groups with UO22+. Other shifts confirm the complex formation between UO22+ and the succinyl moiety: shifts of 23 cm−1 for the asymmetric carboxylic stretching from 1407 and 1563 cm−1 to 1384 and 1540 cm−1, respectively.49 The peaks at 1030, 1158, and 3407 cm−1, corresponding to anti-symmetric glycosidic C–O–C vibrations, coupled (C–C/C–O) and OH stretching vibrations, respectively, shift to 1028, 1157, and 3392 cm−1, respectively, indicating that the oxygen atom is directly involved in the interaction with UO22+.43 Therefore, uranium interacts and forms complexes with SβCD-APTES@Fe2O3 by coordination.
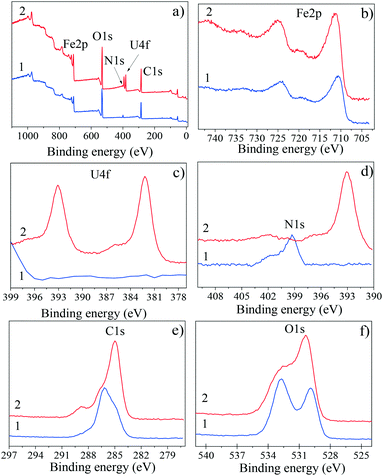
The XPS survey spectra of SβCD-APTES@Fe2O3 before and after U(VI) sorption are displayed in Fig. 1a1 and a2. Before sorption, the characteristic peaks of SβCD-APTES@Fe2O3 are Fe2p (doublet), O1s, C1s and N1s centered at 711.1–723.5 eV (which is in agreement with the presence of Fe2O3), 532 eV, 286 eV and 399.3 eV, respectively. The high-resolution spectra display a three-component C1s peak (Fig. 1e1): C–C and C–H components at 285 eV related to atmospheric contamination of the sample, a large component at 286.4 eV for C–OH and a weak one at 289 eV for O![[double bond, length as m-dash]](https://www.rsc.org/images/entities/char_e001.gif) C–O. The N1s peak consists of two components (Fig. 1d1): the first at 399.3 eV (H–N–C
C–O. The N1s peak consists of two components (Fig. 1d1): the first at 399.3 eV (H–N–C![[double bond, length as m-dash]](https://www.rsc.org/images/entities/char_e001.gif) O) is due to the amide bond between SβCD and the APTES grafted onto Fe2O3, and the second at 402.1 eV is assigned to the residual amino function of APTES, NH+. The O1s peak (Fig. 1f1) also consists of two components: the first is attributable to the oxygen atoms of Fe2O3 (530 eV) while the second is attributable to the organic oxygen atoms of SβCD-APTES (≈532.5–533 eV). Uranium is not detected in this sample.
O) is due to the amide bond between SβCD and the APTES grafted onto Fe2O3, and the second at 402.1 eV is assigned to the residual amino function of APTES, NH+. The O1s peak (Fig. 1f1) also consists of two components: the first is attributable to the oxygen atoms of Fe2O3 (530 eV) while the second is attributable to the organic oxygen atoms of SβCD-APTES (≈532.5–533 eV). Uranium is not detected in this sample.
After sorption, an additional peak (doublet) appears at 382.2 and 393.1 eV (Fig. 1a2 and c2), corresponding to the 4f photoelectron peaks of U(VI), U4f7/2 and U4f5/2, respectively, complexed with the succinyl carboxylate groups. The binding energies are in good agreement with those in the literature.56 The high-resolution spectra show a small variation in the N1s peak, whereas the component at 399.3 eV disappears and the intensity at 402.5 eV decreases because nitrogen is partially hidden by uranium. Furthermore, an increase in the intensity of the component at 289 eV occurs because of the carbon of uranium acetate. These results further confirm that uranyl ions are adsorbed on the surface of SβCD-APTES@Fe2O3 and are in good agreement with the FTIR results.
The structures of the SβCD-APTES@Fe2O3 NPs, as well as the location of U(VI) at their surface, were visualized by spherical-aberration-corrected STEM. When Cs-corrected STEM is combined with HAADF detection, the contrast depends strongly on the atomic number of the elements;57 therefore, elemental U should appear much brighter than Fe and O. Fig. 2a depicts several particles where uranium is clearly visible as white spots due to its higher contrast. Fig. 2b displays an 8 nm particle orientated along the [100] projection, with the FFT image (inset, top left) that can be indexed to assume an Fd![[3 with combining macron]](https://www.rsc.org/images/entities/char_0033_0304.gif) m symmetry. The structure is also presented (inset, bottom right), with Fe cations in brown and O anions in red.
m symmetry. The structure is also presented (inset, bottom right), with Fe cations in brown and O anions in red.
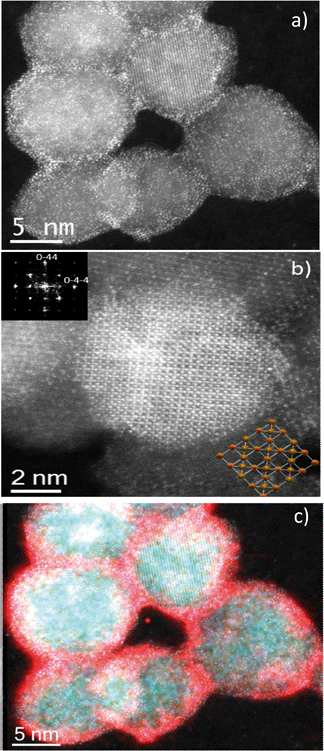 | ||
| Fig. 2 (a and b) High-resolution Cs-corrected STEM-HAADF images. (c) STEM image with superimposed U (red), Fe (green) and O (blue). | ||
Electron energy loss spectroscopy (EELS) was performed to corroborate the nanoparticle composition. The compositional map of the extracted signals is presented in Fig. 2c, which is superimposed on the experimental image. This image confirms that the nanoparticles consist of Fe and O coated with U ions. The extracted spectrum signal is shown in Fig. S5,† as well as each individual map.
The low-temperature magnetization curves of the SβCD-APTES@Fe2O3 nanocomposite before and after the adsorption test are shown in Fig. S6.† The samples are saturated at the maximum external field. The saturation magnetizations of γ-Fe2O3 and SβCD-APTES@Fe2O3 NPs are 84.6 and 70.2 emu g−1, respectively, corresponding to a net drop of 17% for the latter. This is a consequence of the non-magnetic layer of silica and organic compounds (SβCD-APTES) grafted at the surface of γ-Fe2O3.
The magnetization of the SβCD-APTES@Fe2O3 nanocomposite falls by a further 9% upon complexation but is still high enough to allow its magnetic harvesting by applying an external magnet.
2.2 Adsorptive features
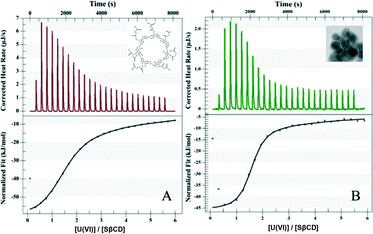
The ITC data fit the one-site model well (Fig. 3A, Table 1), giving an equilibrium constant Ka = 2.98 × 10⁵ M−1 with a U(VI)/SβCD stoichiometry of 1.5, indicating that three U(VI) ions coordinate with two SβCD molecules in the presence of water. The three U(VI) ions are located in distorted octahedral complexes, two of them with the OH groups inside the cyclodextrins and the third with the succinyl groups between the cyclodextrins (Scheme 1). The complexation of uranium with SβCD is strongly exothermic (ΔH = −61.9 kJ mol−1) with a calculated ΔG of −31.3 kJ mol−1 at 25 °C. More importantly, ITC measurements showed that the grafting of SβCD onto APTES@Fe2O3 leads to an almost 10-fold increase in the affinity for uranium due to the better organization of SβCD on the nanoparticles (Scheme 1, Fig. 3B and Table 1). In both cases, with and without APTES@Fe2O3, the negative value of ΔG indicates that uranium adsorption onto SβCD is a spontaneous process.
| SβCD | SβCD-APTES@Fe2O3 | |
|---|---|---|
| K a (M−1) | 2.98 × 10⁵ | 2.39 × 10⁶ |
| n | 1.5 | 1.5 |
| ΔH (kJ mol−1) | −61.9 | −45.8 |
| ΔS (J mol−1 K−1) | −103 | −31.5 |
| ΔG (kJ mol−1) | −31.3 | −36.4 |
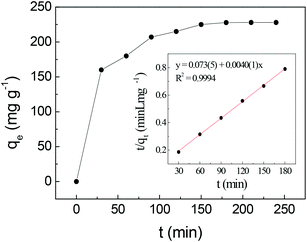 | ||
| Fig. 5 Effect of contact time on uranium adsorption by SβCD-APTES@Fe2O3 and (inset) pseudo-second-order kinetic plot for the adsorption of U(VI) (C0 = 150 mg L−1, pH 6, at 25 °C). | ||
The linear form of the pseudo-first-order rate equation is given by:
 | (1) |
The linear form of the pseudo-second-order model is given by eqn (2):
 | (2) |
The intra-particle diffusion model is expressed by eqn (3):
| qt = kpt1/2 + C | (3) |
Table 2 shows the parameters of the different kinetic models for uranium adsorption. The correlation coefficients (R2) for the best regression lines for the pseudo-first-order (eqn (1)), pseudo-second-order (eqn (2)) and intra-particle diffusion (eqn (3)) models are 0.9587, 0.9994 and 0.8789, respectively. The pseudo-second-order model (eqn (2), Fig. 5 and Table 2) clearly best describes the kinetics of the adsorption of uranyl on SβCD-APTES@Fe2O3.
| Kinetic model | Parameter | Value |
|---|---|---|
| Pseudo-first-order | k 1 (min−1) | 0.03 |
| q e,cal | 204.2 | |
| R 2 | 0.9587 | |
| Pseudo-second-order | k 2 (g mg−1 min−1) | 2.2 × 10⁻⁴ |
| q e (mg g−1) | 250 | |
| R 2 | 0.9994 | |
| Intra-particle diffusion | k p (mg g−1 min−0.5) | 16.6 |
| R 2 | 0.8789 |
This suggests that chemisorption is the rate-controlling step, implying the complex formation between the adsorbent and the adsorbate.60 The carboxylate groups of the succinyl moieties and the hydroxyl groups inside the cyclodextrin cavity are responsible for metal complexation.
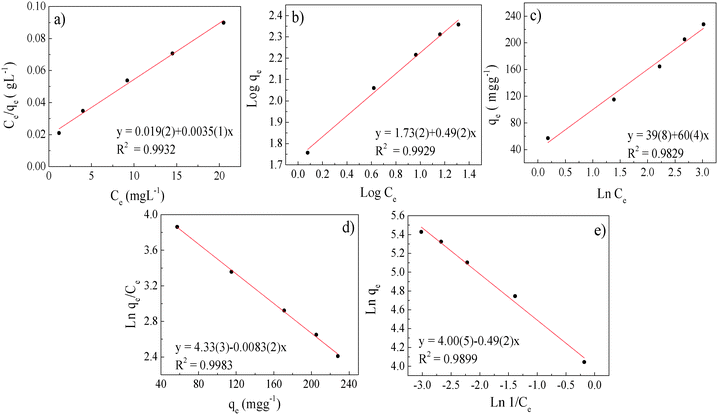 | ||
| Fig. 6 Uranium adsorption isotherms: (a) Langmuir, (b) Freundlich, (c) Temkin, (d) Elovich and (e) Halsey. | ||
| Langmuir | Freundlich | Temkin | Elovich | Halsey | |||||
|---|---|---|---|---|---|---|---|---|---|
| q max (mg g−1) | 286 | K F (L g−1) | 53.7 | a | 39 | K E | 0.63 | K H | 3510 |
| K L (L mg−1) | 0.18 | 1/n | 0.5 | b | 60 | q m | 120.5 | n H | 2.04 |
| R L | 0.04 | n | 2 | ||||||
| R 2 | 0.9932 | 0.9929 | 0.9829 | 0.9983 | 0.9899 | ||||
The experimental data were first evaluated using the Langmuir model,61,62 which is expressed by eqn (4):
 | (4) |
This model assumes that:63 (i) the solid surface presents a finite number of identical sites which are energetically homogeneous, (ii) there is no interaction between adsorbed species, meaning that the amount of adsorbate has no influence on the rate of adsorption, and (iii) the solid surface is saturated when a complete monolayer is formed. As shown in Fig. 6a, the equilibrium data fit the Langmuir model well. qmax and KL were obtained by plotting Ce/qeversus Ce (eqn (4) and Table 3). SβCD-APTES@Fe2O3 exhibits a maximum sorption capacity (qmax) of 286 mg of U(VI) per g of sorbent at pH 6 in simulated contaminated water. SβCD-APTES@Fe2O3 appears to have a higher sorption capacity for U(VI) than other cyclodextrin derivatives (Table 4). The essential characteristic of the Langmuir isotherm can be expressed in terms of a dimensionless constant, commonly known as the separation factor (RL) defined by Webber and Chakkravorti (eqn (5)):64
 | (5) |
| Sorbent | Capacity (mg g−1) (reference) |
|---|---|
| Magnetite nanoparticles | 5 (70) |
| Multi-walled carbon nanotubes grafted with carboxymethyl cellulose | 112 (71) |
| Amine-functionalized magnetic-chitosan nanoparticles | 178 (8) |
| Quercetin-modified Fe3O4 NPs | 12.3 (72) |
| Polyamidoxime-functionalized NPs | 247 (73) |
| Di-amidoxime-functionalized NPs | 120 (74) |
| Fungus-Fe3O4 bio-nanocomposites | 171 (5) |
| Multi-walled carbon nanotubes grafted with chitosan | 34.5 (32) |
| β-Cyclodextrin/Al(OH)3 | 63.3 (75) |
| β-Cyclodextrin/montmorillonite/iron oxide | 66.4 (76) |
| Cyclodextrin-modified graphene oxide nanosheets | 97 (77) |
| β-Cyclodextrin/magnetic HNT/iron oxide composite | 107.5 (7) |
| SβCD-APTES@Fe2O3 NPs | 286 (this work) |
The Freundlich isotherm is one of the most widely used isotherms for describing adsorption equilibria. This model assumes a heterogeneous adsorption surface and active sites, and the corresponding equation can be expressed in the linearized logarithmic form (eqn (6)):
 | (6) |
The Freundlich parameters are obtained from the plot in Fig. 6b and are reported in Table 4. KF can be used to explore the efficacy of the adsorption process.65 The higher the capacity, the higher the KF, which is 53.7 in the present case, implying a strong interaction between the sorbent and metal. Furthermore, the value of 1/n describes the adsorption intensity or the surface heterogeneity. A value of 0.5, which is between 0 and 1, indicates chemisorption.66 According to our results (Table 4), the adsorption process involves complexation, which is in good agreement with the thermodynamic (ITC measurements) and kinetic investigations.
The Temkin isotherm also takes into account the interactions between the adsorbent and the adsorbate. It is based on the assumption that the free energy of adsorption is a function of the surface coverage. The simplified form of this model,67–69 developed considering only chemisorption, is expressed by the following linear relationship, eqn (7):
qe = a + b![[thin space (1/6-em)]](https://www.rsc.org/images/entities/char_2009.gif) log log![[thin space (1/6-em)]](https://www.rsc.org/images/entities/char_2009.gif) Ce Ce | (7) |
![[thin space (1/6-em)]](https://www.rsc.org/images/entities/char_2009.gif) Ce is obtained (Fig. 6c), fitting this model quite well. a and b are determined from the intercept and slope of the regression line (Fig. 6c and Table 3).
Ce is obtained (Fig. 6c), fitting this model quite well. a and b are determined from the intercept and slope of the regression line (Fig. 6c and Table 3).
A very good least-squares regression line of  against qe (eqn (8))78 is obtained for the Elovich isotherm model (Fig. 6d and Table 3).
 | (8) |
Finally, the Halsey isotherm model is used to evaluate the multilayer adsorption system for metal ions at a relatively large distance from the surface,61,62 according to eqn (9):
 | (9) |
Therefore, when all the techniques are taken together, we can conclude that the adsorption of uranyl ions on SβCD-APTES@Fe2O3 is mainly chemisorption. The qe obtained for the sample in Fig. 2c is 115 mg g−1, which is equivalent to 800 atoms of U per nanoparticle. This figure visualizes the U(VI) at the surface of SβCD-APTES@Fe2O3 and is consistent with the Hasley isotherm model for the adsorption of U(VI) in a multilayer.
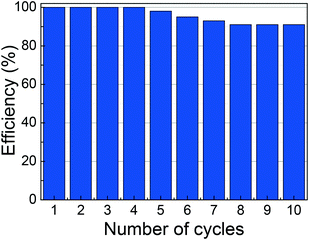
Tests showed that a small volume of 0.02 M HNO3 efficiently desorbs U(VI) ions; 45 min of contact is sufficient to achieve the desorption equilibrium. Therefore, in a real case, the uranium desorbed by this process is concentrated before being sent to the company that manages the nuclear waste. Commercial extraction resins are plagued with issues such as their lack of reusability and the elution of the organic extractant/stationary phase. SβCD-APTES@Fe2O3 is much more robust. The sorption and desorption cycles are repeated ten times to probe the regeneration ability of the system. From Fig. 8, it is manifested that SβCD-APTES@Fe2O3 sorbents can be reused, indicative of the excellent stability of the organic ligands on the surface of γ-Fe2O3. After four adsorption/desorption cycles, there is no change in the efficacy of extraction/elution or the morphology of the sorbent. After ten cycles, this decreases to 91%, but no magnetic loss is detected. Thus, although SβCD is somewhat expensive, the SβCD-APTES@Fe2O3 nanocomposite is one of the most selective and robust materials for the extraction of uranium from aqueous media by adsorption.
3. Experimental section
3.1 Reagents and analysis
Succinyl-β-cyclodextrin (SβCD) was purchased from Sigma–Aldrich (France). All chemicals were of the purest grades, purchased from Merck, Sigma Aldrich, Fluka, Acros and VWR. A stock solution of U(VI) was prepared by dissolving UO2(C2H3O2)2·2H2O (1.7818 g) in 1 L of doubly distilled water acidified with HNO3 (5 mL, 2 M) to give a U(VI) solution (1000 mg L−1). Working standards were prepared by diluting different volumes of the stock solution to obtain the desired concentration. The concentration of U(VI) in treated solutions was estimated by inductively coupled plasma-mass spectrometry (ICP-MS).3.2 Nanoparticle synthesis and functionalization
Maghemite (γ-Fe2O3) nanoparticles were synthesized in two steps. i) Magnetite (Fe3O4) particles were prepared by a polyol method using an appropriate amount of iron(II) acetate as a metal precursor and triethylene glycol (TEG) as a solvent.80 The temperature of the mechanically stirred mixture was increased at a rate of 6 °C min−1 up to the boiling point (230 °C) and maintained at this temperature for 3 h. The mixture was then cooled to room temperature. A black dispersion of magnetite Fe3O4 was obtained. ii) Magnetite (black) was oxidized to maghemite (brown) by washing several times with hot water and centrifugation (15 min at 22![[thin space (1/6-em)]](https://www.rsc.org/images/entities/char_2009.gif) 500 rpm). Besides oxidation, this procedure also eliminated the adsorbed TEG residues. The brown powder was dried at 50 °C for several hours. The γ-Fe2O3 NPs were then functionalized with (3-amino-propyl)triethoxysilane (APTES).81,82 The NPs (100 mg) were dispersed by ultrasonication in methanol (10 mL) which was followed by the addition of ethanol (250 mL). APTES (1 mL) was added slowly to the above mixture which was then ultrasonicated for 1 h. The mixture was boiled under argon for 2 h and then cooled to room temperature. The APTES-functionalized NPs were washed at least 4 times with ethanol, and the dispersion was collected by sedimentation using a laboratory magnet and dried overnight at 50 °C.
500 rpm). Besides oxidation, this procedure also eliminated the adsorbed TEG residues. The brown powder was dried at 50 °C for several hours. The γ-Fe2O3 NPs were then functionalized with (3-amino-propyl)triethoxysilane (APTES).81,82 The NPs (100 mg) were dispersed by ultrasonication in methanol (10 mL) which was followed by the addition of ethanol (250 mL). APTES (1 mL) was added slowly to the above mixture which was then ultrasonicated for 1 h. The mixture was boiled under argon for 2 h and then cooled to room temperature. The APTES-functionalized NPs were washed at least 4 times with ethanol, and the dispersion was collected by sedimentation using a laboratory magnet and dried overnight at 50 °C.
3.3 Grafting SβCD onto APTES@Fe2O3
To a solution of SβCD (1 mL) in 2-(N-morpholino)ethanesulfonic acid (MES, 100 mM, pH 6), N-hydroxysuccinimide (NHS, final concentration: 3.75 mM) and 1-ethyl-3-(3-dimethylaminopropyl)carbodiimide (EDC, final concentration: 1.5 mM) were added. The solution was then stirred for 1 h at room temperature. NPs (5 mg) were dispersed in TRIS buffer (1 mL, 50 mM) at 7.4 ≤ pH ≤ 9 and vigorously shaken for 1 h. The two solutions were then mixed and the suspension was stirred overnight at 4 °C. The suspension was washed several times with TRIS buffer at pH 7.4.3.4 Nanoparticle characterization
Phase identification of the nanopowder was performed at room temperature by X-ray diffraction (XRD) using a PANalytical X'Pert PRO with Co-Kα radiation (40 kV, 40 mA) (λ = 1.789 Å) and an X'Celerator detector (2θ range from 10 to 120°). The crystallite size was calculated by means of the FullProf suite83 based on the Rietveld method. The magnetic properties of raw NPs, as well as those of the nanocomposite before and after complexation, were evaluated from the first emanation curves measured at 10 K with a maximum magnetic field of 5 T using a vibration sample magnetometer (VSM; 9600-1 LDJ, USA). The size and shape of the maghemite nanoparticles were analyzed using a JEOL-100 CX transmission electron microscope (TEM) operating at 100 kV. The samples were prepared at room temperature by slowly evaporating a drop of the NPs, dispersed in ethanol, on amorphous carbon-coated copper grids.SβCD-APTES@Fe2O3 and uranium-loaded SβCD-APTES@Fe2O3 were analyzed by X-ray electron spectroscopy (ESCALAB 250, Thermo VG Scientific equipped with a monochromatic Al Kα X-ray source at 1486.6 eV) at a spot size of 650 μm. The samples were stuck on sample holders using conductive double-sided adhesive tape and pumped overnight in the fast entry lock at ≈5 × 10⁻¹⁰ mbar prior to transfer to the analysis chamber. An electron flood gun was used for charge compensation. The pass energy was set at 100 and 40 eV for the survey spectra and the narrow regions, respectively. Data acquisition and processing were achieved using the AVANTAGE software version 4.67. Spectral calibration was carried out by setting the main C1s component to 285 eV.
Fourier transform infrared (FTIR) spectra were recorded on a Bruker Equinox spectrometer in the range 400–4000 cm−1 using KBr pellets of dried samples of the pre- and post-functionalized particles.
Zeta-potentials were measured at different pH values, using 10−2 M KNO3 as the background electrolyte, using a Zetasizer Nano S from Malvern Instruments.
Thermal analyses (TG/DTA) were performed in air using Setaram TGA92 apparatus; the samples were heated from room temperature up to 800 °C at a rate of 20 °C min−1.
Spherical aberration (Cs)-corrected scanning transmission electron microscopy (STEM) was performed using an FEI Titan XFEG operated at 300 kV. The electron microscope was equipped with a CEOS corrector for the electron probe, allowing a spatial resolution of 0.8 Å. It was also fitted with a high-angle annular dark-field (HAADF) detector, an EDAX EDS detector and a Gatan Tridiem energy filter for spectroscopic analyses.
The uranyl ion concentrations before and after the sorption experiments were obtained by ICP-MS using an Agilent 7900 Q-ICP-MSICP-MS. An aliquot of each uranyl solution was diluted in a solution of HNO3 (0.5 M) until the ppb concentration range was reached.
3.5 Kinetic measurements
The sorbents of SβCD-APTES@Fe2O3 (0.005 g) were put in contact with uranyl acetate (15 mL, initial metal concentration (C0): 150 mg U L−1) at pH 6 for different contact times: 0, 30, 60, 90, 120, 150 and 180 min. At the end of each period, magnetic separation was performed and the residual uranium concentration in the supernatant was measured by ICP-MS. The value of qe for each sample was then determined using the mass balance equation (eqn (10)) | (10) |
3.6 Thermodynamic measurements
Nano-ITC titrations were carried out at 25 °C in water using a nano-isothermal titration calorimeter (Nano-ITC, TA Instruments, USA) having an active cell volume of 940 μL and a 250 μL stirring syringe. Measurements were run in the overfilled mode. The power curve (heat flow as a function of time) was integrated through Nano Analyze (TA Instruments, USA) to obtain the gross heat evolved/absorbed in the reaction. The equipment was checked by running an electrical calibration. Before each titration, all solutions were thoroughly degassed under vacuum with magnetic stirring. The solution in the sample cell was stirred at 300 rpm to ensure rapid mixing of the titrant upon injection. Titrations were performed by an automated sequence of 25 injections of 10 μL of uranyl solution (0.4 mM) each into the sample cell containing the SβCD solution (0.02 mM), spaced at 300 s intervals to ensure complete equilibration. The ITC experiments with SβCD-APTES@Fe2O3 nanoparticles were performed under the same experimental conditions. In this case, the amount of SβCD grafted onto the NP surface was estimated from the iron concentration obtained by ICP and also from the weight% in TGA. Three titrations were carried out for each measurement, and the results fitted with the independent-site model of the Nano Analyze software (TA Instruments). The ITC experiments with Al3+, K+, Mg2+ and Na+ were carried out using solutions of SβCD (0.02 mM) and a metal concentration of 0.4 mM. The injection volume and the number of injections were 5 μL and 25, respectively.3.7 Sorption and desorption experiments
Batch experiments were carried out by bringing the SβCD-APTES@Fe2O3 sorbent (0.005 g) into contact with uranyl acetate (15 mL, initial metal concentration (C0): 0, 25, 50, 75, 100, 150 mg U L−1) in a stoppered conical flask. The samples were vortexed (at 2000 rpm) for 3 h at 25 ± 1 °C. After equilibration, magnetic separation (Fig. S7†) was performed and the residual uranium concentration in the supernatant (Ce, mg U L−1) in the aqueous phase was determined, while the concentration of metal ions sorbed onto SβCD-APTES@Fe2O3 (sorption capacity, qe, mg U g−1) was obtained using eqn (10).All these experiments were run in triplicate, and the experimental variation was systematically less than 3%.
The recycling and reusability of the sorbents were ascertained by comparing the sorption capacity at the end of each successive step in a series of 10 sorption/desorption cycles. The sorbent (0.02 g) was stirred with uranyl solution (100 mL, C0: 150 mg U L−1) for 3 h at 25 °C in a conical flask. After magnetic separation, the sorbent was recovered and the uranium concentration in the supernatant was determined using eqn (10). The metal-loaded sorbent (after being washed with demineralized water) was mixed with HNO3 (0.02 M) for 45 min at 25 °C. The metal concentration in the supernatant was used to derive the desorption yield for each step (eqn (10)).
3.8 Selectivity test
The selectivity test was performed by shaking SβCD-APTES@Fe2O3 (0.005 g) in an aqueous solution (15 mL) containing 20 mg L−1 UO2(OAc)2, MgCl2, KCl, NaCl, Cs(OAc) and AlCl3 for 3 h at pH 6 and 25 °C. The metal ions were analyzed by ICP-MS.Conclusions
APTES is used to modify and functionalize magnetic nanoparticles with succinyl-β-cyclodextrin to give succinyl-β-cyclodextrin-APTES@Fe2O3, a nanocomposite material which has remarkable potential for the recovery of uranium from aqueous solution. It is highly selective for uranium(VI) and stable in acid solution and has a long service life. The maximum sorption capacity for uranyl ions is close to 286 mg g−1 at pH 6. Nano-ITC shows that the adsorption process is exothermic and spontaneous, and the uptake kinetics are described by the pseudo-second-order model. The adsorption of U(VI) on SβCD-APTES@Fe2O3 is evaluated by means of Langmuir, Freundlich, Temkin, Elovich, and Halsey isotherms. XPS and FTIR measurements indicate that uranium is adsorbed by complexation. Cs-corrected STEM-HAADF provides a very impressive image of the uranium multilayer on the nanocomposite surface.Conflicts of interest
There are no conflicts to declare.Acknowledgements
The authors are grateful to Dr. John S. Lomas for fruitful discussions. ICP measurements are supported by the IPGP multidisciplinary program PARI and by Paris–IdF region SESAME (Grant no. 12015908). This work is supported by the National Research Agency program “DECRET” (ANR ANR-13-SECU-0001) and by Campus France.Notes and references
- B. Cao, S. Fan, X. Tan, M. Li and Y. Hu, Environ. Sci.: Nano, 2017, 4, 1670–1681 RSC.
- M. R. Awual, S. Suzuki, T. Taguchi, H. Shiwaku, Y. Okamoto and T. Yaita, Chem. Eng. J., 2014, 242, 127–135 CrossRef CAS.
- Y. Cai, C. Wu, Z. Liu, L. Zhang, L. Chen, J. Wang, X. Wang, S. Yang and S. Wang, Environ. Sci.: Nano, 2017, 4, 1876–1886 RSC.
- Z. Chen, Y. Liang, D. Jia, W. Chen, Z. Cui and X. Wang, Environ. Sci.: Nano, 2017, 4, 1851–1858 RSC.
- L. Li, M. Xu, M. P. Chubik, M. Chubik, A. A. Gromov, G. Wei and W. Han, RSC Adv., 2015, 5, 41611–41616 RSC.
- P. Lestaevel, P. Houpert, C. Bussy, B. Dhieux, P. Gourmelon and F. Paquet, Toxicology, 2005, 212, 219–226 CrossRef CAS PubMed.
- S. Yang, P. Zong, G. Sheng, Q. Wang and X. Wang, Chem. Eng. J., 2013, 214, 376–385 CrossRef CAS.
- M. G. Mahfouz, A. A. Galhoum, N. A. Gomaa, S. S. Abdel-Rehem, A. A. Atia, T. Vincent and E. Guibal, Chem. Eng. J., 2015, 262, 198–209 CrossRef CAS.
- M. Tan, C. Huang, S. Ding, F. Li, Q. Li, L. Zhang, C. Liu and S. Li, Sep. Purif. Technol., 2015, 146, 192–198 CrossRef CAS.
- A. Rout, K. A. Venkatesan, T. G. Srinivasan and P. R. Vasudeva Rao, J. Hazard. Mater., 2012, 221–222, 62–67 CrossRef CAS PubMed.
- T. A. Lasheen, M. E. Ibrahim, H. B. Hassib and A. S. Helal, Hydrometallurgy, 2014, 14, 175–182 CrossRef.
- M. E. Ibrahim, T. A. Lasheen, H. B. Hassib and A. S. Helal, J. Dispersion Sci. Technol., 2014, 35, 599–606 CrossRef CAS.
- I. Doroshenko, J. Zurkova, Z. Moravec, P. Bezdicka and J. Pinkas, Ultrason. Sonochem., 2015, 26, 157–162 CrossRef CAS PubMed.
- G. I. Nkou Bouala, N. Clavier, R. Podor, J. Cambedouzou, A. Mesbah, H. P. Brau, J. Léchelle and N. Dacheux, CrystEngComm, 2014, 16, 6944–6954 RSC.
- R. Ruhela, N. Lyer, A. K. Singh, R. C. Hubli and J. K. Chakravartty, Green Chem., 2015, 17, 827–830 RSC.
- A. C. Sather, O. B. Berryman and J. Rebek, Chem. Sci., 2013, 4, 3601–3605 RSC.
- J. Qian, S. Zhang, Y. Zhou, P. Dong and D. Hua, RSC Adv., 2015, 5, 4153–4161 RSC.
- C. Gunathilake, J. Górka, S. Dai and M. Jaroniec, J. Mater. Chem. A, 2015, 3, 11650–11659 CAS.
- S. D. Kolev, A. M. St John and R. W. Cattrall, J. Membr. Sci., 2013, 425–426, 169–175 CrossRef CAS.
- S. Panja, P. K. Mohapatra, S. C. Tripathi, P. M. Gandhi and P. Janardan, J. Hazard. Mater., 2012, 237–238, 339–346 CrossRef CAS PubMed.
- K. W. Kim, J. T. Hyun, K. Y. Lee, E. H. Lee, D. Y. Chung and J. K. Moon, Ind. Eng. Chem. Res., 2012, 51, 6275–6282 CrossRef CAS.
- M. L. Afonso, A. Gomes, A. Carvalho, L. C. Alves, F. Wastin and A. P. Gonçalves, Electrochim. Acta, 2009, 54, 7318–7323 CrossRef CAS.
- M. Korenko, M. Straka, L. Szatmáry, M. Ambrová and J. Uhlíř, J. Nucl. Mater., 2013, 440, 332–337 CrossRef CAS.
- M. Khajeh, S. Laurent and K. Dastafkan, Chem. Rev., 2013, 113, 7728–7768 CrossRef CAS PubMed.
- Y. Wang, Z. Gu, J. Yang, J. Liao, Y. Yang, N. Liu and J. Tang, Appl. Surf. Sci., 2014, 320, 10–20 CrossRef CAS.
- S. Lee, W. Li, C. Kim, M. Cho, J. G. Catalano, B. J. Lafferty, P. Decuzzib and J. D. Fortner, Environ. Sci.: Nano, 2015, 2, 500–508 RSC.
- J. Florek, F. Chalifour, F. Bilodeau, D. Larivière and F. Kleitz, Adv. Funct. Mater., 2014, 24, 2668–2676 CrossRef CAS.
- N. Li, L. Zhang, Y. Chen, M. Fang, J. Zhang and H. Wang, Adv. Funct. Mater., 2011, 22, 835–841 CrossRef.
- S. Choi and Y. Nho, Radiat. Phys. Chem., 2000, 57, 187–193 CrossRef CAS.
- A. J. Semiao, H. Rossiter and A. I. Schafer, J. Membr. Sci., 2010, 348, 174–180 CrossRef CAS.
- M. Manos and M. Kanatzidis, J. Am. Chem. Soc., 2012, 134, 16441–16446 CrossRef CAS PubMed.
- D. Shao, J. Hu and X. Wang, Plasma Processes Polym., 2010, 7, 977–985 CrossRef CAS.
- K. Hu, J. Sun, Z. Guo, P. Wang, Q. Chen, M. Ma and N. Gu, Adv. Mater., 2015, 27, 2507–2514 CrossRef CAS PubMed.
- R. Di Corato, A. Espinosa, L. Lartigue, M. Tharaud, S. Chat, T. Pellegrino, C. Menager, F. Gazeau and C. Wilhelm, Biomaterials, 2014, 35, 6400–6411 CrossRef CAS PubMed.
- M. Mazario, A. Forget, H. Belkahla, J. S. Lomas, P. Decorse, A. Chevillot-Biraud, P. Verbeke, C. Wilhelm, S. Ammar, J. M. El Hage Chahine and M. Hémadi, IEEE Trans. Magn., 2017, 53, 1–6 CrossRef.
- J. Hai, H. Piraux, E. Mazario, J. Volatron, N. T. Ha-Duong, P. Decorse, J. S. Lomas, P. Verbeke, S. Ammar, C. Wilhelm, J. M. El Hage Chahine and M. Hémadi, J. Mater. Chem. B, 2017, 5, 3154–3162 RSC.
- Y. Liu, G. Zhang, Q. Guo, L. Ma, Q. Jia, L. Liu and J. Zhou, Biomaterials, 2017, 112, 204–217 CrossRef CAS PubMed.
- Y. Wang and H. Gu, Adv. Mater., 2014, 27, 576–585 CrossRef PubMed.
- S. Shylesh, V. Schünemann and W. R. Thiel, Angew. Chem., Int. Ed., 2010, 49, 3428–3459 CrossRef CAS PubMed.
- D. Yamaguchi, K. Furukawa, M. Takasuga and K. Watanabe, Sci. Rep., 2014, 4, 6053 CrossRef PubMed.
- X. Zhang, J. Wang, R. Li, Q. Dai, R. Gao, Q. Liu and M. Zhang, Ind. Eng. Chem. Res., 2013, 52, 10152–10159 CrossRef CAS.
- M. Khoobi, M. Khalilvand-Sedagheh, A. Ramazani, Z. Asadgol, H. Forootanfarc and M. Faramarzia, J. Chem. Technol. Biotechnol., 2014, 91, 375–384 CrossRef.
- A. Z. M. Badruddoza, A. S. H. Ta, P. Y. Tan, K. Hidajat and M. S. Uddin, J. Hazard. Mater., 2011, 185, 1177–1186 CrossRef CAS PubMed.
- J. Szejtli, Chem. Rev., 1998, 98, 1743–1754 CrossRef CAS PubMed.
- M. V. Rekharsky and Y. Inoue, Chem. Rev., 1998, 98, 1875–1918 CrossRef CAS PubMed.
- M. E. Skold, G. D. Thyne, J. W. Drexler and J. E. McCray, J. Contam. Hydrol., 2009, 107, 108–113 CrossRef CAS PubMed.
- S. S. Banerjee and D. H. Chen, Nanotechnology, 2008, 19, 265601–265607 CrossRef PubMed.
- P. Castillo, M. Mata, M. Casula, J. Sanchez-Alcazar and A. Zaderenko, Beilstein J. Nanotechnol., 2014, 5, 1312–1319 CrossRef PubMed.
- R. Chalasani and S. Vasudevan, J. Mater. Chem., 2012, 22, 14925–14931 RSC.
- W. Wang, Z. H. Jin, L. Li, H. Zhang and S. Gao, Chemosphere, 2006, 65, 1396–1404 CrossRef CAS PubMed.
- M. F. Hasan, A. M. Seyam and H. A. Hodali, Polyhedron, 1992, 11, 1733–1736 CrossRef CAS.
- D. James, G. Venkateswaran and T. P. Rao, Microporous Mesoporous Mater., 2009, 119, 165–170 CrossRef CAS.
- A. M. Shallaby, M. M. Mostafa, K. M. Ibrahim and M. N. H. Moussa, Spectrochim. Acta, Part A, 1984, 40, 999–1002 CrossRef.
- G. Tian, J. Geng, Y. Jin, C. Wang, S. Li, Z. Chen, H. Wang, Z. Zhao and S. Li, J. Hazard. Mater., 2011, 190, 442–450 CrossRef CAS PubMed.
- A. Yacoutanour, A. K. T. Maki and M. M. Mostafa, Spectrochim. Acta, Part A, 1988, 44, 1291–1296 CrossRef.
- A. J. Varma, S. V. Deshpande and J. F. Kennedy, Carbohydr. Polym., 2004, 55, 77–93 CrossRef CAS.
- A. Mayoral, T. Carey, P. A. Anderson and I. Diaz, Microporous Mesoporous Mater., 2013, 166, 117–122 CrossRef CAS.
- G. Crini, H. N. Peindy, F. Gimbert and C. Robert, Sep. Purif. Technol., 2007, 53, 97–110 CrossRef CAS.
- F. C. Wu, R. L. Tseng and R. S. Juang, Water Res., 2001, 35, 613–618 CrossRef CAS PubMed.
- J. Wang, R. Peng, J. Yang, Y. Liuc and X. Hu, Carbohydr. Polym., 2011, 84, 1169–1175 CrossRef CAS.
- J. Febrianto, A. N. Kosasih, J. Sunarso, Y. Ju, N. Indraswati and S. Ismadji, J. Hazard. Mater., 2009, 162, 616–645 CrossRef CAS PubMed.
- K. Y. Foo and B. H. Hameed, Chem. Eng. J., 2010, 156, 2–10 CrossRef CAS.
- H. Parab, S. Joshi, N. Shenoy, R. Verma, A. Lali and M. Sudersanan, Bioresour. Technol., 2005, 96, 1241–1248 CrossRef CAS PubMed.
- T. W. Webber and R. K. Chakkravorti, AIChE J., 1974, 20, 228–238 CrossRef.
- A. D. Site, J. Phys. Chem. Ref. Data, 2001, 30, 187 CrossRef.
- F. Haghseresht and G. Q. Lu, Energy Fuels, 1998, 12, 1100–1107 CrossRef CAS.
- K. Biswaw, S. K. Saha and U. C. Ghosh, Ind. Eng. Chem. Res., 2007, 46, 5346–5356 CrossRef.
- C. Aharoni and M. Ungarish, J. Chem. Soc., Faraday Trans., 1977, 73, 456–464 RSC.
- H. K. Boparai, M. Joseph and D. M. O'Carroll, J. Hazard. Mater., 2011, 186, 458–465 CrossRef CAS PubMed.
- D. Das, M. K. Sureshkumar, S. Koley, N. Mithal and C. G. S. Pillai, J. Radioanal. Nucl. Chem., 2010, 285, 447–454 CrossRef CAS.
- D. Shao, Z. Jiang, X. Wang, J. Li and Y. Meng, J. Phys. Chem. B, 2009, 113, 860–864 CrossRef CAS PubMed.
- S. Sadeghi, H. Azhdari, H. Arabi and A. Z. Moghaddam, J. Hazard. Mater., 2012, 215–216, 208–216 CrossRef CAS PubMed.
- L. Huang, L. Zhang and D. Hua, J. Radioanal. Nucl. Chem., 2015, 305, 445–453 CrossRef CAS.
- M. Mazario, A. S. Helal, J. Stemper, A. Mayoral, P. Decorse, A. Chevillot-Biraud, S. Nowak, C. Perruchot, C. Lion, R. Losno, T. Le Gall, S. Ammar, J. M. El Hage Chahine and M. Hémadi, AIP Adv., 2017, 7, 056702 CrossRef.
- C. Ding, W. Chengc, Z. Jina and Y. Suna, J. Mol. Liq., 2015, 207, 224–230 CrossRef CAS.
- J. Xiao, Y. Chen and J. Xu, J. Ind. Eng. Chem., 2014, 20, 2830–2839 CrossRef CAS.
- W. Song, D. Shao and S. Lu, Sci. China: Chem., 2014, 57, 1291–1299 CrossRef CAS.
- S. Y. Elovich and O. G. Larinov, Izv. Akad. Nauk SSSR, Ser. Khim., 1962, 2, 209–216 Search PubMed.
- A. S. Helal, P. Decorse, C. Perruchot, S. Novak, C. Lion, S. Ammar, J. M. El Hage Chahine and M. Hémadi, AIP Adv., 2016, 6, 056601 CrossRef.
- H. Basti, L. Ben Tahar, L. S. Smiri, F. Herbst, M. J. Vaulay, F. Chau, S. Ammar and S. Benderbous, J. Colloid Interface Sci., 2010, 341, 248–254 CrossRef CAS PubMed.
- D. Caruntu, B. L. Cushing, G. Caruntu and C. J. O'Connor, Chem. Mater., 2005, 17, 3398–3402 CrossRef CAS.
- H. Piraux, J. Hai, P. Verbeke, N. Serradji, S. Ammar, R. Losno, N. T. Ha-Duong, M. Hémadi and J. M. El Hage Chahine, Biochim. Biophys. Acta, 2013, 1830, 4254–4264 CrossRef CAS PubMed.
- T. Roisnel and J. Rodriguez-Carvajal, Mater. Sci. Forum, 2000, 378–381, 118–123 Search PubMed.
Footnote |
| † Electronic supplementary information (ESI) available. See DOI: 10.1039/c7en00902j |
| This journal is © The Royal Society of Chemistry 2018 |

