 Open Access Article
Temporal trends of halogenated flame retardants in the atmosphere of the Canadian Great Lakes Basin (2005–2014)†
Chubashini
Shunthirasingham
 ,
Nick
Alexandrou
 ,
Kenneth A.
Brice
 ,
Helena
Dryfhout-Clark
 ,
Ky
Su
 ,
Cecilia
Shin
 ,
Richard
Park
 ,
Artur
Pajda
 ,
Ronald
Noronha
 and
Hayley
Hung
 *
*
Air Quality Processes Research Section, Environment and Climate Change Canada, 4905 Dufferin St, ON, M3H 5T4 Canada. E-mail: Hayley.Hung@canada.ca; Tel: +1-416-739-5944
First published on 20th February 2018
Abstract
Organic pollutants have been monitored in the atmosphere of the Great Lake Basin (GLB) since the 1990s in support of the Canada-US Great Lakes Water Quality Agreement and to determine the effectiveness of source reduction measures and factors influencing air concentrations. Air samples were collected between 2005 and 2014 at three sites with different geographical characteristics (Burnt Island, Egbert and Point Petre) in the Canadian GLB using high-volume air samplers and the air samples were analyzed for polybrominated diphenyl ethers (PBDEs) and several other non-PBDE halogenated flame retardants (HFRs). Spatial and temporal trends of total concentrations of HFRs were examined. BDE-47, BDE-99, and BDE-209 were the dominant PBDE congeners found at the three sites. For the non-PBDE HFRs, allyl 2,4,6-tribromophenyl ether (TBP-AE), hexabromobenzene (HBBz), pentabromotoluene (PBT), anti-dechlorane plus (anti-DDC-CO) and syn-dechlorane plus (syn-DDC-CO) were frequently detected. High atmospheric concentrations of PBDEs were found at the Egbert site with a larger population, while lower levels of PBDEs were detected at Point Petre, which is close to urban centers where control measures are in place. The strong temperature dependence of air concentrations indicates that volatilization from local sources influences atmospheric concentrations of BDE-28 and BDE-47 at Point Petre and Burnt Island, while long-range atmospheric transport (LRAT) was important for BDE-99. However, a weaker correlation was observed between air concentrations and ambient temperature for non-PBDE HFRs such as TBP-AE and HBBz. Atmospheric PBDE concentrations are decreasing slowly, with half-lives in the range of 2–16 years. Faster declining trends of PBDEs were observed at Point Petre rather than at Burnt Island. As Point Petre is closer to urban centers, faster declining trends may reflect the phase out of technical BDE mixtures in urban centers while LRAT influences the air concentrations at Burnt Island. The levels of syn-DDC-CO and anti-DDC-CO are decreasing at Point Petre and the levels of other non-PBDE HFRs such as TBP-AE, PBT and HBBz are increasing. Long-term declining trends of PBDEs suggest that regulatory efforts to reduce emissions to the GLB environment have been effective but that continuous measurements are required to gain a better understanding of the trends of emerging chemicals in the atmosphere of the GLB.
Environmental significanceMajor changes in usage patterns and production quantities of halogenated flame retardants (HFRs) over the last decade have occurred. Long term monitoring data will help us to determine if the HFR concentrations are changing in the atmosphere with time and at what rate. Spatial and temporal variations of HFRs in the Canadian Great Lakes atmosphere over the time period of 2005–2014 were examined. Air monitoring data at the Great Lakes Basin (GLB) show that polybrominated diphenyl ether (PBDE) and some non-PBDE HFR concentrations have declined at the GLB. The long-term trends of PBDEs suggest that regulatory efforts to decrease emission of these compounds in North America have been effective. |
Introduction
Flame retardants (FRs) have been applied in a variety of commercial products (such as polyurethane foam, building insulation foams, plastics, textiles and electronics) to prevent fires.1 Due to regulations aimed at reducing death and injury, the market for FRs has grown rapidly. Polybrominated diphenyl ethers (PBDEs) have been some of the most widely used brominated flame retardants for decades as additives in household and commercial products.2 Due to their bio-accumulative, persistent, toxic properties and long-range atmospheric transport (LRAT) potential,3–8 they are considered to be a risk to human and wildlife health. As a result, technical Penta- and Octa-brominated diphenyl ether (BDE) mixtures were phased out in the European Union in 2004 and in North America in 2005.9 Deca-BDE was phased-out in Canada and the United States at the end of 2013.10,11 Deca-BDE was exempt from the EU Directive on the restriction of use of certain hazardous substances in electrical and electronic equipment [Restriction of Hazardous Substances (RoHS) Directive], but this exemption was challenged and overturned in courts in April 2008; thus the use of Deca-BDE has been banned in the EU in electrical and electronic applications since July 2008.9These regulations and bans described above have led to an increased demand and production of non-regulated FRs. After PBDE use was phased out, several non-PBDE halogenated flame retardants (HFRs) were introduced into the market. For example, DP-45, Firemaster 550 and Firemaster BZ-54 were used to replace the Penta-BDE mixture. The major components of these commercial products are 2-ethylhexyl-2,3,4,5-tetrabromobenzoate (EH-TBB) and bis(2-ethylhexyl)tetrabromophthalate (BEH-TEBP).2 1,2-Bis(2,4,6-tribromophenoxy)-ethane (BTBPE) has been produced since the mid-1970s and is used to replace the Octa-BDE mixture.2 Decabromodiphenyl ethane (DBDPE) has been produced and used for more than 25 years and it became a commercially important alternative to Deca-BDE in the early 1990s.2 Although some other non-PBDE HFRs such as hexabromobenzene (HBBz), pentabromoethylbenzene (PBEB), pentabromotoluene (PBT), and dechlorane plus (DDC-CO) have been manufactured and used for several decades, very little attention has been given to them until the phase-out of BDE technical mixtures. For instance, DDC-CO replaced mirex, which was used as a pesticide and as a FR until it was banned in the 1970s in North America due to its toxicity.12,13 DDC-CO is a high volume production chemical and has been in use since 1986.12,13 It was first detected in the atmosphere, sediments, and fish of the Great Lakes in 2006.14 A number of non-PBDE HFRs are of concern because they are found in pristine environments and very little is known about their persistence and LRAT potential. More studies are required to determine the environmental fate and LRAT potential of the emerging HFRs.
Major changes in usage patterns and production quantities of HFRs over the last decade have occurred. Long term monitoring data will assist in determining if the levels of HFRs are changing in the atmosphere with time and at what rate. Long-term atmospheric monitoring stations on the shores of the Great Lakes Basin (GLB) in the US and Canada have been in operation since 1990. The Integrated Atmospheric Deposition Network (IADN) was established in 1989 as a joint effort between Canada and the US in support of the Great Lakes Water Quality Agreement. Canada's Monitoring and Surveillance in the GLB under the Chemicals Management Plan contributes measurement data to this joint effort. One of the main goals of this collaboration is to measure atmospheric concentrations of persistent organic pollutants and other emerging contaminants in the GLB, determining temporal and spatial trends by which the effectiveness of control measures can be evaluated. Organochlorine pesticides, polychlorinated biphenyls and polycyclic aromatic hydrocarbons were the early analytes of interest of this network and HFRs were added to the analyte list in 2005. Spatial and temporal trends of PBDEs and some non-PBDE HFRs have been reported for the US IADN sites.11,15–18 A very recent study by Liu et al.19 reported atmospheric concentrations and detailed trends of PBDEs, PBEB, HBBz, BTBPE, DBDPE and anti- and syn-DDC-CO over the time period of 2005–2013 and EH-TBB and BEH-TEBP over the time period of 2008–2013. However, detailed spatial and temporal trend analyses of HFRs in air samples collected at the Canadian sites in the GLB have not yet been reported. The aim of this study is to examine the long-term spatial and temporal variations of PBDEs and several non-PBDE HFRs in the Canadian Great Lakes atmosphere over the time period of 2005–2014.
Experimental procedure and data analysis
Air sampling
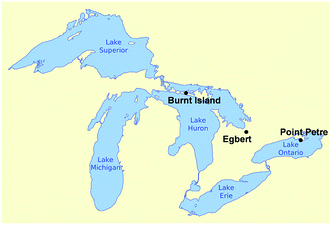
Air samples were collected at two regionally representative rural master stations on Lakes Huron (Burnt Island; 45° 49′ 42′′ N, 82° 56′ 53′′ W) and Ontario (Point Petre; 43° 50′ 34′′ N, 77° 09′ 13′′ W) and at one rural satellite station on Lake Huron (Egbert; 44° 13′ 57′′ N, 79° 46′ 53′′ W) (Fig. 1). Air samples were collected at Burnt Island, Point Petre and Egbert from January 2005 to March 2013, from January 2005 to December 2014 and from January 2005 to March 2008, respectively. Twenty-four-hour air samples were collected once every 12 days from January 2005 to March, 2013; starting in April 2013, samples were collected every 36 days.Air sample collection procedures have been summarized by Wu et al.20 In brief, air samples were collected (24 h integrated, approximately 350 m3 volume) with a PS-1 high volume air sampler equipped with a glass fiber filter (GFF) and a polyurethane foam (PUF) plug to allow for separate determination of particle-phase and vapour-phase airborne contaminants. From January 2011, two PUF plugs were used in series to collect gas phase organics at Point Petre to evaluate the breakthrough of volatile compounds in the summer [see ESI Section S1.1 for details†].
Analysis of air samples
PUF and GFF sampling media were analyzed separately for HFR composition. Detailed descriptions of the procedures used for extraction, cleanup and final instrumental determination of the target analytes are provided in Section S1.2.† The PUFs were Soxhlet extracted with hexane and the GFFs were extracted with a Dionex ASE200 system using a hexane and acetone mixture (7![[thin space (1/6-em)]](https://www.rsc.org/images/entities/char_2009.gif) :
:![[thin space (1/6-em)]](https://www.rsc.org/images/entities/char_2009.gif) 3; v/v).21 The PUF extracts were dried with anhydrous sodium sulfate; both GFF and PUF extracts were concentrated and cleaned on a silica column. PBDEs and non-PBDE HFRs in the PUF and GFF extracts were analysed using gas chromatography-electron capture negative ion mass spectrometry (GC-ECNIMS), except for BDE-209 and decabromodiphenyl ethane (DBDPE), which were analyzed using GC-electron capture detection (GC-ECD) because of the higher sensitivity of GC-ECD than GC-ECNIMS for these two compounds. A short Rtx-1614 column (15 m × 0.25 mm i.d. × 0.10 μm film thickness) was used for BDE-209 and DBDPE analyses by GC-ECD and a longer DB-5 column (30 m × 0.25 mm i.d. × 0.25 μm film thickness) was used for analyzing the other PBDEs and non-PBDE HFRs by GC-ECNIMS. Air extracts were analyzed for 15 PBDE congeners (BDE-17, -28, -47, -49, -66, -71, -85, -99, -100, -139, -153, -154, -183, -190 and -209), and 13 non-PBDE HFRs [hexabromobenzene (HBBz), hexabromocyclododecane (HBCDD), 2-ethylhexyl-2,3,4,5-tetrabromobenzoate (EH-TBB), bis(2-ethylhexyl)tetrabromophthalate (BEH-TEBP), allyl 2,4,6-tribromophenyl ether (TBP-AE), 2-bromoallyl-2,4,6-tribromophenyl ether (TBP-BAE), pentabromoethylbenzene (PBEB), pentabromotoluene (PBT), anti-dechlorane plus (anti-DDC-CO), syn-dechlorane plus (syn-DDC-CO), 2,3-dibromopropyl-2,4,6-tribromophenyl ether (TBP-DBPE), DBDPE, and 1,2-bis(2,4,6-tribromophenoxy) ethane (BTBPE)]. HBCDD is reported as the sum of three isomers. All target analytes were quantified using external standard calibration methods.
3; v/v).21 The PUF extracts were dried with anhydrous sodium sulfate; both GFF and PUF extracts were concentrated and cleaned on a silica column. PBDEs and non-PBDE HFRs in the PUF and GFF extracts were analysed using gas chromatography-electron capture negative ion mass spectrometry (GC-ECNIMS), except for BDE-209 and decabromodiphenyl ethane (DBDPE), which were analyzed using GC-electron capture detection (GC-ECD) because of the higher sensitivity of GC-ECD than GC-ECNIMS for these two compounds. A short Rtx-1614 column (15 m × 0.25 mm i.d. × 0.10 μm film thickness) was used for BDE-209 and DBDPE analyses by GC-ECD and a longer DB-5 column (30 m × 0.25 mm i.d. × 0.25 μm film thickness) was used for analyzing the other PBDEs and non-PBDE HFRs by GC-ECNIMS. Air extracts were analyzed for 15 PBDE congeners (BDE-17, -28, -47, -49, -66, -71, -85, -99, -100, -139, -153, -154, -183, -190 and -209), and 13 non-PBDE HFRs [hexabromobenzene (HBBz), hexabromocyclododecane (HBCDD), 2-ethylhexyl-2,3,4,5-tetrabromobenzoate (EH-TBB), bis(2-ethylhexyl)tetrabromophthalate (BEH-TEBP), allyl 2,4,6-tribromophenyl ether (TBP-AE), 2-bromoallyl-2,4,6-tribromophenyl ether (TBP-BAE), pentabromoethylbenzene (PBEB), pentabromotoluene (PBT), anti-dechlorane plus (anti-DDC-CO), syn-dechlorane plus (syn-DDC-CO), 2,3-dibromopropyl-2,4,6-tribromophenyl ether (TBP-DBPE), DBDPE, and 1,2-bis(2,4,6-tribromophenoxy) ethane (BTBPE)]. HBCDD is reported as the sum of three isomers. All target analytes were quantified using external standard calibration methods.
Quality control and assurance (QA/QC)
Details can be found in S1.3.† Laboratory and field blanks were processed the same way as air samples. Recoveries from blank PUF and blank GFF spikes were 75–97% and 83–97% for PBDEs, respectively. Recoveries for non-PBDE HFRs were 60–83% for PUF and 66–98% for GFF. Silica column PUF and GFF spike recoveries were 91–99% for PBDEs and 83–98% for non-PBDE HFRs. Analysis of common reference standards and matrix spikes was used to provide information about laboratory performance.20 Method detection limits (MDLs) are shown on trend plots and defined as annual mean plus three times the standard deviation of the blanks. For those HFRs that were not detected in the blanks, MDLs were calculated as the average instrument detection limit plus three times the standard deviation. Annual mean and standard deviation for field and laboratory blanks are reported in Table S1.† The % breakthrough for highly volatile compounds is reported in Table S2.† The % breakthrough is less than 33%, except for TBP-AE, which is 38%.Data management
Final air concentration data quality was assessed using the interactive SAS-based Research Data Management and Quality Control System™22 with flagging capability to ensure consistent data treatment (see Section S1.4† for details).Temporal trends and apparent first order half-lives
Temporal trend analysis was performed using the digital filtration (DF) method. DF is a statistical procedure in which temporal trends and seasonal cycles are fitted using a Reinsch-type cubic spline and Fourier components, respectively, by an iterative fitting technique. Detailed descriptions and applications of this method can be found elsewhere.23–25 Outliers more than 3 standard errors away from the fitted curve were rejected after each iterative fit. Long- and short-term variations were then extracted using two Butterworth digital filters with a short-term cutoff period of 4 months, and a long-term cutoff period of 60 months. Variabilities between 4 and 60 months refine the overall seasonal cycle, and those longer than 60 months render the final long-term trend. The cutoff periods, which produced the “best fit” to the specific dataset, were chosen by visual inspection of the fitted seasonal cycle and trend. Non-detects were not included in the determination of temporal trends.For each chemical, an apparent first order half-life (t1/2) or doubling time (t2) was estimated by dividing ln![[thin space (1/6-em)]](https://www.rsc.org/images/entities/char_2009.gif) 2 with the negative or positive value of the linear regression slope of the trend line between the natural log of air concentrations ln
2 with the negative or positive value of the linear regression slope of the trend line between the natural log of air concentrations ln![[thin space (1/6-em)]](https://www.rsc.org/images/entities/char_2009.gif) CA (pg m−3), and time (year). Some HFRs do not necessarily decline or incline linearly; i.e. the trends do not change consistently throughout the sampling periods. The halflives and doubling times presented here are only used to compare the relative rates of decline and incline among sites.
CA (pg m−3), and time (year). Some HFRs do not necessarily decline or incline linearly; i.e. the trends do not change consistently throughout the sampling periods. The halflives and doubling times presented here are only used to compare the relative rates of decline and incline among sites.
Results and discussion
Air concentrations of HFRs and spatial patterns in the GLB
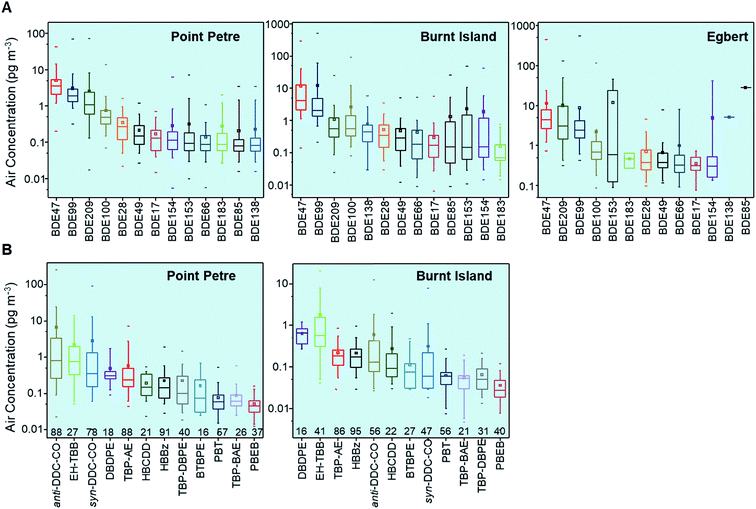
27 target analyte species were detected in the air samples collected, but with different frequencies. For PBT, only gas phase concentrations are reported and used to generate all the plots in this study since blank to sample concentration ratios of the particle phase were high (greater than 75%) for this compound. Annual mean, minimum, and maximum for gas and particle phase HFRs at Point Petre, Burnt Island and Egbert are reported in ESI Table S3,† whereas total air concentrations (gas plus particle phases) of PBDE congeners (BDE-17, -28, -47, 49, -66, -85, -99, -100, 138, -153, -154, -183 and -209) at Point Petre, Egbert and Burnt Island, non-PBDE HFRs (DBDPE, EH-TBB, TBP-AE, HBBz, anti-DDC-CO, HBCDD, TBP-BAE, BTBPE, TBP-DBPE, PBEB and syn-DDC-CO), and only gas phase concentrations of PBT at Burnt Island and Point Petre are summarized in box-and-whisker plots (Fig. 2). Air sampling at the Egbert site was discontinued in April 2008 and non-PBDE HFRs were only included in the analytical list for samples collected from the beginning of 2008. Therefore, the air concentrations of non-PBDE HFRs at the Egbert site are not displayed in Fig. 2 but they are reported in ESI Table S3† (January 2008 to March 2008). The PBDEs and non-PBDE HFRs are arranged from the highest to the lowest median concentrations in Fig. 2. BDE-47 and BDE-99 are the dominant PBDE congeners in the GLB atmosphere, followed by BDE-209. BDE-47, BDE-99 and BDE-209 are the main components of Penta-BDE and Deca-BDE technical mixtures respectively.26 Penta-BDE and Deca-BDE technical mixtures were heavily used until the mixtures were withdrawn from the market in North America in 2005![[thin space (1/6-em)]](https://www.rsc.org/images/entities/char_2009.gif) 9 (Penta-BDE) and 2013
9 (Penta-BDE) and 2013![[thin space (1/6-em)]](https://www.rsc.org/images/entities/char_2009.gif) 10,11 (Deca-BDE). For non-PBDE HFRs, TBP-AE, HBBz, PBT, anti-DDC-CO and syn-DDC-CO were frequently detected (greater than 47% of samples) (Fig. 2) while BTBPE, DBDPE, HBCDD, TBP-DBPE, TBP-BAE, EH-TBB and PBEB were detected in less than 40% of the samples (Fig. 2). Slightly different chemical profiles for these species (Fig. 2B and S1†) at the two sites are apparent. The particle bound compounds such as anti- and syn-DDC-CO dominated in the air samples from Point Petre, whereas at Burnt Island, gas-phase compounds (EH-TBB and TBP-DBPE) dominated in the air. This suggests that air concentrations of non-PBDE HFRs at Burnt Island are influenced by atmospheric transport of relatively more volatile substances.
10,11 (Deca-BDE). For non-PBDE HFRs, TBP-AE, HBBz, PBT, anti-DDC-CO and syn-DDC-CO were frequently detected (greater than 47% of samples) (Fig. 2) while BTBPE, DBDPE, HBCDD, TBP-DBPE, TBP-BAE, EH-TBB and PBEB were detected in less than 40% of the samples (Fig. 2). Slightly different chemical profiles for these species (Fig. 2B and S1†) at the two sites are apparent. The particle bound compounds such as anti- and syn-DDC-CO dominated in the air samples from Point Petre, whereas at Burnt Island, gas-phase compounds (EH-TBB and TBP-DBPE) dominated in the air. This suggests that air concentrations of non-PBDE HFRs at Burnt Island are influenced by atmospheric transport of relatively more volatile substances.
The total concentrations of the 15 congeners (∑15PBDEs) ranged from 1.2 to 160 pg m−3, with an annual average of 5.7–22 pg m−3 and an annual median of 5.1–15 pg m−3 at Point Petre; from 1.1 to 1000 pg m−3 with an annual average of 14–60 pg m−3 and an annual median of 6.3–23 pg m−3 at Burnt Island; and from 1.9 to 1300 pg m−3 with an annual average of 11–63 pg m−3 and an annual median of 9.0–21 pg m−3 at Egbert. The concentrations of ∑12 non-PBDE HFRs ranged from 0.17 to 340 pg m−3, with an annual average of 3.4–23 pg m−3 and annual median of 1.1–3.8 pg m−3 at Point Petre; and from 0.10 to 21 pg m−3, with an annual average of 0.40–4.8 pg m−3 and median of 0.20–1.3 pg m−3 at Burnt Island. One-way analysis of variance (ANOVA) showed that the HFR concentrations are significantly different among the three sites (p < 0.05). The median levels of ∑15PBDEs in air samples were the lowest at the remote site of Point Petre but were similar between Egbert (rural) and Burnt Island (most remote). High atmospheric concentrations of PBDEs have been observed in urban regions with a high population.11,15,17 The three sites (Point Petre, Burnt Island and Egbert) have different geographical characteristics. Point Petre is a remote site on Lake Ontario with potential influence from urban centers, e.g. Toronto and Rochester. Also a remote site, Burnt Island is located on the southwestern end of Manitoulin Island in northern Lake Huron which may be influenced by the nearby mining/industrial towns of Sudbury and Sault Ste. Marie. Egbert is close to Toronto, with a large residential population of 244![[thin space (1/6-em)]](https://www.rsc.org/images/entities/char_2009.gif) 446 within a 25 km radius of the site (as compared to 48
446 within a 25 km radius of the site (as compared to 48![[thin space (1/6-em)]](https://www.rsc.org/images/entities/char_2009.gif) 948 at Burnt Island and 15
948 at Burnt Island and 15![[thin space (1/6-em)]](https://www.rsc.org/images/entities/char_2009.gif) 996 at Point Petre).27 Local population density determines the spatial trends of PBDEs, such that higher PBDE concentrations are associated with the larger populations at Egbert, while more efficient phase out of PBDE products at urban centers (e.g. Toronto) is most likely responsible for the lower levels detected at Point Petre (see the trend analysis below). Ratios between the dominant PBDE congeners (BDE-47 and -99) and anti-DDC-CO and total DDC-CO were determined (see ESI Section S2 for details†). High ratios of BDE-47/-99 were observed in the GLB air samples, suggesting that BDE-47 must be coming from secondary emissions (e.g. from soils) or primary emissions (e.g. from BDE treated products).
996 at Point Petre).27 Local population density determines the spatial trends of PBDEs, such that higher PBDE concentrations are associated with the larger populations at Egbert, while more efficient phase out of PBDE products at urban centers (e.g. Toronto) is most likely responsible for the lower levels detected at Point Petre (see the trend analysis below). Ratios between the dominant PBDE congeners (BDE-47 and -99) and anti-DDC-CO and total DDC-CO were determined (see ESI Section S2 for details†). High ratios of BDE-47/-99 were observed in the GLB air samples, suggesting that BDE-47 must be coming from secondary emissions (e.g. from soils) or primary emissions (e.g. from BDE treated products).
The levels of PBDEs and non-PBDE HFRs at the Canadian GLB sites were compared with those measured at remote/background/rural sites around the globe11,15–19,28–50 between 2005 and 2014 in a Box-and-whisker Plot (Fig. 3). The PBDE concentrations in the GLB atmosphere are higher than those observed in the Arctic and Antarctica, the air over oceans, and Europe but lower than those in Asia and Africa and similar to those found at the US IADN sites. For non-PBDE HFRs, the air concentrations that were measured at the GLB are comparable to those found in the Arctic and Antarctica, Europe and Asia, but lower than in the air over oceans, Africa and the US IADN sites, reflecting substantial differences in the use of FRs in different parts of the world.
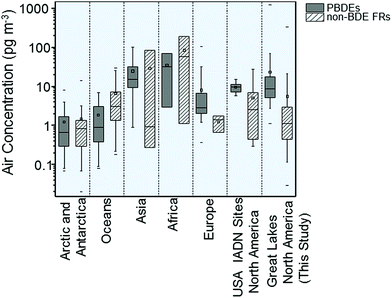 | ||
| Fig. 3 Comparison of air concentrations of PBDEs and non-PBDE HFRs at the Canadian GLB with the levels at remote sites around the world.11,15–19,28–50 | ||
Congener profiles
The relative congener abundance is calculated from individual congeneric concentrations divided by the total concentrations of 13PBDEs (∑13PBDE). Fig. 4 shows the relative abundance of PBDE congeners for the air samples collected from 2005 to 2014. BDE-47, -99, -100, and -209 accounted for 92–97% of the ∑13PBDE mixture in GLB air. These results suggest that the main sources to the GLB were associated with emissions from commercial products that were treated with Penta- and Deca-BDE technical mixtures.The congener composition was similar at Point Petre, Burnt Island, and Egbert until 2006, such that BDE-47 was the most abundant congener, and BDE-99 and -209 were the second and third most abundant. After 2006, BDE-209 was the most abundant congener, and BDE-47 and -99 were the second and third most abundant at the Egbert site. The production of Penta-BDE was voluntarily discontinued in North America at the end of 2005,9 whereas Deca-BDE was withdrawn from the market at the end of 2013.10,11 North America production was dominated by Deca-BDE after 2005, which was reflected in the congener composition in air samples collected at Egbert (which is in a residential area). A lower proportion of BDE-209 was found at Burnt Island. BDE-209 is mostly associated with particles,4 which makes it difficult to be transported to remote regions due to particle removal from the atmosphere via deposition.
Seasonality and temperature dependence
Fig. 5, 6, S2 and S3† show the seasonal profiles of total air concentrations (gas plus particle phases) for five PBDEs, and four non-PBDE HFRs in the GLB. As shown in the Fig. 5 and S2,† the concentrations of volatile compounds such as BDE-28, BDE-47, TBP-AE and HBBz in the air showed summer maxima, indicating the influence of air temperature. These compounds can volatilize more easily due to high temperatures, resulting in the higher concentrations of these chemicals in summer than in winter. Particle-bound PBDEs (BDE-153 and -209) and non-PBDE HFRs (anti-DDC-CO and syn-DDC-CO) showed no seasonality. Gas-particle partitioning analysis was performed for 114 sampling events and the results are reported in the ESI (see ESI Section S3† for details). Results indicate that different sampling sites seem to receive particles with different sorptive properties as a result of their different origins.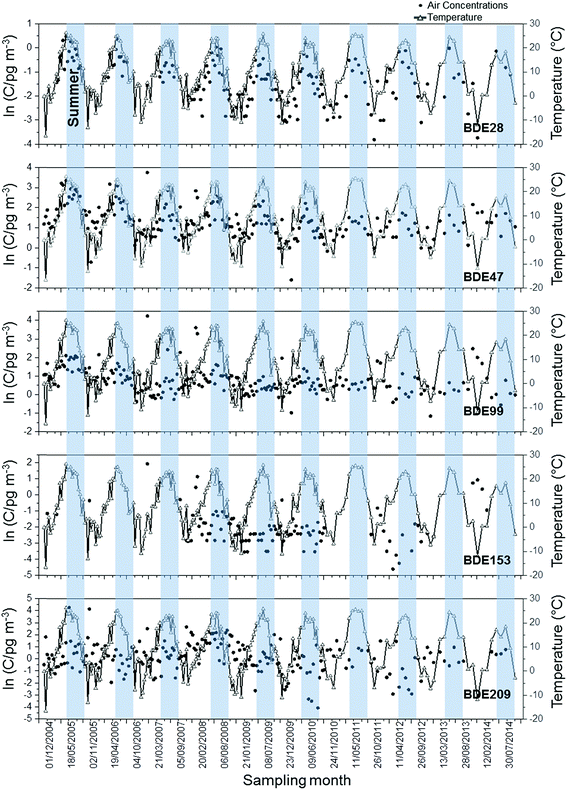 | ||
| Fig. 5 Seasonal profiles of air concentrations of PBDEs and ambient temperature at Point Petre. Blue shadings indicate the summer period (April to September). | ||
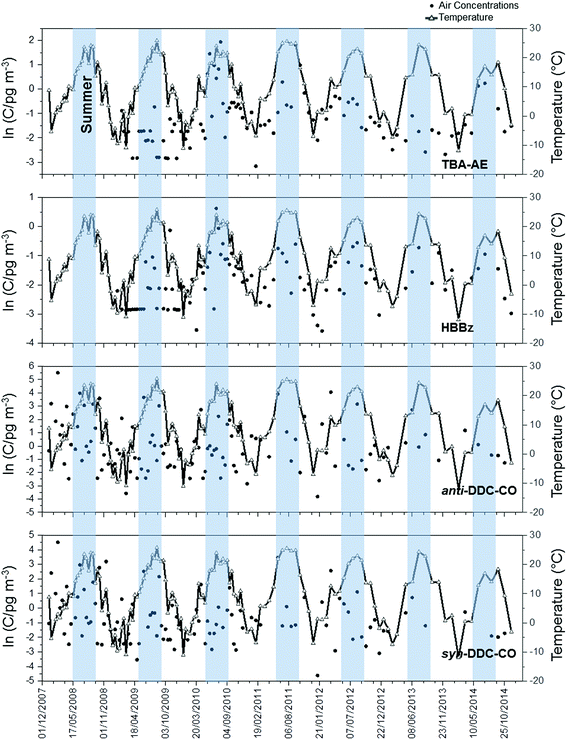 | ||
| Fig. 6 Seasonal profiles of air concentrations of non-PBDE HFRs and ambient temperature at Point Petre. Blue shadings indicate the summer period (April to September). | ||
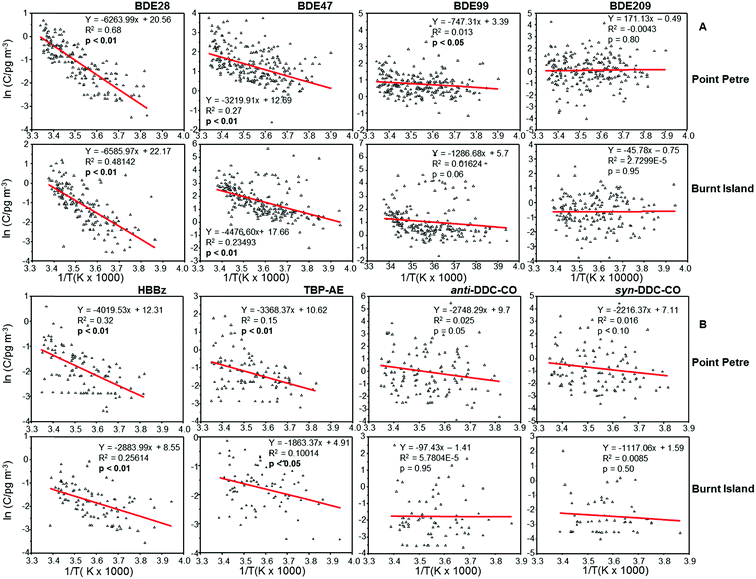
Correlation analysis was performed between the natural logarithm of concentrations (ln![[thin space (1/6-em)]](https://www.rsc.org/images/entities/char_2009.gif) C) and inverse temperature (1/T, K) to evaluate the influence of temperature on the atmospheric concentrations of PBDEs and non-PBDE HFRs (Fig. 7). The negative correlations between ln
C) and inverse temperature (1/T, K) to evaluate the influence of temperature on the atmospheric concentrations of PBDEs and non-PBDE HFRs (Fig. 7). The negative correlations between ln![[thin space (1/6-em)]](https://www.rsc.org/images/entities/char_2009.gif) C of BDE-28 and BDE-47 and 1/T (p < 0.05), together with steeper slopes at both sites, suggest that volatilization from local sources was influencing the atmospheric concentrations of these compounds at Point Petre and Burnt Island,51 while a weaker but statistically significant (p < 0.05) correlation between ln
C of BDE-28 and BDE-47 and 1/T (p < 0.05), together with steeper slopes at both sites, suggest that volatilization from local sources was influencing the atmospheric concentrations of these compounds at Point Petre and Burnt Island,51 while a weaker but statistically significant (p < 0.05) correlation between ln![[thin space (1/6-em)]](https://www.rsc.org/images/entities/char_2009.gif) C of BDE-99 and BDE-100 (not shown) and 1/T, together with much flatter slopes at Point Petre, suggests that LRAT likely controls the air concentrations of these compounds at this site.51 A similar result was also observed for BDE-100 at Burnt Island, but the influence of ambient temperature on the BDE-99 levels is not significant at the Burnt Island site. A weaker correlation was observed for non-PBDE HFRs such as TBP-AE and HBBz and the slopes were steeper at Point Petre than at Burnt Island, suggesting that volatilization emission was important for these compounds at Point Petre and atmospheric transport influences their concentrations at Burnt Island. The particle bound congeners (BDE-153, BDE-154 and BDE-209) and non-PBDE HFRs such as DDC-COs showed no temperature dependency.
C of BDE-99 and BDE-100 (not shown) and 1/T, together with much flatter slopes at Point Petre, suggests that LRAT likely controls the air concentrations of these compounds at this site.51 A similar result was also observed for BDE-100 at Burnt Island, but the influence of ambient temperature on the BDE-99 levels is not significant at the Burnt Island site. A weaker correlation was observed for non-PBDE HFRs such as TBP-AE and HBBz and the slopes were steeper at Point Petre than at Burnt Island, suggesting that volatilization emission was important for these compounds at Point Petre and atmospheric transport influences their concentrations at Burnt Island. The particle bound congeners (BDE-153, BDE-154 and BDE-209) and non-PBDE HFRs such as DDC-COs showed no temperature dependency.
Temporal trends of HFRs
Temporal trends of total air concentrations (gas plus particle phases) of PBDE congeners, non-PBDE HFRs (TBP-AE, HBBz, anti-DDC-CO, and syn-DDC-CO) and the gas phase concentrations of PBT at Point Petre and Burnt Island are assessed using data from 2005 to 2014 (Fig. 8, 9 and S4†). Trends of HFRs were not developed for Egbert due to insufficient data. Since data after 2008 are not available, recent trends cannot be determined at Egbert and the shorter trends are not directly comparable to those from Point Petre and Burnt Island. Thus, discussions will only focus on trends at the two master stations.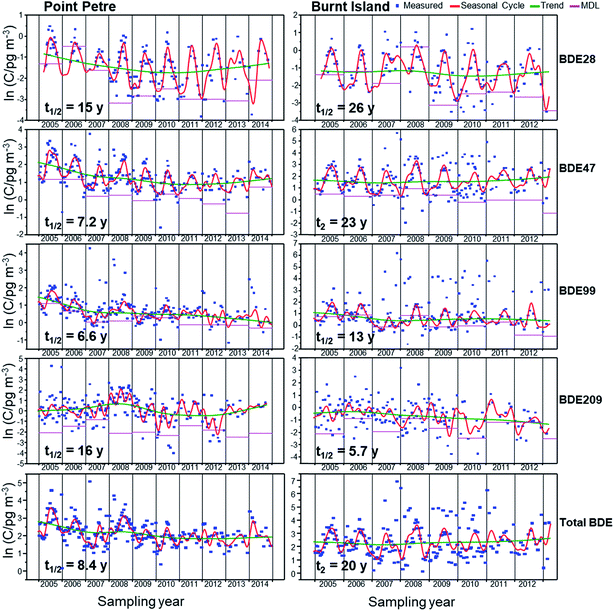 | ||
| Fig. 8 Seasonal cycles, trends and measurements of BDE-28, -47, -99, -209 and total PBDEs at Burnt Island and Point Petre. | ||
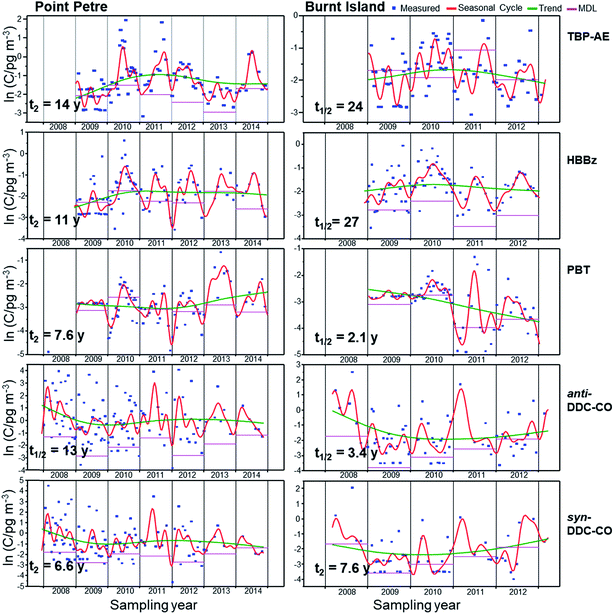 | ||
| Fig. 9 Seasonal cycles, trends and measurements of TBP-AE, HBBz, PBT, anti- and syn-DDC-CO at Burnt Island and Point Petre. | ||
The estimated half-lives (t1/2) and doubling times (t2) of PBDEs and non-PBDE HFRs are given in Table S7.† General declining trends with half-lives in the range of 2–16 years (Table S7†) are observed for the PBDE congeners. A slow declining trend for BDE-28 was observed at Point Petre, with a half-life of 15 years. The concentrations of BDE-28 and BDE-47 are not changing with time at Burnt Island (Fig. 8; Table S7†). BDE-100 and BDE-99 levels are slowly increasing (t2 = 17 years) and decreasing (t1/2 = 13 years), respectively, in Burnt Island. However, faster declining trends of BDE-47 (t1/2 = 7.2 years), BDE-99 (t1/2 = 6.6 years) and BDE-100 (t1/2 = 5.9 years) were observed at Point Petre (Fig. 8). Point Petre is closer to urban areas, probably reflecting the replacement of the BDE technical mixtures in cities like Toronto and Rochester. Temporal trends of PBDE concentrations in the atmosphere have been reported at the US IADN sites by Venier and Hites,15 Salamova and Hites,17 Ma et al.11 and Liu et al.19 Ma et al.11 reported that the air concentrations of BDE-47 are decreasing, with a half-life of 5–9 years at the urban sites, but are increasing, with doubling time ranging from 7 to 11 years at the rural sites. Liu et al.19 also determined similar trends for BDE-47 and BDE-99 at the urban sites. Also, they observed that the air concentrations of BDE-47 at three rural sites (Sturgeon Point, Sleeping Bear and Eagle Harbor) and BDE-99 at two rural sites (Sturgeon Point and Sleeping Bear) were unchanging, but the BDE-99 levels were increasing at the most remote site (Eagle Harbor), with a doubling time of 8 years. All these results suggest that there is a lag in time between the withdrawal of the technical BDE mixtures from the market and the influence of the withdrawal on remote sites11,52 since LRAT influences the air concentrations at remote sites. Urban areas are sources of PBDEs to the environment; thus air concentrations at urban sites will respond quicker to the withdrawal of the BDE technical mixtures from the market.
A fast decline of BDE-209 was observed at Burnt Island which is influenced more by LRAT. Since BDE-209 is mainly found on particles,4 it is preferentially removed from the atmosphere via deposition, thus making LRAT to remote sites such as Burnt Island difficult. The BDE-209 levels are decreasing slowly at Point Petre since there are still existing sources in urban areas. Even though Deca-BDE had been withdrawn from the market in 2013,10,11 products that are produced using Deca-BDE are still present in homes, school and offices and they are the main sources of BDE-209 to the environment. Our results are consistent with studies by Ma et al.,11 who reported a decreasing trend for BDE-209 with a half-life of 5 years at Cleveland and Sturgeon Point between 2005 and 2011. Liu et al.19 reported an increasing trend of BDE-209 at the urban site, but decreasing levels at the rural sites, with a half-life of 7–16 years between 2005 and 2013. ∑PBDEs showed a faster rate of decline at Point Petre with a half-life of 8.4 years (Fig. 8). However, a very slow increasing trend of ∑PBDEs was observed at Burnt Island. Venier and Hites15 and Salamova and Hites17 reported fast declines of ∑PBDEs, with a half-life of 3.4–4 years and 6.3 years at the U.S. IADN sites between 2005 and 2006, and 2005 and 2009, respectively. Liu et al.19 reported declining trends of ∑PBDEs at two urban sites and one remote site of Sturgeon Point, but the ∑PBDE concentrations did not change at the other two remote sites (Sleeping Bear Dunes and Eagle Harbor). However, Ma et al.11 observed that ∑PBDE concentrations were increasing at the rural sites of Eagle Harbor, Sleeping Bear Dunes and Sturgeon Point. Even though the Penta-BDE and Deca-BDE technical mixtures had been withdrawn from the market between 2005![[thin space (1/6-em)]](https://www.rsc.org/images/entities/char_2009.gif) 9 and 2013,10,11 they are still present in commercial products, which will continue to be sources of PBDEs to the environment. Thus, the atmospheric levels of the PBDEs will likely only change at a faster rate when the products manufactured using the BDE technical mixtures are permanently removed from the environment.
9 and 2013,10,11 they are still present in commercial products, which will continue to be sources of PBDEs to the environment. Thus, the atmospheric levels of the PBDEs will likely only change at a faster rate when the products manufactured using the BDE technical mixtures are permanently removed from the environment.
Non-PBDE HFRs
The temporal trends for non-PBDE HFRs are not as clear as those for PBDEs (Fig. 9). The absence of clear temporal effects suggests that there are continued inputs of non-PBDE HFRs into the environment. PBT concentrations are decreasing at Burnt Island, with a half-life of 2.1 years (although this could also be the result of higher MDLs in 2009 and 2010) but seem to be increasing at Point Petre, with a doubling time of 7.6 years (Fig. 9). HBBz also demonstrated a steep inclining trend between 2009 and 2011, but the incline has leveled off after 2009 at Point Petre, with a doubling time of 11 years (Fig. 9). The doubling time (t2 = 11 years) of HBBz is similar to the one reported by Liu et al.19 at Sturgeon Point between 2005 and 2013 (t2 = 10 years). TBP-AE concentrations at Point Petre are increasing slowly, with a doubling time of 14 years. The concentrations of HBBz and TBP-AE are not changing at Burnt Island. The concentrations of anti-DDC-CO in the atmosphere are decreasing, with a half-life of 3.4 years at Burnt Island and 14 years at Point Petre. The declines have leveled off for these compounds after 2010. syn-DDC-CO levels are decreasing, with a half-life of 6.6 years at the Point Petre, but the levels are increasing, with a doubling time of 7.6 years at the Burnt Island. Our results at Burnt Island are consistent with studies by Salamova and Hites,17 who reported an increasing trend for the syn-DDC-CO with a doubling time of 9.5 years at the US IADN sites. Liu et al.19 also observed that the total DDC-CO concentrations are increasing, with doubling times of 4–6 years at Chicago, Sleeping Bear Dunes and Eagle Harbor. For DBDPE, TBP-DBPE, HBCDD, PBEB, TBP-BAE, and EH-TBB, the data are too sparse to analyze the temporal trends of these compounds.Conclusions
In summary, the long-term air monitoring data (2005–2014) at the GLB demonstrate that the levels of PBDEs and some non-PBDE HFRs are decreasing in the atmosphere of the GLB. The large data sets provided an opportunity to study gas-particle partitioning over a wide range of temperatures. The data suggest that PBDEs are being removed from the environment slowly similar to PCBs and that the regulatory efforts to reduce emissions of BDE technical mixtures to the GLB environment have been effective but in-use products will continue to emit these chemicals to the atmosphere, resulting in a slow decline in air concentrations. Continuing measurements of the atmospheric concentrations of the PBDEs and the other FRs are needed to gain an understanding in the temporal trends of HFRs.Conflicts of interest
There are no conflicts to declare.Acknowledgements
Financial support of air monitoring in the Great Lakes Basin was provided by Environment and Climate Change Canada's Chemicals Management Plan (CMP). We acknowledge all site and laboratory operators, and students (Daniel Rickert and Edmund Luk) for collecting, extracting and analyzing the air samples.References
- C. A. de Wit, Chemosphere, 2002, 46, 583–624 CrossRef CAS PubMed.
- A. Covaci, S. Harrad, M. A.-E. Abdallah, N. Ali and R. J. Law, Environ. Int., 2011, 37, 532–556 CrossRef CAS PubMed.
- M. G. Ikonomou, S. Rayne and R. F. Addison, Environ. Sci. Technol., 2002, 36, 1886–1892 CrossRef CAS PubMed.
- F. Wania and C. B. Dugani, Environ. Toxicol. Chem., 2003, 22, 1252–1261 CrossRef CAS PubMed.
- Y. Su, H. Hung, E. Sverko, P. Fellin and H. Li, Atmos. Environ., 2007, 41, 8725–8735 CrossRef CAS.
- K. Betts, Environ. Sci. Technol., 2008, 42, 6778 CrossRef CAS PubMed.
- C. A. de Wit, M. Alaee and D. C. G. Muri, Chemosphere, 2006, 64, 209–233 CrossRef CAS PubMed.
- R. Renner, Environ. Sci. Technol., 2004, 38, 14A Search PubMed.
- C. A. de Wit, D. Herzke and K. Vorkamp, Sci. Total Environ., 2010, 408, 2885–2918 CrossRef CAS PubMed.
- M. L. Gentes, R. J. Letcher, E. Caron-Beaudoin and J. Verreault, Environ. Sci. Technol., 2012, 46, 9735–9744 CrossRef CAS PubMed.
- Y. Ma, A. Salamova, M. Vernier and R. A. Hites, Environ. Sci. Technol., 2013, 47, 11457–11464 CrossRef CAS PubMed.
- P. Guerra, K. Fernie, B. Jimenez, G. Pacepavicius, L. Shen, E. J. Reiner, E. Eljarrat, D. Barcelo and M. Alaee, Environ. Sci. Technol., 2011, 45, 1284–1290 CrossRef CAS PubMed.
- L. Shen, E. J. Reiner, K. A. Macpherson, T. M. Kolic, E. Sverko, P. A. Helm, S. P. Bhavsar, I. D. Brindle and C. H. Marvin, Environ. Sci. Technol., 2010, 44, 760–766 CrossRef CAS PubMed.
- E. Hoh, L. Zhu and R. A. Hites, Environ. Sci. Technol., 2006, 40, 1184–1189 CrossRef CAS PubMed.
- M. Vernier and R. A. Hites, Environ. Sci. Technol., 2008, 42, 4745–4751 CrossRef.
- A. Salamova and R. A. Hites, Environ. Sci. Technol., 2011, 45, 9924–9930 CrossRef CAS PubMed.
- A. Salamova and R. A. Hites, Environ. Sci. Technol., 2011, 45, 8698–8706 CrossRef CAS PubMed.
- Y. Ma, M. Vernier and R. A. Hites, Environ. Sci. Technol., 2012, 46, 13112–13117 CrossRef CAS PubMed.
- L.-A. Liu, A. Salamova, M. Vernier and R. A. Hites, Environ. Int., 2016, 92–93, 442–449 CrossRef CAS PubMed.
- R. Wu, S. Backus, I. Basu, P. Blanchard, K. Brice, H. Dryfhout-Clark, P. Fowlie, M. Hulting and R. A. Hites, J. Environ. Monit., 2009, 11, 277–296 RSC.
- N. Alexandrou, M. Smith, R. Park, K. Lumb and K. Brice, Int. J. Environ. Anal. Chem., 2001, 81, 257–280 CrossRef CAS.
- W. B. Sukloff, S. Allan and K. Ward, RDMQ User Manual, Environment Canada, Toronto, ON, 1995 Search PubMed.
- T. Nakazawa, M. Ishizawa, K. Higuchi and N. B. A. Trivett, Environmetrics, 1997, 8, 197–218 CrossRef CAS.
- V. Venier, H. Hung, W. Tych and R. A. Hites, Environ. Sci. Technol., 2012, 46, 3928–3934 CrossRef PubMed.
- H. Hung, K. Kallenborn, K. Breivik, Y. Su, E. Brorström-Lundén, K. Olafsdottir, J. M. Thorlacius, S. Leppänen, R. Bossi, H. Skov and S. Manø, Sci. Total Environ., 2010, 408, 2854–2873 CrossRef CAS PubMed.
- M. J. Guardia, R. C. Hale and E. Harvey, Environ. Sci. Technol., 2006, 40, 6247–6254 CrossRef.
- Free map tools, 2015, Find population on map, http://www.freemaptools.com/find-population.htm.
- Y. Yu, H. Hung, N. Alexandrou, P. Roach and K. Nordin, Environ. Sci. Technol., 2015, 49, 8623–8630 CrossRef CAS PubMed.
- A. Möller, Z. Xie, R. Sturm and R. Ebinghaus, Environ. Pollut., 2011, 159, 1577–1583 CrossRef PubMed.
- A. Möller, Z. Xie, M. Cai, G. Zhong, P. Huang, M. Cai, R. Sturm, J. He and R. Ebinghaus, Environ. Sci. Technol., 2011, 45, 6793–6799 CrossRef PubMed.
- H. Xiao, L. Shen, Y. Su, E. Barresi, M. DeJong, H. Hung, Y.-D. Lei, F. Wani, E. J. Reiner, E. Sverko and S.-C. Kang, Environ. Pollut., 2012, 161, 154–161 CrossRef CAS PubMed.
- Y. Li, D. Geng, F. L. T. Wang, P. Wang, Q. Zhang and G. Jiang, Atmos. Environ., 2012, 51, 140–145 CrossRef CAS.
- A. Salamova, M. H. Hermanson and R. A. Hites, Environ. Sci. Technol., 2014, 48, 6133–6140 CrossRef CAS PubMed.
- Z. Xie, A. Möller, L. Ahrens, R. Sturm and R. Ebinghaus, Environ. Sci. Technol., 2011, 45, 1820–1826 CrossRef CAS PubMed.
- A. Möller, Z. Xie, A. Caba, R. Sturm and R. Ebinghaus, Atmos. Environ., 2012, 46, 346–353 CrossRef.
- A. Möller, Z. Xie, M. Cai, R. Sturm and R. Ebinghaus, Environ. Sci. Technol., 2012, 46, 3141–3148 CrossRef PubMed.
- J. Li, Q. Li, R. Gioia, Y. Zhang, G. Zhang, X. Li, B. Spiro, R. S. Bhatia and K. C. Jones, Atmos. Environ., 2011, 45, 6622–6628 CrossRef CAS.
- B. Gevao, A. N. Ghadban, M. Porcelli, L. Ali, A. Rashdan, M. Al-Bahloul, K. Matrouk and J. Zafar, Sci. Total Environ., 2013, 454–455, 534–541 CrossRef CAS PubMed.
- M. Yang, H. Qi, H.-L. Jia, N.-Q. Ren, Y.-S. Ding, W.-L. Ma, L.-Y. Liu, H. Hung, E. Sverko and Y.-F. Li, Environ. Sci. Technol., 2013, 47, 8978–8984 CrossRef CAS PubMed.
- C. Wang, W. Li, J. Chen, H. Wang, T. Li, G. Shen, H. Shen, Y. Huang, R. Wang, B. Wang, Y. Zhang, J. Tang, W. Liu, X. Wang and S. Tao, Environ. Pollut., 2012, 171, 234–240 CrossRef CAS PubMed.
- H. Cheng, G. Zhang, J. X. Jiang, X. Li, X. Liu, J. Li and Y. Zhao, Atmos. Environ., 2007, 41, 4734–4747 CrossRef CAS.
- Y. Xu, G. Zhang, J. Li, X. Liu and X. Li, Sci. Total Environ., 2011, 409, 4564–4571 CrossRef CAS PubMed.
- M. Tian, S.-J. Chen, J. Wang, X.-B. Zheng, X.-J. Luo and B.-X. Mai, Environ. Sci. Technol., 2011, 45, 8819–8825 CrossRef CAS PubMed.
- K. Arinaitwe, D. C. G. Muir, B. T. Kiremire, P. Fellin, H. Li and C. Teixeira, Environ. Sci. Technol., 2014, 48, 1458–1466 CrossRef CAS PubMed.
- A. Birgul, A. Katsoyiannis, R. Gioia, J. Grosse, E. Earnshaw, N. Ratola, K. C. Jones and A. J. Sweetman, Environ. Pollut., 2012, 169, 105–111 CrossRef CAS PubMed.
- G. Marriani, E. Canuti, J. Castro-Jimenez, E. H. Christoph, S. J. Eisenreich, G. Hanke, H. Skejo and G. Umlauf, Chemosphere, 2008, 73, S114–S121 CrossRef PubMed.
- V. H. Estellano, K. Pozo, T. Harner, S. Corsolini and S. Focardi, Atmos. Pollut. Res., 2012, 3, 88–94 CrossRef CAS.
- E. Iacovidou, M. Mandalaki and E. G. Stephano, Chemosphere, 2009, 77, 1161 CrossRef CAS PubMed.
- S. Newton, U. Sellstrom and C. A. de Wit, Environ. Sci. Technol., 2015, 49, 2912–2920 CrossRef CAS PubMed.
- A.-L. Egeback, U. Sellstrom and M. S. McLachlan, Chemosphere, 2012, 86, 264–269 CrossRef PubMed.
- F. Wania, J.-E. Haugen, Y. D. Lei and D. Mackay, Environ. Sci. Technol., 1998, 32, 1013–1021 CrossRef CAS.
- T. Gouin and F. Wania, Environ. Sci. Technol., 2007, 41, 5986–5992 CrossRef CAS PubMed.
Footnote |
| † Electronic supplementary information (ESI) available. See DOI: 10.1039/c7em00549k |
| This journal is © The Royal Society of Chemistry 2018 |

