Hybrid electrolytes with 3D bicontinuous ordered ceramic and polymer microchannels for all-solid-state batteries†‡
Stefanie
Zekoll§
a,
Cassian
Marriner-Edwards§
a,
A. K. Ola
Hekselman¶
a,
Jitti
Kasemchainan
a,
Christian
Kuss
a,
David E. J.
Armstrong
a,
Dongyu
Cai||
 b,
Robert J.
Wallace
c,
Felix H.
Richter**
a,
Job H. J.
Thijssen
 b and
Peter G.
Bruce
 *a
*a
aDepartment of Materials, University of Oxford, Parks Road, Oxford, OX1 3PH, UK. E-mail: peter.bruce@materials.ox.ac.uk
bSUPA School of Physics and Astronomy, The University of Edinburgh, Edinburgh, EH9 3FD, UK
cDepartment of Orthopaedics, The University of Edinburgh, Edinburgh, EH16 4SB, UK
First published on 6th December 2017
Abstract
Hybrid solid electrolytes, composed of 3D ordered bicontinuous conducting ceramic and insulating polymer microchannels are reported. The ceramic channels provide continuous, uninterrupted pathways, maintaining high ionic conductivity between the electrodes, while the polymer channels permit improvement of the mechanical properties from that of the ceramic alone, in particular mitigation of the ceramic brittleness. The conductivity of a ceramic electrolyte is usually limited by resistance at the grain boundaries, necessitating dense ceramics. The conductivity of the 3D ordered hybrid is reduced by only the volume fraction occupied by the ceramic, demonstrating that the ceramic channels can be sintered to high density similar to a dense ceramic disk. The hybrid electrolytes are demonstrated using the ceramic lithium ion conductor Li1.4Al0.4Ge1.6(PO4)3 (LAGP). Structured LAGP 3D scaffolds with empty channels were prepared by negative replication of a 3D printed polymer template. Filling the empty channels with non-conducting polypropylene (PP) or epoxy polymer (epoxy) creates the structured hybrid electrolytes with 3D bicontinuous ceramic and polymer microchannels. Printed templating permits precise control of the ceramic to polymer ratio and the microarchitecture; as demonstrated by the formation of cubic, gyroidal, diamond and spinodal (bijel) structures. The electrical and mechanical properties depend on the microarchitecture, the gyroid filled with epoxy giving the best combination of conductivity and mechanical properties. An ionic conductivity of 1.6 × 10⁻⁴ S cm−1 at room temperature was obtained, reduced from the conductivity of a sintered LAGP pellet only by the volume fraction occupied by the ceramic. The mechanical properties of the gyroid LAGP–epoxy electrolyte demonstrate up to 28% higher compressive failure strain and up to five times the flexural failure strain of a LAGP pellet before rupture. Notably, this demonstrates that ordered ceramic and polymer hybrid electrolytes can have superior mechanical properties without significantly compromising ionic conductivity, which addresses one of the key challenges for all-solid-state batteries.
Broader contextThere are many challenges on the road to an all-solid-state battery with a lithium metal anode. One such challenge is identifying a solid electrolyte that has sufficient ionic conductivity without being too soft or too brittle. Polymer electrolytes suffer from the former and ceramics from the latter problem. Composites formed of ceramic and polymer electrolytes introduce multiple interfaces between the two phases that often impede ions crossing the interfaces. We present a hybrid solid electrolyte, composed of 3D ordered bicontinuous ceramic and polymer microchannels, generated by 3D printing. The ceramic endows the hybrid with high ionic conductivity at room temperature due to continuous pathways for ions through the ceramic phase, whereas the polymer mitigates the brittleness of the ceramic, rendering the hybrid electrolyte more resilient to fracture. The conductivity of the hybrid is reduced by only the volume fraction of space that the non-conducting polymer occupies, demonstrating a well-sintered ceramic phase. The microarchitecture with gyroidal channels exhibits the best properties, sustaining longer cycling in contact with lithium metal electrodes than a dense ceramic disk. The hybrid solid electrolyte decouples conductivity from mechanical properties, which may offer a way forward in the quest for an all-solid-state battery. |
Introduction
Despite the success of today's lithium-ion batteries, advances in the technology are necessary to meet the needs of future markets.1,2 One of the major requirements is the replacement of the liquid electrolyte with a solid electrolyte; a statement that is easy to make but hard to realise in practice. The advantages of a solid electrolyte compared with an organic-based liquid are safety (since the latter is flammable), the possibility of increased energy density (if a solid electrolyte can enable the use of a lithium metal anode), and potentially improved cycling, calendar life and rate performance.3 However, the problems faced by all-solid-state cells are considerable and are well described in recent reviews.4–7 One of the greatest barriers to this technology is the problem of developing a solid electrolyte that combines high conductivity with suitable mechanical properties.8–10Two major classes of solid electrolyte are being considered, ceramic and polymer electrolytes. The latter exhibit the typical properties of polymers, i.e. softness and elasticity allowing it to accommodate volume changes/stresses on cycling without breaking and maintain contact with the electrodes, but despite efforts their conductivity has remained too low (at <10−4 S cm−1); the softness also permits lithium dendrite propagation. Ceramic electrolytes have seen major advances in conductivity, with the sulphides, in particular, achieving conductivities comparable to liquids and perhaps greater than them below ambient.11 However, ceramics exhibit typical mechanical properties that make maintaining fracture free membranes that retain contact with the electrode a challenge. In short, the transition to solid electrolytes introduces the problem of mechanical properties and each class of solid electrolyte presents its own, largely complementary advantages and disadvantages.
In recognition of this complementarity, efforts have been made to combine ceramic and polymer electrolytes to form composite electrolytes, in the expectation that they would deliver the best of both worlds. It is known that adding ceramic fillers to polymer electrolytes12–15 can enhance conductivity, due to space charges at the ceramic/polymer electrolyte interface.16 Recent work on ceramic/polymer composite electrolytes has included the synthesis of electrospun nanofibers of an ionically conducting ceramic electrolyte imbedded in a polyethylene oxide-type polymer electrolyte matrix. This approach provides continuous, conductive ceramic channels across the membrane without interruption by the conductive polymer matrix.17 Alignment of the ceramic nanowires normal to the electrodes was shown to increase the overall conductivity more than randomly embedded particles, mainly due to alignment of the space charge enhanced conduction along the ceramic/polymer interface.18 Connected Li1−xAlxTi1−x(PO4)3 nanoparticles, vertically aligned by ice templating in a polymer electrolyte matrix also showed enhanced conductivity.19 One-particle thick flexible hybrid membranes composed of Li1.6Al0.5Ti0.95Ta0.5(PO4)3 (LATTP) particles embedded in a cyclo olefin polymer matrix have also been reported.20
Here we investigate a different approach which gives full control of the ceramic–polymer ratio and 3D structure. We use 3D printing to form structured hybrid electrolytes comprising 3D ordered bicontinuous, interlocking channels: one filled with a ceramic electrolyte, ensuring continuous channels for ion transport across the electrolyte, the other filled with an electrically insulating polymer, to tune the mechanical properties. 3D conducting channels are more resilient to the effects of cracking than 1D channels such as nanowires. A break in the latter renders that channel non-conductive, whereas 3D channel connectivity maximises the probability of alternative routes for the current around the break.
As many materials cannot currently be processed directly into 3D bicontinuous microarchitectures by means of printing or lithographic processes, 3D printed polymer frameworks as structure-directing supports and sacrificial templates are utilised here.21–23 Until recently, choice of templates was limited, and synthetic opals were often used as templates to create structured scaffolds of solid electrolytes24 and electrodes.25,26 Now, the advent of 3D printing and stereolithography permits, in principle, the controlled design and formation of a diverse range of precise microarchitectures.27–29 Even though the presented approach is not scalable with current printing technology, its power lies in the ability to precisely control the geometry and size in order to identify the optimised structure, which may subsequently be synthesized by more scalable methods. Our approach promises to be applicable generally to other solid electrolytes, most of which cannot be handled in air. In comparison, LAGP is only moderately air sensitive, which facilitates the investigation of new design concepts such as the one presented here, and was, therefore, chosen for this study.
In the following, we present the process by which we form 3D bicontinuous structured hybrid electrolytes with the ceramic solid electrolyte LAGP in one channel and an insulating polymer in the other. The properties of these structured hybrid electrolytes are investigated by electrochemical impedance spectroscopy, galvanostatic cycling and mechanical testing. Notably, their performance depends on the microarchitecture (cube, gyroid, diamond, bijel-derived) and the type of polymer (epoxy polymer, polypropylene). Our results reveal that the gyroid LAGP–epoxy electrolyte supports an ionic conductivity (1.6 × 10⁻⁴ S cm−1) on the same order of magnitude as an LAGP pellet, but has superior mechanical properties, e.g. achieves up to five times the flexural failure strain of an LAGP pellet before rupture.
Results and discussion
Synthesis of structured hybrid electrolytes
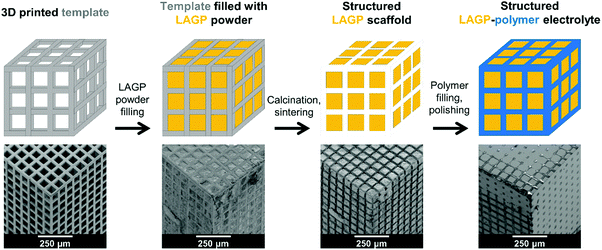
A schematic overview of the synthesis sequence used to create structured hybrid electrolytes with 3D bicontinuous microarchitectures is exemplified in Fig. 1 by the cube design. The schematic is accompanied by a series of scanning electron microscopy (SEM) images depicting each synthesis stage for the cube LAGP–epoxy electrolyte. Computationally designed microarchitectures are used to fabricate the corresponding 3D printed polymer templates by stereolithography. Then, the empty channels of the templates are filled with LAGP powder. Calcination in air removes the template by combustion and sinters the LAGP phase, forming the structured LAGP scaffold. Finally, the empty channels created by combustion of the template are filled with an insulating polymer, thus creating the structured hybrid electrolytes with designed 3D bicontinuous ceramic and polymer microchannels.Design and stereolithography of 3D printed templates
Four microarchitectures were investigated in this way: a cube, gyroid, diamond and bijel-derived microarchitecture. The cube microarchitecture is one of the geometrically simplest conceivable 3D bicontinuous structures. The orthogonality of conduction channels, however, leads to an inefficient use of part of the LAGP phase. Finite element modelling has shown that higher overall conductivity can be expected from gyroid and diamond microarchitectures due to a decrease in the tortuosity factor from 1.6 in the cube microarchitecture to 1.2 in gyroid and diamond microarchitectures when assuming a solid electrolyte volume fraction of 70% (S1, ESI†).To compare these ordered microarchitectures with a random channel arrangement, a bijel-derived microarchitecture was also included in this study. As detailed in S2 (ESI†), bijels are prepared by spinodal liquid–liquid demixing in the presence of neutrally wetting colloidal particles, which sequester at the liquid–liquid interface and halt further phase separation upon interfacial jamming.30 After monomer infusion and polymerization of one of the liquid channels, followed by draining off both liquids,31 they can, in principle, be used directly as 3D templates. However, in order to remain consistent, all templates used in this study were created by stereolithography. The bijel-derived microarchitecture was based on an X-ray computed tomography (CT) scan of a polymerized bijel, whereas the three designs are generated solely computationally as detailed in S3 (ESI†).
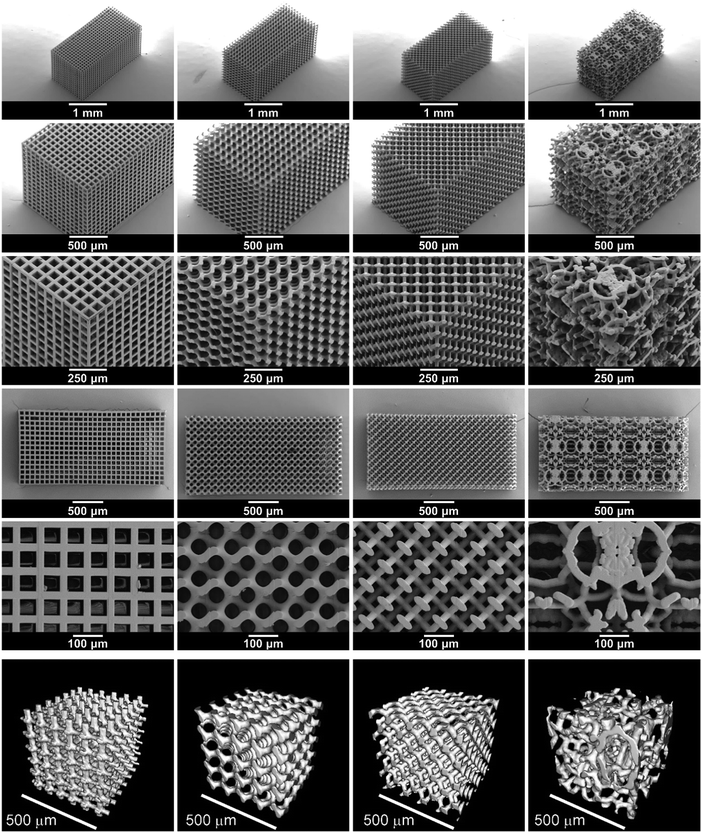
IP-S photoresist was used in stereolithography of the four template microarchitectures. Fig. 2 shows SEM images of the 3D printed templates and renderings of micro-CT scans of their microarchitectures. The overall dimension of the printed templates is approximately 1.2 mm × 1.2 mm × 2.4 mm, which is about 5% smaller than the computational design, probably due to shrinkage occurring during template printing and development. The 3D printed templates are made from a repeated arrangement of cubic print blocks containing a specific number of structural units that are designed to have the desired structural parameters. The overall size of the samples may easily be changed, e.g. a template size of 3.0 mm × 3.0 mm × 1.1 mm is used for electrochemical tests and 14.8 mm × 3.0 mm × 0.6 mm is used for four-point bending tests.
The properties of the structured hybrid electrolytes relate directly to their microarchitecture and the sizes of the 3D bicontinuous polymer and ceramic channels. Hence, the 3D printed templates are designed with about 15% solid volume fraction (i.e. 85% porosity) so that the final structured hybrids consist mostly of ion-conducting ceramic, retaining good ionic conductivity through the structured hybrid electrolytes. The average empty channel diameter of the four template microarchitectures is designed to be 67 μm. Together, these values define the average wall thickness (diameter of the printed polymer channel) of each microarchitecture: approximately 20 μm (Table 1). Ultimately, these feature sizes are too large, as one would hope to create solid electrolyte films of about 10 μm in thickness with a submicron feature size. Here, we demonstrate the concept and feasibility of the presented structured hybrid electrolytes. Further studies will explore ways of reducing channel size and film thickness.
| Cube | Gyroid | Diamond | Bijel | ||
|---|---|---|---|---|---|
| a An extended version of this table is shown in S6 (ESI). | |||||
| 3D printed template | Volume shrinkage during printing / % | 0 | 2 | 6 | 2 |
| Template LAGP filled | Volume expansion during filling / % | 16 | 16 | 13 | 24 |
| Structured LAGP scaffold | Volume shrinkage during sintering / % | 44 | 40 | 35 | 40 |
| Structured LAGP scaffold | Overall volume shrinkage / % | 34 | 32 | 31 | 28 |
| Template design | Solid volume fraction / % | 15.6 | 15.6 | 15.4 | 15.6 |
| Structured LAGP scaffold | Solid volume fraction / % | 71.4 | 72.6 | 72.5 | 78.2 |
| Template design | Average empty channel diameter / μm | 66.1 | 66.4 | 67.8 | 69.0 |
| Structured LAGP scaffold | Average LAGP thickness / μm | 44.2 | 44.0 | 42.0 | 59.5 |
| Template design | Average wall thickness / μm | 15.1 | 20.4 | 19.9 | 22.5 |
| Structured LAGP scaffold | Average empty channel diameter / μm | 20.4 | 20.8 | 18.4 | 22.3 |
| Structured LAGP scaffold | Weight / mg | 5.54 | 6.60 | 5.90 | 5.94 |
| Structured LAGP scaffold | Volume / mm3 | 2.27 | 2.78 | 2.59 | 2.50 |
| Structured LAGP scaffold | Density / mg mm−3 | 2.44 | 2.37 | 2.28 | 2.38 |
Synthesis of structured LAGP scaffolds
Creating the negative replicas of the 3D printed templates poses a significant synthesis challenge to correctly capture the open 3D bicontinuous microarchitecture, with channels tens of micrometres in size, as well as the overall rectangular solid shape on the millimetre scale. For a successful negative replication in order to obtain good ionic conductivity, achieving a high degree of filling of the 3D printed template channels with the desired material is essential. The required level of filling cannot be achieved simply by using a precursor solution to form the ceramic by a sol or sol–gel route. The volume of the solid residue would be much less than its precursor solution, leading to a very low filling fraction of the channels. To increase the filling of the 3D printed template, we developed a methodology that involves filling the channels with calcined LAGP powder with a particle size <5 μm (S4, ESI†), which is substantially smaller than the empty channels in the 3D printed templates, which are on average 67 μm in size.LAGP powder is prepared with the Pechini method, which is a sol–gel process involving a chelating polymer that is effective in distributing the ions on the atomic scale.32 The obtained LAGP powder is ball milled to reduce particle size, dispersed in methanol and then inserted into the template channels by repeated centrifugation and sonication. This procedure helps to avoid blocking of the channels with LAGP powder during filling and increases the speed of sedimentation and compaction of LAGP. SEM images demonstrate that the 3D printed templates are filled with LAGP powder (S5, ESI†). Note that other dispersants such as ethanol or water were much less effective than methanol (S5, ESI†). Heating in air combusts the template and sinters the LAGP powder to form a LAGP scaffold with 3D interconnected microarchitecture (Fig. 3). Comparing the SEM images in Fig. 2 and 3 indicates that the LAGP scaffold is successfully formed for all four template designs. To confirm that our process results in an LAGP scaffold that is an accurate negative replica of the respective template, we also show X-ray micro-CT renderings of the inner parts of the templates and scaffolds in Fig. 2 and 3, respectively.
To quantify the quality of the various synthesis steps, Table 1 compares structural parameters of the template designs, the 3D printed templates, the 3D printed templates filled with LAGP and the structured LAGP scaffolds. An extended list of structural parameters is given in S6 (ESI†). The overall sample volume decreases by 28–34% from template design to ceramic scaffold. This includes <6% shrinkage during 3D printing, an initial volume increase by 13–24% during filling of the 3D printed template and a subsequent decrease by 35–44% during template combustion and ceramic sintering. The 3D printed templates are designed to have similar solid volume fraction and porosity. As the structured LAGP scaffold has an empty channel system created by the template, the porosity, LAGP thickness and empty channel size of the structured scaffold are determined by the solid volume fraction, empty channel size and wall thickness of the 3D printed template. The corresponding thickness and channel size distributions of the bijel-derived microarchitecture are broader than of the cube, gyroid and diamond microarchitectures (S7, ESI†). This is to be expected as the bijel-derived microarchitecture was taken from a micro-CT scan of an actual bijel sample after polymerization. As bijels are formed by halting liquid–liquid phase separation, some variance in geometric properties is to be expected.30,31
Polymer filling of structured LAGP scaffolds
Polymer filling of the channels of the structured LAGP scaffolds is achieved either by impregnating with a melt of polypropylene (PP) or by impregnating with liquid epoxy resin followed by polymerization within the channels. Immersion of the LAGP scaffold into the melt or resin under dynamic vacuum provides a complete impregnation of the empty channels. Cooling of the melt and polymerization of the resin, respectively, lead to solidification of polypropylene and epoxy polymer inside the channels of the ceramic scaffold.Characterisation of the 3D structured hybrid electrolytes
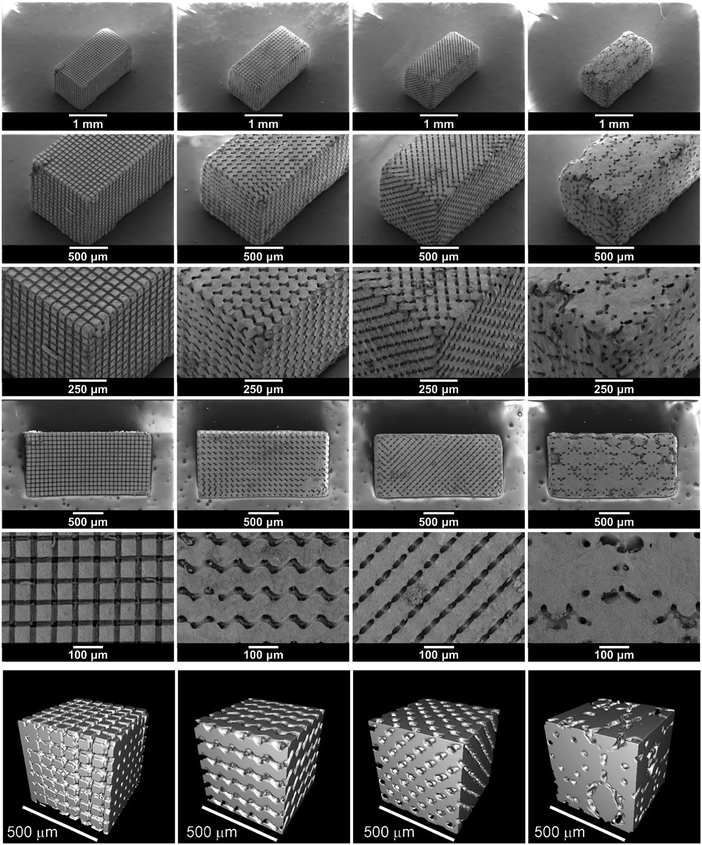
The SEM images in Fig. 4 show the structured LAGP–epoxy electrolytes after removal of excess polymer on the surface by polishing the samples. SEM images of polished structured LAGP–PP electrolytes are shown in S8 (ESI†). Energy dispersive X-ray spectroscopy (EDX) mapping of the polished surfaces proves the presence of two distinct and well separated LAGP and polymer phases, as exemplified for LAGP–PP in Fig. 5. The polymer phase is rich in carbon, while the elements germanium, aluminium, oxygen and phosphorus are detected in the LAGP phase.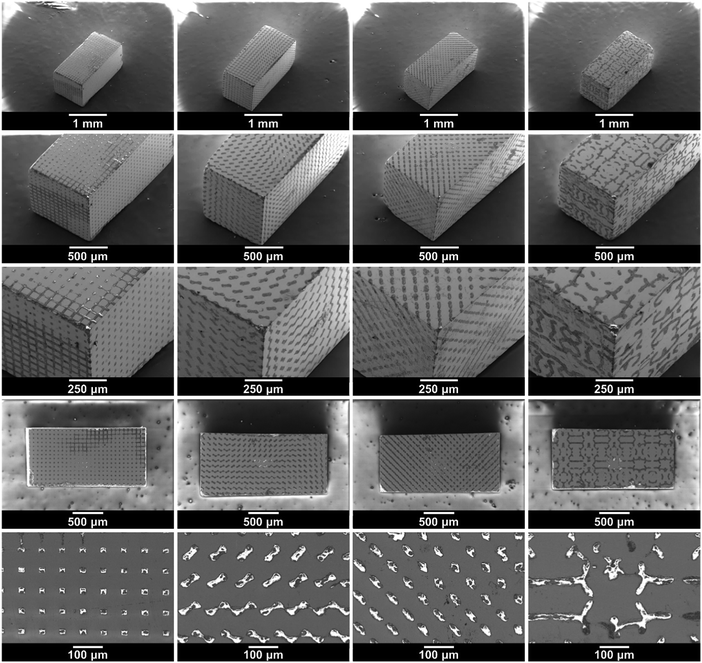 | ||
| Fig. 4 SEM images of the structured LAGP–epoxy electrolytes with cube, gyroid, diamond and bijel-derived (left to right) microarchitectures. SEM images of the corresponding structured LAGP–PP electrolytes are shown in S8 (ESI†). | ||
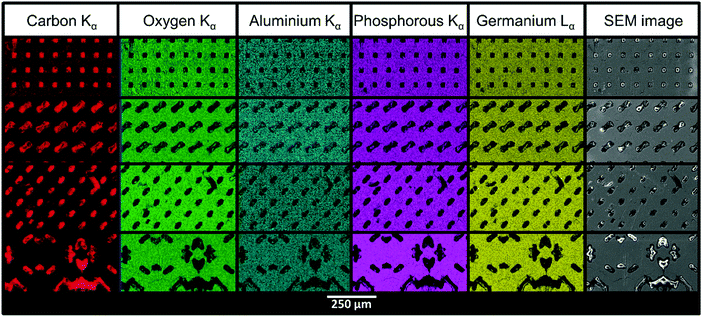 | ||
| Fig. 5 SEM images and EDX mapping of structured LAGP–PP electrolytes with cube, gyroid, diamond and bijel-derived microarchitectures (top to bottom). | ||
The formation of LAGP at different stages of the synthesis process is confirmed by X-ray diffraction shown in S9 (ESI†) and matches with the known pattern of LAGP.33 The LAGP phase is successfully synthesised via the Pechini method after calcination of the precursor gel at 800 °C. Both composition and crystal structure of LAGP remain intact after wet ball milling and further sintering of the LAGP powder at 900 °C as a pellet and as a structured scaffold. The pellet of LAGP was formed by pressing the powder after ball milling and then sintering at 900 °C for 5 hours. The density of the LAGP pellet was found to be 3.1 mg mm−3, i.e. approximately 90% of the theoretical density. The overall density of the structured LAGP scaffolds (including empty channels in the volume) was found to be about 2.3 mg mm−3, i.e. approximately 75% of the LAGP pellet. Hence, the LAGP phase density is similar in pellet and hybrid. The significance is that achieving densification within the volume of the ceramic is important, as otherwise, the conductivity would be exceedingly reduced. In short, to achieve conductivity that is reduced only by the volume fraction of non-conducting material constitutes an important result.
Electrochemical characterization
Electrochemical impedance spectroscopy (EIS) was performed on both LAGP pellet and structured hybrid electrolytes using gold (Au) blocking electrodes. For clarity, the comparison of LAGP pellet and structured hybrid electrolytes is exemplified by the gyroid hybrid electrolyte in Fig. 6. The cell setup is shown in Fig. 6a. The Nyquist plots recorded at ambient temperature and corresponding equivalent circuit are shown in Fig. 6b. At room temperature, both LAGP pellet and gyroid hybrid electrolytes display a partially visible semicircle in the high-frequency range followed by a spike at lower frequencies. Both pellet and structured hybrid electrolyte were best fitted with an equivalent circuit consisting of a series of a resistor (R1), as the partially visible semicircle does not extrapolate to the origin, a resistor in parallel with a constant-phase element (R2//CPE2), representing the partially visible semicircle, and a constant-phase element (CPE3), representing the spike. Constant-phase elements (CPE) were used in all fittings to account for the slightly suppressed semicircles and resulting non-ideal capacitance.34 Details of the fitting can be found in S10 (ESI†).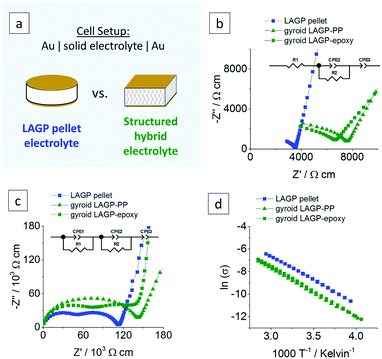 | ||
| Fig. 6 Electrochemical impedance analyses of a LAGP pellet, a gyroid LAGP–PP and a gyroid LAGP–epoxy electrolyte using symmetric gold electrodes: (a) Schematic of the cell setup, the corresponding Nyquist plots and equivalent circuit (b) at room temperature and (c) at −30 °C and (d) the Arrhenius plot in the range of −20 °C to 75 °C. A more detailed analysis is shown in S10 (ESI†). | ||
The impedance data for both systems was also recorded at a temperature of −30 °C in order to observe more of the high-frequency impedance. The Nyquist plots at −30 °C (Fig. 6c) reveal two distinct semicircles for both pellet and structured hybrid electrolytes. They were fitted by a series of two parallel combinations of a resistor and a constant-phase element (R1//CPE1 and R2//CPE2), attributed to the overlapping semicircles in the Nyquist plots, and a constant-phase element (CPE3), attributed to the blocking interfaces between the Au electrodes and the electrolyte. Capacitance values for R1//CPE1 and R2//CPE2 in the order of 10−11 F cm−1 and 10−10 F cm−1 were calculated, respectively. Details on the calculation of the effective capacitance values can be found in S10 (ESI†). Both values are within the previously reported range of intragrain (bulk) and intergrain (grain boundary) contributions for LAGP, respectively.35–37 Hence, the two semicircles in Fig. 6c are attributed to the intragrain and intergrain Li-ion transport in the LAGP phase of both LAGP pellet and structured LAGP–polymer electrolytes.
A total ionic conductivity of 2.8 × 10⁻⁴ S cm−1 for the LAGP pellet and 1.3 × 10⁻⁴ S cm−1 and 1.6 × 10⁻⁴ S cm−1 for the gyroid LAGP–PP and gyroid LAGP–epoxy electrolytes, respectively, are obtained at ambient temperature. These conductivities were extracted by considering the Au electrode area in contact with the sample and the thickness of the sample. In fact, the volume fraction of non-conducting polymer phase in the structured LAGP–polymer electrolytes as well as the tortuosity of these structured hybrid electrolytes, influence the pathway of Li-ions across the LAGP phase. A geometry factor of 0.58 was calculated by finite element modelling which takes into account the geometry and LAGP volume fraction of 70% of the gyroid hybrid electrolytes. Further details on the modelling can be found in S1 (ESI†). Accordingly, the total ionic conductivities normalised to the volume of LAGP in the gyroid LAGP–PP and gyroid LAGP–epoxy electrolytes are 2.3 × 10⁻⁴ S cm−1 and 2.7 × 10⁻⁴ S cm−1, respectively. Both corrected values are in agreement with the total ionic conductivity achieved within a pellet and confirms that the LAGP filling of the structured hybrid electrolytes is sintered as well as the LAGP pellet.
Fig. 6d shows the Arrhenius plots of the conductivities of both pellet and structured hybrid electrolytes over a temperature range of −20 °C to 75 °C. A similar temperature dependency is observed for both pellet and structured hybrid electrolytes. Activation energies of 35.5 kJ mol−1, 36.3 kJ mol−1 and 36.7 kJ mol−1 were determined from the slope of the Arrhenius plots for LAGP pellet, gyroid LAGP–PP and gyroid LAGP–epoxy electrolytes, respectively, and are in agreement with previous reports on LAGP.33
EIS was also performed on symmetric cells assembled with lithium metal electrodes of both pellet and structured hybrid electrolytes. The cell setup and the equivalent circuit used are illustrated in Fig. 7. We anticipate parallel RC elements corresponding to the intragrain, intergrain, interphase layer (formed upon the reaction of LAGP with lithium, as reported by Janek and co-workers38) and the electrode/electrolyte interface. The Nyquist plots were best fitted using four parallel combinations of a resistance and a constant-phase element in series (R1//CPE1, R2//CPE2, R3//CPE3 and R4//CPE4). From the derived capacitance values in the range of 10−10 F cm−1, the first two elements were attributed to the intragrain (R1//CPE1) and intergrain (R2//CPE2) properties of the LAGP phase for both pellet and structured hybrid electrolytes. The third contribution (R3//CPE3), which was not present when using Au electrodes, has a capacitance in the range of 10−8 F cm−2. This is consistent with the formation of an interphase layer at the interface between the Li-metal electrode and the LAGP. The extent of the resistance of this initial interphase layer could be limited through a surface polishing step. Details of the procedure are given in the Experimental section. The capacitance value of the last contribution (R4//CPE4) in the equivalent circuit, the well resolved semicircle at the lowest frequencies in Fig. 7, of 10−3 F cm−2 for both pellet and structured hybrid electrolytes was attributed to the Li–LAGP interface, as it was also not present in the Au-electrode setup. The total ionic conductivities after Li-cell assembly for the LAGP pellet, gyroid LAGP–PP and gyroid LAGP–epoxy electrolytes are 2.9 × 10⁻⁴ S cm−1, 3.0 × 10⁻⁴ S cm−1 and 2.5 × 10⁻⁴ S cm−1, respectively, using the geometry factor of 0.58 from finite element modelling. These are in good agreement with the total ionic conductivities obtained above with symmetric Au electrode cells.
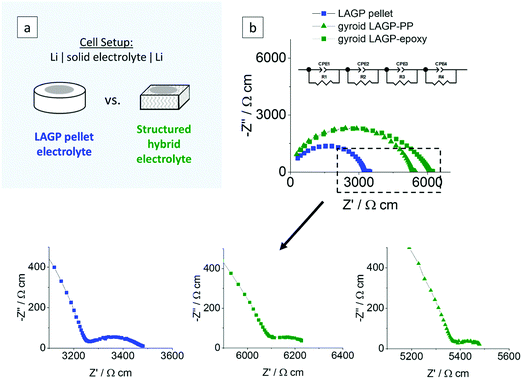 | ||
| Fig. 7 Electrochemical impedance analyses of a LAGP pellet, a gyroid LAGP–PP and a gyroid LAGP–epoxy electrolyte using symmetric lithium electrodes: (a) schematic of the cell setup and (b) the corresponding Nyquist plots and equivalent circuit at ambient temperature. A more detailed analysis is shown in S11 (ESI†). | ||
Symmetric lithium cells of the LAGP pellet and structured hybrid electrolytes were tested by galvanostatic cycling for 10 cycles at a constant current density of 1 mA cm−2 and capacity of 0.5 mA h cm−2 for each charge or discharge. Post-cycling cross-sectional SEM analysis of the LAGP–Li interface in the LAGP pellet revealed the formation of a 20 μm thick interphase layer across the entire electrode–electrolyte contact area. SEM images show that the layer has a different morphology to that of the original LAGP phase; distinct grains as seen in the LAGP phase are no longer observed (S12, ESI†). Our observations are consistent with the work reported previously by Janek and co-workers, who analysed the degradation reaction between LAGP and lithium, identifying an interphase layer.38 Over 10 cycles, the structured LAGP–epoxy electrolytes show better performance than the structured LAGP–PP electrolytes for all four microarchitectures (S13, ESI†). In addition, the gyroid hybrid electrolytes showed the lowest increase in cell voltage after 10 cycles for both the epoxy and PP filling. Hence, the results in the following section focus on the gyroid LAGP–epoxy electrolyte in comparison with the LAGP pellet.
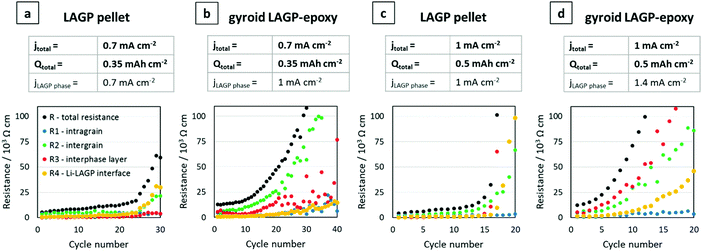
Galvanostatic cycling was performed on both gyroid LAGP–epoxy electrolytes and LAGP pellets at 0.7 mA cm−2 and 1 mA cm−2 electrode areal current densities (jtotal). Cycling of the LAGP pellet and the gyroid LAGP–epoxy electrolyte between lithium electrodes up to 30 cycles at a current density of 0.7 mA cm−2 up to a capacity of 0.35 mA h cm−2 are shown in Fig. 8a and b. The voltage polarisation increases equally for both gyroid LAGP–epoxy electrolyte and LAGP pellet up to 20 cycles, after which the polarisation of the LAGP pellet increases rapidly until the limiting voltage of 12 V was reached on both charge and discharge after 30 cycles. In contrast, the gyroid LAGP–epoxy electrolyte retains a gradual increase in voltage polarisation, only reaching the potentiostat limiting voltage after 40 cycles. Hence, despite the gyroid LAGP–epoxy electrolyte comprising 30% of insulating phase, it performs better than the LAGP pellet at this current density and capacity.
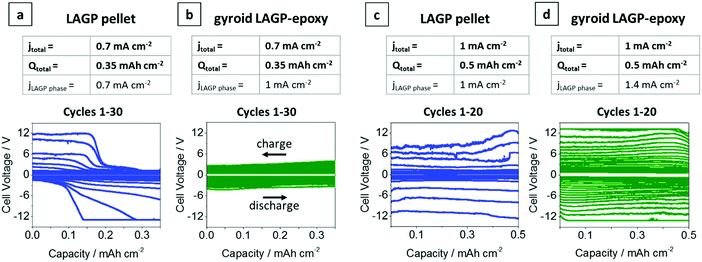 | ||
Fig. 8 Galvanostatic cycling of LAGP pellet and gyroid LAGP–epoxy electrolytes with lithium electrodes. (a) LAGP pellet and (b) gyroid LAGP–epoxy electrolytes cycled at a current density of 0.7 mA cm−2 (jtotal) for 0.5 h per charge and discharge step. (c) LAGP pellet and (d) gyroid LAGP–epoxy electrolyte cycled at a current density of 1 mA cm−2 (jtotal) for 0.5 h per charge and discharge step. The corresponding effective current density through the LAGP phase is indicated as jLAGP![[thin space (1/6-em)]](https://www.rsc.org/images/entities/char_2009.gif) phase. Detailed cycling parameters are shown in S14 (ESI†). phase. Detailed cycling parameters are shown in S14 (ESI†). | ||
At higher current density (1 mA cm−2) and capacity (0.5 mA h cm−2), both the LAGP pellet and the gyroid LAGP–epoxy electrolyte between lithium electrodes only withstand a maximum of 20 cycles before reaching the potentiostat limiting voltage (Fig. 8c and d). In the case of the pellet, the voltage polarisation initially increases slowly before increasing rapidly and erratically by over 1 V per cycle. In contrast, the polarisation increases more steadily and consistently throughout the 20 cycles for the gyroid LAGP–epoxy electrolyte. However, both reach the limiting voltage of the potentiostat after an equal number of cycles at 1 mA cm−2.
In our discussion so far, we have not taken into account the fractional area of the insulating polymer phase in contact with the lithium metal electrodes, which means that only about 70% of the lithium area is in contact with LAGP for the gyroid LAGP–epoxy electrolyte, whereas it is 100% for the LAGP pellet. Hence, the LAGP phase of the gyroid LAGP–epoxy electrolytes in Fig. 8b and d is subjected to a roughly 40% higher effective current density (jLAGP![[thin space (1/6-em)]](https://www.rsc.org/images/entities/char_2009.gif) phase) than that of the LAGP pellets in Fig. 8a and c, respectively. Notably, at equal effective current density through the LAGP phase of 1 mA cm−2, the cycling of the gyroid LAGP–epoxy electrolyte (Fig. 8b) is more stable than that of a pellet (Fig. 8c). While the gyroid LAGP–epoxy does not exceed a polarization of 2 V after 20 cycles, the LAGP pellet reaches a polarization of over 6 V. The same trend is observed at higher effective current density (1.4 mA cm−2), results of which are shown in S14 (ESI†).
phase) than that of the LAGP pellets in Fig. 8a and c, respectively. Notably, at equal effective current density through the LAGP phase of 1 mA cm−2, the cycling of the gyroid LAGP–epoxy electrolyte (Fig. 8b) is more stable than that of a pellet (Fig. 8c). While the gyroid LAGP–epoxy does not exceed a polarization of 2 V after 20 cycles, the LAGP pellet reaches a polarization of over 6 V. The same trend is observed at higher effective current density (1.4 mA cm−2), results of which are shown in S14 (ESI†).
Fig. 9 plots terminal voltage after each cycle versus cycle number of the symmetric lithium cells shown in Fig. 8 in direct comparison. Corresponding plots of total resistance after each cycle versus cycle number confirm the results (S14, ESI†). The cells at equal electrode areal current densities (jtotal) of 0.7 mA cm−2 and 1 mA cm−2 are shown in Fig. 9a and b, respectively. At lower current density and capacity, the gyroid LAGP–epoxy electrolyte shows an increase in cycling performance compared with the pellet (Fig. 9a). The terminal voltage increases faster at higher current density for both pellet and gyroid LAGP–epoxy electrolytes (Fig. 9b). The increase in current density seems to degrade the hybrid electrolyte performance more than that of the pellet. At equal effective current density through the LAGP phase (jLAGP![[thin space (1/6-em)]](https://www.rsc.org/images/entities/char_2009.gif) phase) of 1 mA cm−2, the terminal voltage of the gyroid LAGP–epoxy electrolyte increases slower than that of the LAGP pellet, doubling the achievable cycle number (Fig. 9c). The same trend occurs at an effective current density of 1.4 mA cm−2 (S14, ESI†).
phase) of 1 mA cm−2, the terminal voltage of the gyroid LAGP–epoxy electrolyte increases slower than that of the LAGP pellet, doubling the achievable cycle number (Fig. 9c). The same trend occurs at an effective current density of 1.4 mA cm−2 (S14, ESI†).
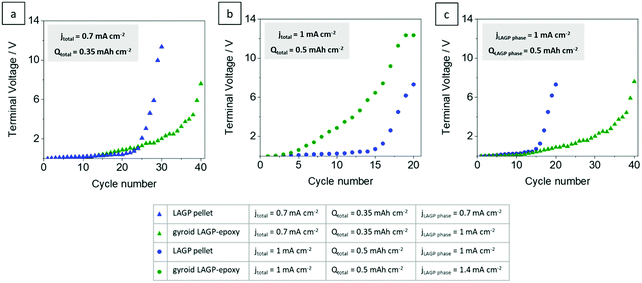 | ||
Fig. 9 Terminal voltage after each completed cycle for LAGP pellet and gyroid LAGP–epoxy electrolytes assembled with symmetric lithium electrodes at current densities (jtotal) of (a) 0.7 mA cm−2 and (b) 1 mA cm−2 and at an effective current density through the LAGP phase (jLAGP![[thin space (1/6-em)]](https://www.rsc.org/images/entities/char_2009.gif) phase) of (c) 1 mA cm−2 until the limiting voltage of the instrument is reached. Detailed cycling parameters and corresponding plots of impedance versus cycle number are shown in S14 (ESI†). phase) of (c) 1 mA cm−2 until the limiting voltage of the instrument is reached. Detailed cycling parameters and corresponding plots of impedance versus cycle number are shown in S14 (ESI†). | ||
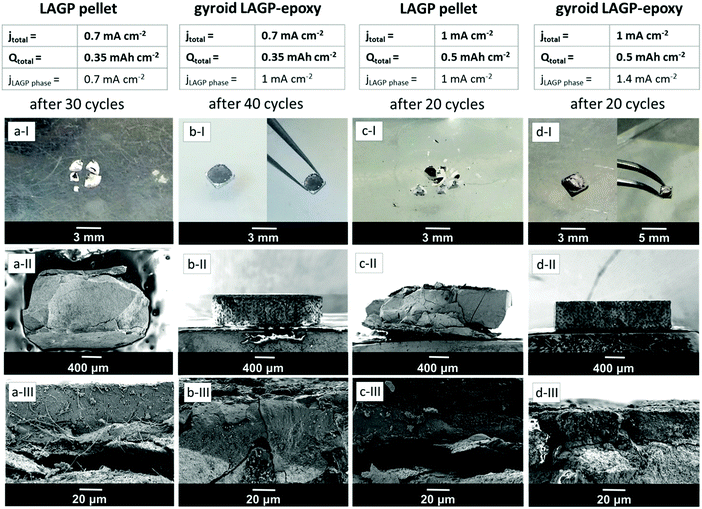
Fig. 10 shows photographs and SEM images of all four cells discussed above in Fig. 8 after cycling. The photographs demonstrate that the LAGP pellet cells split into several fragments during cycling (Fig. 10a-I and c-I) whereas the structured LAGP–epoxy electrolytes remain in one piece (Fig. 10b-I and d-I). Cross-sectional SEM images (Fig. 10a-III, b-III, c-III and d-III) show that an interphase layer of 20–40 μm has grown between lithium and LAGP in all four cells. More significantly, there is a visible detachment of the interphase layer from the bulk LAGP phase for the LAGP pellets at both current densities (Fig. 10a-III and c-III), whereas only minor and partial cracks along the interface between the bulk electrolyte and interphase layer are noticeable for the structured LAGP–epoxy electrolytes (Fig. 10b-III and d-III).
To fully understand these observations, EIS analysis of the individual resistance contributions was performed. For this, the total resistances after each cycle were further separated into the four resistances (R1, R2, R3 and R4) identified previously in the Nyquist plots. This analysis was performed on the LAGP pellet and the gyroid LAGP–epoxy electrolyte cells discussed in Fig. 8. Fig. 11 illustrates the change in resistance of the four contributions as a function of cycle number. In all four cases, the intragrain resistance is apparently not involved in the increase in total resistance, as it does not increase substantially with cycle number. In contrast, the intergrain and the interphase resistances of the LAGP pellet and gyroid LAGP–epoxy electrolyte at both current densities do increase from a certain cycle number onwards. The Li–LAGP interface resistance increases only in the LAGP pellets but not as drastically in the gyroid LAGP–epoxy electrolytes at both current densities of 0.7 mA cm−2 (Fig. 11a and b) and 1 mA cm−2 (Fig. 11c and d). Nevertheless, the start of a slight increase in interface resistance is observable for the structured hybrid at the higher current density (Fig. 11d) from the tenth cycle onwards. Hence, the increase in voltage polarisation observed during cycling at low and high current density can be associated with the increase in all but the intragrain resistance, with the intergrain and interphase layer resistances increasing first followed by the interface resistance.
As seen from the SEM images in Fig. 10 (Fig. 10a-III, b-III, c-III and d-III), an interphase layer of 20–40 μm grows between lithium and LAGP in all four cells, consistent with the increase in the interphase resistance seen for the majority of the cells in Fig. 11. It is likely that the detachment of the interphase layer from the bulk LAGP phase, as seen for the LAGP pellets at both current densities in Fig. 10a and c, manifests itself as an additional “grain boundary” resistance adding to the LAGP intergrain resistance and explaining its increase (Fig. 11). The more severe detachment in the case of the LAGP pellets is consistent with their Li–LAGP interface resistance increasing more significantly. The poor mechanical integrity of the LAGP pellets compared to the structured hybrid electrolytes after cycling probably originates from the development of internal stress associated with the growth of the interphase layer, initiating its detachment from the bulk electrolyte. This eventually also induces cracks perpendicular to the electrolyte/electrode interface (Fig. 10a-II and c-II), until complete fracture of the LAGP pellets (Fig. 10a-I and c-I).
Both gyroid LAGP–epoxy electrolytes retain better overall contact at the interface, which is consistent with the much lower increase in interface resistance observed for the structured hybrid at both current densities. Nevertheless, CT analysis of the cells with LAGP pellet and structured LAGP–epoxy electrolytes at a total areal current density of 1 mA cm−2 before and after cycling confirms that cracks form through both the LAGP pellet as well as the gyroid LAGP–epoxy electrolyte during cycling (S15, ESI†). Nonetheless, we can conclude that the nature of the structured hybrid electrolyte, with its carefully selected microarchitecture and choice of polymer helps hold the fracturing LAGP phase together, as demonstrated here by EIS and cross-sectional SEM analysis.
Mechanical testing
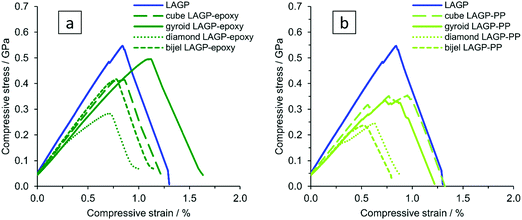
To investigate the mechanical properties of the different structured hybrid electrolytes and the pellet in more detail, samples of about 1 mm × 1 mm × 2 mm were subjected to strain rate controlled compression tests. For comparison, a LAGP cut-out of appropriate size was prepared from a LAGP pellet (S16, ESI†) using a diamond cutting blade. We qualitatively observe that the cube and diamond microarchitectures show preferential fracture along the ordered microarchitectures, as can be seen from in situ compression SEM images after sample fracture (S17, ESI†). In contrast, fracture of the gyroid and bijel-derived structured hybrids as well as of the LAGP cut-out does not follow a preferred major fracture pathway, and cracks split into several parts in multiple directions through the sample. The compliance of the in situ SEM compression stage was too large to accurately determine the displacement of the samples, and so, the following tests were carried out using a stand-alone Shimadzu instrument.The stress–strain curves for LAGP and structured hybrid electrolytes are shown in Fig. 12. The opposing faces of the cuboid samples that are in contact with the compression plates were polished to be parallel to within 10 μm, as shown by optical depth profiling in S18 (ESI†). Compliance of the Shimadzu instrument was corrected for when determining strain. The elastic modulus of LAGP, as determined from the linear sections of the stress–strain curves between loads of 50–150 N was 63 GPa. This is only about half of the value obtained in an independent measurement from nanoindentation of a LAGP pellet (125 GPa) and is below the literature range for the structurally equivalent Li1.3Al0.3Ti1.7(PO4)3 (LATP), for which values of 81–115 GPa are reported.39 The observed difference between the determined elastic moduli is to be expected, given that nanoindentation measures the microscopic mechanical properties of the material, whereas compression measures the macroscopic overall mechanical properties of the sample, which contains imperfections like internal porosity and deviations from the perfectly cuboid sample geometry.
A comparison of bulk LAGP with the LAGP–polymer hybrids, for which an elastic modulus of 41–51 GPa is determined from compression between a load of 50–150 N (S19, ESI†), shows that the elastic modulus of the structured hybrid electrolytes is reduced by 20–35% with a corresponding reduction in compressive fracture stress (evaluated as peak stress in Fig. 12). In comparison, the epoxy containing structured hybrid electrolytes reach higher stress and strain before fracture than those containing PP, possibly because the interfacial interaction between the epoxy polymer and LAGP is stronger than between PP and LAGP. The gyroid LAGP–epoxy electrolyte reaches the highest fracture strain, being about 28% higher than LAGP. Among the designed microarchitectures, finite element modelling confirms the gyroid microarchitecture to show the most uniform spatial distribution of stress (S1, ESI†). This is in agreement with the better performance of the gyroid LAGP–epoxy electrolyte in electrochemical testing observed above.
Consequently, the mechanical properties of polished gyroid LAGP–epoxy electrolyte, LAGP and epoxy polymer were investigated using a four point bending setup as illustrated in S21 (ESI†). All samples were made to be about 12 mm × 3 mm × 0.5 mm to fit the dimension of the four point bending setup. The gyroid LAGP–epoxy beams were synthesised as described above, simply by using a larger version of the 3D printed template. This flexibility in overall sample dimensions is another advantage of our 3D printing approach. The LAGP and epoxy polymer beams were cut out from a pressed LAGP pellet (20 mm diameter) and a pre-made hardened plate of epoxy, respectively. Fig. 13 illustrates the stress–strain curves obtained for all three sample types in strain rate controlled measurements, starting when the support pins make contact with the sample. The bending of the sample is observed as a linear stress–strain dependency.
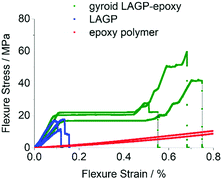 | ||
| Fig. 13 Stress–strain curves obtained from four point bending of LAGP (3 samples, blue), epoxy polymer (2 samples, red) and gyroid LAGP–epoxy electrolyte (three samples, green). | ||
The LAGP beams demonstrate characteristics of a typical brittle polycrystalline ceramic. First, a linear elastic behaviour is observed until a maximum stress is reached when the LAGP beams fracture. This is shown by a drop in the flexure stress with nearly no change in flexure strain, i.e. no plastic deformation is observed. In contrast to LAGP, the epoxy polymer beams are considerably more elastic (S20, ESI†).
The combination of LAGP and epoxy in the gyroid LAGP–epoxy electrolyte demonstrates an intermediate stress–strain relationship to the brittle LAGP ceramic and elastic epoxy polymer. Similar to LAGP, a linear elastic behaviour with a comparable modulus of bending is observed for the structured hybrid beams. In this initial slope, the hybrid properties are dominated by the contribution of the LAGP phase. However, instead of catastrophic failure, a stress plateau is observed. Probably this region corresponds to crack initiation and propagation, the plateau indicating that the epoxy polymer helps to retain the overall sample integrity.40 Finally, a second increase in stress is observed before fracture of the sample occurs at a strain up to five times higher than the flexural failure strain obtained for LAGP, which suggests that the epoxy polymer strengthens the structured hybrid electrolyte.
The four point bending experiments indicate that the epoxy phase in the gyroid LAGP–epoxy electrolyte can maintain the overall sample integrity even after crack initiation. Hence, the gyroid LAGP–epoxy beams mechanically outperform the LAGP beams. This demonstrates that the bicontinuous gyroid LAGP–epoxy electrolyte has significantly improved mechanical properties over the LAGP pellet due to the presence of the polymer phase while maintaining high ionic conductivity through the LAGP phase.
Conclusion
We present hybrid electrolytes composed of 3D bicontinuous ordered microchannels of ceramic electrolyte, Li1.4Al0.4Ge1.6(PO4)3, and non-conducting polymer (epoxy polymer, polypropylene). The synthesis was achieved using 3D printing of templates enabling ordered cubic, gyroidal and diamond-shaped microarchitectures as well as a bijel-derived microarchitecture of the hybrid electrolytes. The microarchitecture influences the electrical and mechanical properties. The best performance was achieved for the gyroidal architecture with epoxy polymer. It had a total ionic conductivity of 1.6 × 10⁻⁴ S cm−1 at room temperature, reduced from the conductivity of a dense ceramic pellet, 2.8 × 10⁻⁴ S cm−1, by only the volume fraction of the ceramic in the hybrid. Mechanical measurements showed that the gyroidal hybrid electrolyte is less susceptible to fracture than the ceramic pellet. This resulted in up to 28% higher compressive failure strain and up to five times the flexural failure strain of a LAGP pellet before rupture. Consequently, the cycling results indicate that the gyroid LAGP–epoxy electrolyte improves the performance of a symmetric lithium cell compared with the ceramic pellet, especially at lower current density. At all tested current densities, the gyroidal hybrid electrolyte shows improved galvanostatic cycling performance for the same effective current density through the ceramic phase. Achieving optimal mechanical and electrical properties throughout the whole all-solid-state battery is one of the major challenges yet to be resolved. The present work focuses on tuning the mechanical properties of the solid electrolyte and its effect on the lithium metal/solid electrolyte interface. The hybrid electrolyte may offer benefits at the cathode, but this has yet to be explored. Even if it does, alone this will not address all the challenges in the composite cathode. Overall, the hybrid electrolytes with designed 3D ordered bicontinuous ceramic and polymer microchannels afford control over the microarchitecture and ceramic/polymer ratio of the hybrid solid electrolyte, delivering improved mechanical properties while maintaining good ionic conductivity, thereby opening up a pathway for the development of mechanically robust solid electrolytes for all-solid-state batteries.Experimental
3D photolithography
The 3D templates were printed using a commercial stereolithography instrument (Nanoscribe Photonic Professional GT) with UV-sensitive photoresist IP-S (Nanoscribe) on an indium tin oxide coated glass slide substrate. The fabrication process involves the layer-by-layer stacking of 1 μm thick planes. A 25× objective with numerical aperture of 0.8 was used to direct the focal point of the laser (wavelength 780 nm) across an approximately 240 μm × 240 μm sized field of view. The time to print one template is dependent on the geometry, scales with the size and is about 8 to 12 hours per template of approximately 1.2 mm × 1.2 mm × 2.4 mm edge length. Templates were extracted from residual photoresist by subsequent washing with propylene glycol monomethyl ether acetate (>99.5%) and isopropanol (99.5%). The developed templates were dried in ambient conditions for 30 minutes. Details on the microarchitecture design are given in S3 (ESI†).LAGP synthesis
A mixture of ethylene glycol (6.56 g, 99.8%) and citric acid monohydrate (22.20 g, 99%) was slowly stirred for more than 12 hours at ambient temperature before germanium ethoxide (25.00 g, 99.95%) was added. Separately, a solution of lithium nitrate (5.97 g, 99.99%), aluminium nitrate nonahydrate (9.28 g, 99.997%) and ammonium dihydrogen phosphate (21.33 g, 99.999%) in distilled water (47.40 g) was freshly prepared. Both were cooled in a NaCl–ice-water bath before the cold aqueous solution was added to the mixture while stirring rapidly, forming a uniform solution. The resulting solution was removed from the cold bath and left to gel at ambient temperature before drying at 75 °C. The dry gel was calcined on a gold crucible by heating to 800 °C at a rate of 2 degrees per minute and retaining at 800 °C for 5 h before cooling to room temperature. The resulting white material was crushed with an agate mortar and ball milled (Retsch EMAX high energy ball mill: 600 rpm, 10 minutes with 21.5 g of Zirconia 5 mm balls, 0.5 g of LAGP powder and 0.5 mL of ethanol per Zirconia-lined milling vessel). The ball-milled LAGP was recovered and dried.Synthesis of structured LAGP scaffolds
The 3D printed template was placed in a glass vial (0.75 mL in volume) onto which a suspension of 100 mg LAGP powder in 0.7 mL methanol (99.99%) was added. The vial containing the immersed template was sonicated for 5 minutes followed by centrifugation at 2000 rpm for 2 minutes, all of which was repeated twice, resulting in sedimentation of the powder. The supernatant methanol was removed and a second suspension of 100 mg LAGP powder in 0.7 mL methanol was added to the template-LAGP powder sediment. The vial was then centrifuged at 2000 rpm for 2 minutes, sonicated for 5 minutes and, again, centrifuged at 2000 rpm for 2 minutes. The supernatant methanol was removed. In some cases additional suspension had to be added and centrifuged to completely cover the template. The filled 3D template was removed from the vial and excess LAGP powder scraped off carefully by means of a scalpel before drying of the sample. Heating of the filled template to 900 °C at a rate of 2 degrees per minute and retaining at 900 °C for 5 hours in air removes the 3D printed template by calcination and sinters the LAGP powder to yield the negative replica of the 3D printed template in LAGP, referred to in the text as the “structured LAGP scaffold”. There was no evidence of residual carbon when fractured surfaces were examined with SEM and the conductivity of the final 3D hybrid is consistent with the ionic conductivity of LAGP alone.Polypropylene filling
Impregnation of structured LAGP scaffolds with polypropylene was achieved by immersing the structured LAGP scaffold into molten polypropylene (isotactic, average Mw ∼ 12![[thin space (1/6-em)]](https://www.rsc.org/images/entities/char_2009.gif) 000 Da) at 190 °C. The polymer was allowed to percolate the LAGP scaffold under dynamic vacuum for at least 2 h. The sample was removed from the liquid polymer and left to cool to ambient temperature. To remove excess polymer, the polypropylene-filled sample was gently placed on a 1 mm thick glass slide on a hot plate heated to 160 °C. The sample was carefully slid across the hot glass slide on all sides using metal tweezers, locally softening excess polymer, which adheres to the glass slide. Alternatively, aluminium foil at 100 °C can also be used. The process was carried out until most of the excess polymer was removed. The resulting samples are referred to in the text as “structured hybrid electrolyte” or “structured LAGP–PP electrolyte”; when specifically referring to the gyroid microarchitecture “gyroid hybrid electrolyte” or “gyroid LAGP–PP electrolyte” is used.
000 Da) at 190 °C. The polymer was allowed to percolate the LAGP scaffold under dynamic vacuum for at least 2 h. The sample was removed from the liquid polymer and left to cool to ambient temperature. To remove excess polymer, the polypropylene-filled sample was gently placed on a 1 mm thick glass slide on a hot plate heated to 160 °C. The sample was carefully slid across the hot glass slide on all sides using metal tweezers, locally softening excess polymer, which adheres to the glass slide. Alternatively, aluminium foil at 100 °C can also be used. The process was carried out until most of the excess polymer was removed. The resulting samples are referred to in the text as “structured hybrid electrolyte” or “structured LAGP–PP electrolyte”; when specifically referring to the gyroid microarchitecture “gyroid hybrid electrolyte” or “gyroid LAGP–PP electrolyte” is used.
Epoxy polymer filling
Impregnation of structured LAGP scaffolds with epoxy resin was achieved by immersing the structured LAGP scaffold in a mixture of Struers EpoFix Resin and EpoFix Hardener (15![[thin space (1/6-em)]](https://www.rsc.org/images/entities/char_2009.gif) :
:![[thin space (1/6-em)]](https://www.rsc.org/images/entities/char_2009.gif) 2 by volume) under dynamic vacuum for at least 2 hours at ambient temperature. The sample was removed from the liquid resin and excess resin was removed manually. The sample was left to harden at ambient temperature for 24 h. The resulting samples are referred to in the text as “structured hybrid electrolyte” or “structured LAGP–epoxy electrolyte”; when specifically referring to the gyroid microarchitecture “gyroid hybrid electrolyte” or “gyroid LAGP–epoxy electrolyte” is used.
2 by volume) under dynamic vacuum for at least 2 hours at ambient temperature. The sample was removed from the liquid resin and excess resin was removed manually. The sample was left to harden at ambient temperature for 24 h. The resulting samples are referred to in the text as “structured hybrid electrolyte” or “structured LAGP–epoxy electrolyte”; when specifically referring to the gyroid microarchitecture “gyroid hybrid electrolyte” or “gyroid LAGP–epoxy electrolyte” is used.
Polishing of compression samples
Samples were polished manually on a diamond lapping film of subsequently 9, 6, 3 and 1 μm abrasive size. In order to obtain parallel surfaces, the diamond lapping film was attached to one of the plates of a rheometer (Anton Paar) and the structured hybrid samples to be polished were placed in between the plates at a force of 2 N. Rotation of the plate to which the lapping film was attached against the sample polished the surface to better than 10 μm out of parallel over a length of 1 mm as determined by optical depth profiling (Alicona).SEM and EDX
Secondary electron images were recorded on a Zeiss Merlin microscope at 3 kV acceleration voltage. Samples were fixed with copper adhesive tape. In addition, a thin layer of gold was sputtered on the 3D printed templates to avoid charging. For cross-sectional images, samples were cut using an ultrasonic cutter (Sonotec) with a tungsten carbide blade. Energy dispersive X-ray spectroscopy was carried out at 20 kV with a built-in Oxford Instruments X-Max 150 Silicon drift detector and analysed using the Aztec software package.X-ray micro-CT of 3D printed templates and structured LAGP scaffolds
Shadow-projection images of structured LAGP scaffolds were recorded using a Skyscan 1172 system (Bruker microCT, Kontich, Belgium), rotating the sample over a full 360° in steps of 0.36°. A source voltage of 70 kV (Hamamatsu 100/250), an Al + Cu filter, and an image pixel size of 2.50 μm (Hamamatsu 10 Mp camera) was used. The NRecon software package was used to reconstruct the data into stacks of axial slices, using a 20% beam hardening correction and frame averaging of 8, but no random movement. 3D views were constructed in ImageJ (version Fiji).41 Data stacks were cropped to extract the inner 500 × 500 × 500 μm3. Interactive stack rotation was used to align the cropped data with Cartesian axes by eye. After smoothing (3×), the cropped-stack histogram was inspected, the data was thresholded and 3D surface renderings were generated using the ImageJ “3D Viewer” plugin. A similar procedure was followed for the 3D printed templates, though some of the imaging and reconstruction parameters were adapted to account for the difference in contrast (i.e. electron density) between the 3D printed template material and LAGP.X-ray diffraction
Powder X-ray diffraction patterns of the synthesised LAGP and structured LAGP scaffolds were collected using a Rigaku SmartLab X-ray diffractometer equipped with a 3 kW rotating anode X-ray generator with Cu Kα1 radiation. Powder XRD diffraction patterns were acquired at room temperature, in the theta/2-theta range from 10 to 80° with a step size of 0.01.Electrochemical impedance spectroscopy (EIS)
EIS measurements were performed using ModuLab XM®, Solartron Analytical. Samples were first polished using a silicon carbide waterproof abrasive disc (Kemet, Grade 1200), sonicated in cyclohexane for 10 minutes and dried in air at 70 °C for 20 minutes. Polished samples were then sputtered with a 30 nm thick layer of gold on both sides using a sputter coater (Manual Sputter Coater, Agar Scientific) and placed between two stainless steel electrodes. Impedance measurements were carried out in a temperature range of −20 °C to 75 °C, controlled by a refrigerated/heating circulator (Model F32-MA, Julabo). For reaching a temperature of −30 °C, liquid nitrogen was used to cool the samples. The measurements were recorded between 1 MHz and 0.1 Hz at a voltage amplitude of 10 mV. The EIS data was analysed using ZView software.Galvanostatic cycling of symmetric lithium cells
Symmetric cells of LAGP pellets and structured LAGP–PP and LAGP–epoxy electrolytes with lithium metal were assembled inside an Ar-filled glovebox, in which O2 and H2O levels are lower than 0.1 ppm. Both LAGP pellet and structured LAGP–polymer electrolyte surfaces, to be in contact with lithium metal, were polished with water using a silicon carbide waterproof abrasive disc (Kemet, Grade 1200), dried in air at 70 °C for 20 minutes, sonicated in cyclohexane for 10 minutes and dried in air at 70 °C again for 20 minutes. Lithium metal foil was scratched to remove oxidised surface layers and cut into disk-shaped pieces. These were then pressed at a pressure of 10 tons using a manual hydraulic press (Specac) to a thickness of about 70 μm in order to limit any further expansion of the lithium disk after cell assembly. A lithium metal disk with a diameter of 2.2 mm and a thickness of ca. 40 μm was pressed onto each side of either a structured LAGP–polymer electrolyte or a sintered disk-shaped LAGP pellet. The structured hybrid has a square shape with approximate dimensions of 2.6 mm × 2.6 mm × 0.7 mm. The LAGP pellets have an approximate diameter of 4.4 mm and thickness of 0.9 mm. The assembled stack was placed and sealed in a pouch cell with both lithium electrodes contacting a Cu foil current collector: Cu/Li/LAGP/Li/Cu. The symmetric lithium cells were tested using Gamry Interface-1000 devices at ambient temperature with an external pressure of about 8 MPa at a constant current density of 0.7 mA cm−2, 1 mA cm−2 or 1.4 mA cm−2 for 0.5 hours with a rest period of 5 min after each current direction. Impedance measurements after each charge and discharge step were also performed.X-ray micro-CT of symmetric lithium cells
Pouched symmetric lithium cells were prepared as described above. Shadow-projection images of pouched symmetric lithium cells were recorded on a Zeiss Xradia system, rotating the sample over a full 360° in steps of 0.1°. A source voltage of 120 kV and an image pixel size of 3.53 μm were used. The Zeiss reconstruction software package was used for image reconstruction into stacks of axial slices.In situ compression SEM
Mechanical compression was carried out using a Deben Microtest Stage and 660 N load cell mounted on a Zeiss EVO microscope. Samples were preloaded to below 5 N before compression was carried out in steps until fracture of the sample. Secondary electron images of the fractured samples were recorded at 15 kV acceleration voltage.Compression testing
Rectangular cuboid samples of approximately 1 mm × 1 mm × 2 mm in size, polished as described above, were compressed on a strain rate controlled universal testing machine (Shimadzu AGS-X, 50 kN load cell) with the square sample faces in contact with the parallel plates of the compression rig. Samples were preloaded to 50 N before the measurement was started. Compliance of the instrument was accounted for. Samples were compressed at a rate of 1 μm min−1 until failure.Four point bending experiments
Rectangular-shaped beams of approximately 12 mm × 3 mm × 0.5 mm were prepared, polished and mounted on an Instron 3360 Series Dual Column table top testing system with a custom-made four point bending jig (S21, ESI†). A preload of 0.05 N was applied and the bending test carried out at a loading rate of 5 μm min−1 until a 100% drop in the peak flexure load was attained.Conflicts of interest
There are no conflicts to declare.Acknowledgements
We are very grateful for funding from the EPSRC (EP/J007404), especially the Energy Storage Supergen grant (EP/L019469/1). The Royal Society of Edinburgh and the Deutsche Forschungsgemeinschaft (RI2614/1-1). We thank Matthew Reeves for preparing the actual bijel sample of which the CT scan was used for 3D printing bijel-derived architectures and are grateful to Professor James Marrow and Ziyang Ning for their help with the CT scans of symmetric lithium cells and acknowledge the corresponding EPSRC grant EP/M02833X/1. We further thank Marzena Tkaczyk and Dr Kalin Dragnevski for their help with polishing of compression samples, optical depth profiling and with in situ compression in the SEM and are grateful to John Waite and Bo-Shiuan Li for their help with compression and four point bending mechanical tests. Finally, we would like to express our gratitude to Dr Yuri Andreev, Dr Benjamin Bergner, Peiyu Chen, Gareth Hartley and the staff of the David Cockayne Centre for Electron Microscopy for valuable discussions at different stages of this project.References
- D. Willetts, Eight Great Technologies, Policy Exchange, 2013.
- B. Owens, Nature, 2015, 526, S89 CrossRef CAS PubMed.
- J. Motavalli, Nature, 2015, 526, S96 CrossRef CAS PubMed.
- A. Mauger, M. Armand, C. M. Julien and K. Zaghib, J. Power Sources, 2017, 353, 333 CrossRef CAS.
- C. Sun, J. Liu, Y. Gong, D. P. Wilkinson and J. Zhang, Nano Energy, 2017, 33, 363 CrossRef CAS.
- Y. S. Jung, D. Y. Oh, Y. J. Nam and K. H. Park, Isr. J. Chem., 2015, 55, 472 CrossRef CAS.
- J. Janek and W. G. Zeier, Nat. Energy, 2016, 1, 16141 CrossRef.
- F. P. McGrogan, T. Swamy, S. R. Bishop, E. Eggleton, L. Porz, X. Chen, Y.-M. Chiang and K. J. Van Vliet, Adv. Energy Mater., 2017, 7, 1602011 CrossRef.
- A. Mauger, M. Armand, C. M. Julien and K. Zaghib, J. Power Sources, 2017, 353, 333–342 CrossRef CAS.
- Y. Wang and W. H. Zhong, ChemElectroChem, 2015, 2, 22–36 CrossRef CAS.
- N. Kamaya, K. Homma, Y. Yamakawa, M. Hirayama, R. Kanno, M. Yonemura, T. Kamiyama, Y. Kato, S. Hama and K. Kawamoto, Nat. Mater., 2011, 10, 682 CrossRef CAS PubMed.
- J. E. Weston and B. C. H. Steele, Solid State Ionics, 1982, 7, 75 CrossRef CAS.
- F. Croce, G. B. Appetecchi, L. Persi and B. Scrosati, Nature, 1998, 394, 456 CrossRef CAS.
- F. Croce, L. Persi, B. Scrosati, F. Serraino-Fiory, E. Plichta and M. A. Hendrickson, Electrochim. Acta, 2001, 46, 2457 CrossRef CAS.
- W. Wieczorek, K. Such, H. Wyciślik and J. Płocharski, Solid State Ionics, 1989, 36, 255 CrossRef CAS.
- J. Maier, Berichte der Bunsengesellschaft für physikalische Chemie, 1985, 89, 355 CrossRef CAS.
- K. K. Fu, Y. Gong, J. Dai, A. Gong, X. Han, Y. Yao, C. Wang, Y. Wang, Y. Chen, C. Yan, Y. Li, E. D. Wachsman and L. Hua, Proc. Natl. Acad. Sci. U. S. A., 2016, 113(26), 7094 CrossRef CAS PubMed.
- W. Liu, S. W. Lee, D. Lin, F. Shi, S. Wang, A. D. Sendek and Y. Cui, Nat. Energy, 2017, 2, 17035 CrossRef CAS.
- H. Zhai, P. Xu, M. Ning, Q. Cheng, J. Mandal and Y. Yang, Nano Lett., 2017, 17, 3182–3187 CrossRef CAS PubMed.
- N. B. Aetukuri, S. Kitajima, E. Jung, L. E. Thompson, K. Virwani, M.-L. Reich, M. Kunze, M. Schneider, W. Schmidbauer, W. W. Wilcke, D. S. Bethune, J. C. Scott, R. D. Miller and H.-C. Kim, Adv. Energy Mater., 2015, 5, 1500265 CrossRef.
- C. Xu, B. M. Gallant, P. U. Wunderlich, T. Lohmann and J. R. Greer, ACS Nano, 2015, 9(6), 5876 CrossRef CAS PubMed.
- L. R. Meza, A. J. Zelhofer, N. Clarke, A. J. Mateos, D. M. Kochmann and J. R. Greer, Proc. Natl. Acad. Sci. U. S. A., 2015, 112(37), 11502 CrossRef CAS PubMed.
- T. A. Schaedler, A. J. Jacobsen, A. Torrents, A. E. Sorensen, J. Lian, J. R. Greer, L. Valdevit and W. B. Carter, Science, 2011, 334, 962 CrossRef CAS PubMed.
- I. Kokal, E. J. van den Hamn, A. C. A. Delsing, P. H. L. Notten and H. T. Hintzen, Ceram. Int., 2015, 41, 737 CrossRef CAS.
- M. Hara, H. Nakano, K. Dokko, S. Okuda, A. Kaeriyama and K. Kanamura, J. Power Sources, 2009, 189, 485 CrossRef CAS.
- J. H. Pikul, H. G. Zhang, J. Cho, P. V. Braun and W. P. King, Nat. Commun., 2013, 4, 1732 CrossRef PubMed.
- R. Liu, J. Duaya and S. B. Lee, Chem. Commun., 2011, 47, 1384 RSC.
- S. Ferrari, M. Loveridge, S. D. Beattie, M. Jahn, R. J. Dashwood and R. Bhagat, J. Power Sources, 2015, 286, 25 CrossRef CAS.
- K. Sun, T.-S. Wei, B. Y. Ahn, J. Y. Seo, S. J. Dillon and J. A. Lewis, Adv. Mater., 2013, 25, 4539 CrossRef CAS PubMed.
- M. Reeves, K. Stratford and J. H. J. Thijssen, Soft Matter, 2016, 12, 4082 RSC.
- M. Lee and A. Mohraz, Adv. Mater., 2010, 22, 4836 CrossRef CAS PubMed.
- Handbook of Sol-Gel Science and Technology, V. I Sol-Gel Processing, ed. S. Sakka and H. Kozuka, Kluwer Academic Publishers, New York, 2005 Search PubMed.
- M. Zhang, K. Takahashi, N. Imanishi, Y. Takeda, O. Yamamoto, B. Chi, J. Pu and J. Li, J. Electrochem. Soc., 2012, 159, A1114 CrossRef CAS.
- Impedance Spectroscopy Theory, Experiment, and Application, ed. E. Barsoukov and J. R. Macdonald, John Wiley & Sons, Hoboken, NJ, 2nd edn, 2005 Search PubMed.
- J. T. S. Irvine, D. C. Sinclair and A. R. West, Adv. Mater., 1990, 2, 132 CrossRef CAS.
- C. R. Mariappan, C. Yada, F. Rosciano and B. Roling, J. Power Sources, 2011, 196, 6456 CrossRef CAS.
- M. R. Busche, T. Drossel, T. Leichtweiss, D. A. Weber, M. Falk, M. Schneider, M.-L. Reich, H. Sommer, P. Adelhelm and J. Janek, Nat. Chem., 2016, 8, 426 CrossRef CAS PubMed.
- P. Hartmann, T. Leichtweiss, M. R. Busche, M. Schneider, M. Reich, J. Sann, P. Adelhelm and J. Janek, J. Phys. Chem. C, 2013, 117, 21064 CAS.
- S. D. Jackman and R. A. Cutler, J. Power Sources, 2012, 218, 65 CrossRef CAS.
- A. G. Evans, J. Am. Ceram. Soc., 1990, 73(2), 187 CrossRef CAS.
- W. S. Rasband, ImageJ, U. S. National Institutes of Health, Bethesda, Maryland, USA, 1997–2016, https://imagej.nih.gov/ij/.
Footnotes |
| † Electronic supplementary information (ESI) available. See DOI: 10.1039/c7ee02723k |
| ‡ Data can be accessed in the Oxford Research Archive under DOI: 10.5287/bodleian:keZNAzRD2. |
| § Contributed equally. |
| ¶ Present address: Department of Materials, Imperial College London, London, SW7 2AZ, UK. |
| || Present address: Key Laboratory of Flexible Electronics (KLOFE) & Institute of Advanced Materials (IAM), Jiangsu National Synergetic Innovation Center for Advanced Materials (SICAM), Nanjing Tech University, 30 South PuZhu Road, Nanjing, Jiangsu, 211816, China. |
| ** Present address: Physikalisch-Chemisches Institut, Justus-Liebig-Universität Gießen, 35392 Gießen, Germany. |
| This journal is © The Royal Society of Chemistry 2018 |

