 Open Access Article
Creative Commons Attribution 3.0 Unported Licence
Effect of composition on the structure of lithium- and manganese-rich transition metal oxides†
Alpesh Khushalchand
Shukla
 *abc,
Quentin M.
Ramasse
b,
Colin
Ophus
c,
Despoina Maria
Kepaptsoglou
b,
Fredrik S.
Hage
b,
Christoph
Gammer
d,
Charles
Bowling
e,
Pedro Alejandro Hernández
Gallegos
e and
Subramanian
Venkatachalam
e
aEnergy Storage and Distributed Resources Division, Lawrence Berkeley National Laboratory, Berkeley, California, USA. E-mail: akshukla@lbl.gov
bSuperSTEM, Daresbury, UK
cNational Center for Electron Microscopy, Molecular Foundry, Lawrence Berkeley National Laboratory, Berkeley, California, USA
dErich Schmid Institute of Materials Science, Austrian Academy of Sciences, Leoben, Austria
eEnvia Systems, Newark, California, USA
First published on 10th January 2018
Abstract
The choice of chemical composition of lithium- and manganese-rich transition metal oxides used as cathode materials in lithium-ion batteries can significantly impact their long-term viability as storage solutions for clean energy automotive applications. Their structure has been widely debated: conflicting conclusions drawn from individual studies often considering different compositions have made it challenging to reach a consensus and inform future research. Here, complementary electron microscopy techniques over a wide range of length scales reveal the effect of lithium-to-transition metal-ratio on the surface and bulk structure of these materials. We found that decreasing the lithium-to-transition metal-ratio resulted in a significant change in terms of order and atomic-level local composition in the bulk of these cathode materials. However, throughout the composition range studied, the materials consisted solely of a monoclinic phase, with lower lithium content materials showing more chemical ordering defects. In contrast, the spinel-structured surface present on specific crystallographic facets exhibited no noticeable structural change when varying the ratio of lithium to transition metal. The structural observations from this study warrant a reexamination of commonly assumed models linking poor electrochemical performance with bulk and surface structure.
Broader contextModern society's increasing demands for cleaner, safer, cheaper, and longer-lasting energy storage solutions are driving many industries to develop new and improved battery materials. This is particularly true in the automotive sector, where the electrochemical shortcomings that currently plague the implementation of high capacity materials such as lithium- and manganese-rich transition metal oxides (LMRTMOs) as a viable long-term choice of lithium-ion battery cathode must be addressed urgently. One promising avenue consists in deviating from the widely studied high lithium/transition metal (Li/TM) ratio chemistries. However, almost no information is available on the effect of composition on the complex structure of the pristine, uncycled LMRTMOs. This work addresses this long-standing issue and identifies the bulk structure as a single monoclinic phase through the entire composition range, with complex changes to local ordering as the Li/TM ratio decreases. Crucially, we also present strong evidence for the presence of a spinel layer on the surface of pristine LMRTMOs irrespective of composition, and emphasize that its presence in the pristine state cannot be ignored when studying cycled materials. These findings demonstrate the importance of a thorough characterization of the pristine material's bulk and surface to avoid misinterpretations and ambiguities before turning to phase transformation studies. |
1 Introduction
Advances in the electrification of vehicles and the successful implementation of a decentralized electricity grid that efficiently utilizes renewable energy sources are largely dependent on the development of materials that would enable energy storage systems with substantially superior energy density, cycle life, and safety compared to those provided by the state-of-the-art batteries. Applications such as electric cars specifically require batteries with high capacity to alleviate range anxiety, enable longer lifetimes, and provide higher safety standards. It is known that increasing the lithium content in layered transition metal oxides (Li1+xM1−xO2, where x > 0 and M refers to a combination of transition metals such as nickel, manganese, and cobalt) can lead to capacities greater than 250 mA h g−1.1 However, in spite of the high capacities found in lithium- and manganese-rich transition metal oxides (referred to as LMRTMO in general, and LMR NMC where the transition metals are specifically nickel, manganese, and cobalt), their commercial application has been hindered by shortcomings in the materials including a large first cycle irreversible capacity loss,2 voltage and capacity fade,3 high DC resistance at low states of charge, and transition metal dissolution.4 So far, most of the LMRTMO compounds studied have had a relatively high lithium to transition metal (Li/TM) ratio of 1.5, at which the previously described shortcomings are more pronounced. Recent electron microscopy studies on this class of materials have shown that their bulk structure consists of domains corresponding to monoclinic variants,5–7 while the surfaces of certain facets consist of a spinel structure.6 It is logical to assume decreasing the Li/TM ratio could mitigate the aforementioned issues albeit at the cost of reduced capacities; however, there have been very few studies on LMRTMOs with intermediate or low Li/TM ratios. To our knowledge, the only study on the effect of composition on structure was performed on LMRTMO containing only manganese and nickel in the transition metal component,8,9 and no detailed studies on LMR NMC have been reported. Overall, the majority of available literature deals with either “stoichiometric” LiMO2 or LMRTMO chemistries with high Li/TM ratios, but a systematic study of materials with ranging Li/TM ratios is wanting. Hence, the structure of these materials with low and medium Li/TM ratio and its effect on the resulting materials' electrochemical properties are not yet clearly understood.In this work, we analyze several LMR NMC compositions with varying Li/TM ratios and systematically study the relationship between the bulk and surface structures and the electrochemical performance of these materials. The applications goal of this study is to identify an optimum composition that could maximize the LMR NMC's energy while reducing the voltage fade over cycling. This effort must begin with clearly understanding the structure of the materials at the pristine stage (prior to electrochemical testing). Samples with three different Li/TM ratios were studied using electron microscopy techniques such as high angle annular dark field (HAADF) imaging in the scanning transmission electron microscope (STEM), electron energy loss spectroscopy (EELS), X-ray energy dispersive spectroscopy (XEDS), and virtual images formed from STEM diffraction images recorded at many probe positions.
2 Results and discussion
2.1 Electrochemical measurements
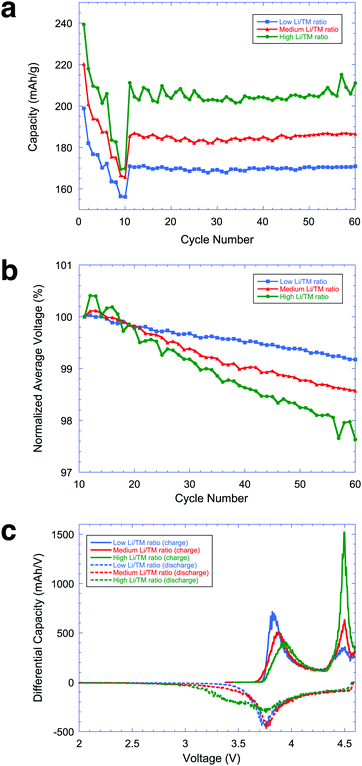
In order to study the effect of composition on the structure and electrochemical performance of LMR NMC materials, three materials with different Li/TM ratios were prepared and electrochemically characterized. The compositions of the three LMR NMC materials under study, as measured using inductively-coupled plasma optical emission spectrometer (ICP-OES) are shown in Table 1. Fig. 1a shows the rate capability and cycling stability exhibited by these materials across a Li–metal anode at high voltage. The corresponding voltage profiles are shown in Fig. S1 in ESI.† Understanding the rate capability of different compositions is extremely critical to decide the practical utilization of the material for vehicular applications. The ratio of 2C/0.1C for the three different compositions are 86, 83 and 78% for samples with low, medium and high Li/TM ratios, respectively. This study clearly indicates that the composition with lower Li and Mn shows higher rate capability. Rate capability has always a direct impact on the DC-resistance behavior of the respective material and in general materials with a higher rate capability are expected to show improved DC-resistance behavior. Fig. 1b and c, however, illustrate that the high capacity achieved by higher Li/TM ratio materials comes at the cost of increased voltage fade during cycling and an increase in low voltage activity during discharge. It is desirable to keep DC resistance low across the entire operating voltage range in order to obtain higher power and higher energy utilization in a battery application.| Sample | Li/TM ratio | Chemical formula |
|---|---|---|
| High Li:TM | 1.353 | Li1.15Ni0.1748Mn0.496Co0.18O2 |
| Medium Li:TM | 1.222 | Li1.1Ni0.227Mn0.438Co0.235O2 |
| Low Li:TM | 1.17 | Li1.079Ni0.248Mn0.411Co0.263O2 |
2.2 X-ray diffraction
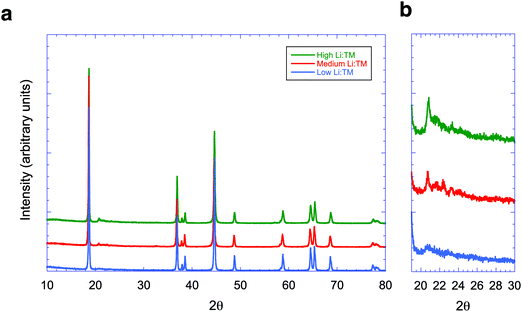
Fig. 2 shows the X-ray diffraction patterns of these three materials. As shown in Fig. 2b, the intensity of peaks found between 20° and 30° decreases with a lower Li/TM ratio. The XRD pattern of the material with the lowest Li/TM ratio has a closer resemblance to that of layered oxides with a trigonal structure. However, additional peaks between 20° and 30° are still visible. It has been argued that XRD patterns cannot be used to confirm whether the LMR NMC materials consist of either two phases, one trigonal and one monoclinic, or a single monoclinic phase.10 Moreover, small peaks in this range of angles can also arise from a P3112 structure that consists of ( ) R30° superlattice ordering of the manganese, nickel, and cobalt in the transition metal layer.11 Therefore, a closer examination using techniques that provide higher spatial resolution, such as aberration-corrected STEM, is warranted. In the following sections, results from various electron microscopy studies on LMR NMC materials with high, medium, and low Li/TM ratio will be presented.
2.3 Structure of LMR NMC with high Li/TM ratio
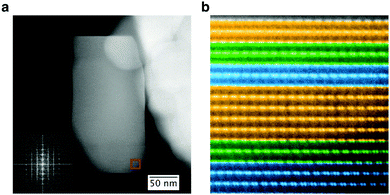
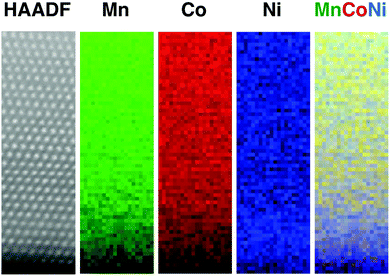
The structure of the LMR NMC with a high Li/TM ratio of 1.35 is shown in Fig. 3. The structure is similar to that observed in a recently published study on LMR NMC with high Li/TM ratio,6,7 and also to that of other LMRTMOs such as Li1.2Ni0.2Mn0.6O2,5 whose Li/TM ratio is also 1.5. Therefore, only a brief description is provided here. Fig. 3b shows a typical HAADF image taken in [100]supercell direction, where the subscript supercell refers to a cell made by randomly stacking three variants of monoclinic structure fitted in an orthorhombic unit cell, as described in ref. 6. The HAADF image exhibits the presence of doublets that correspond to transition metal columns separated by a column with lower intensity that consists of both transition metals and lithium (called the “shared column” henceforth). The HAADF image also demonstrates the presence of domains that correspond to three different variants of monoclinic structure, namely [100], [1![[1 with combining macron]](https://www.rsc.org/images/entities/char_0031_0304.gif) 0], and [110], shown using orange, blue, and green colors, respectively. These variants give rise to streaks in a diffractogram because the individual reflections from these variants are very close to each other as shown in the inset of Fig. 3a. The intensity of the shared column is relatively consistent throughout the primary particle except for the variation caused by the change in particle thickness since the image was taken from a tapered region near the edge of the particle as shown in Fig. 3a. Any non-uniformity in this pattern is only occasional, but has slightly higher occurrence than that observed in LMR NMC with higher lithium content, such as Li1.2Ni0.13Mn0.54Co0.13.6 EELS and XEDS maps taken with sub-nanometer resolution over several areas in different particles exhibited relatively uniform distribution of transition metals except at certain facets where higher concentration of nickel was observed, as shown in Fig. 4.
0], and [110], shown using orange, blue, and green colors, respectively. These variants give rise to streaks in a diffractogram because the individual reflections from these variants are very close to each other as shown in the inset of Fig. 3a. The intensity of the shared column is relatively consistent throughout the primary particle except for the variation caused by the change in particle thickness since the image was taken from a tapered region near the edge of the particle as shown in Fig. 3a. Any non-uniformity in this pattern is only occasional, but has slightly higher occurrence than that observed in LMR NMC with higher lithium content, such as Li1.2Ni0.13Mn0.54Co0.13.6 EELS and XEDS maps taken with sub-nanometer resolution over several areas in different particles exhibited relatively uniform distribution of transition metals except at certain facets where higher concentration of nickel was observed, as shown in Fig. 4.
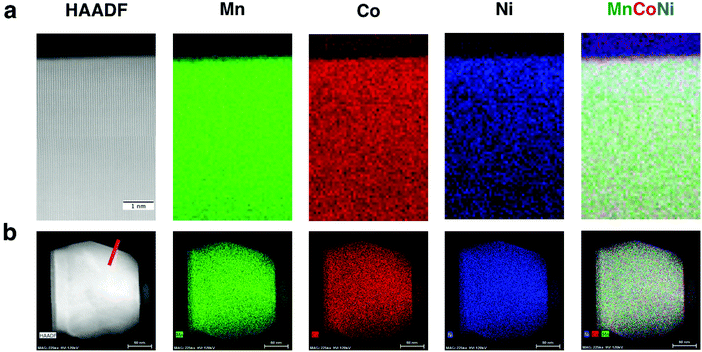 | ||
| Fig. 4 EELS and XEDS maps for LMR NMC with high Li/M ratio: (a) EELS map at sub nanometer resolution and (b) XEDS map covering an entire primary particle. Both maps show relatively uniform distribution of transition metals except at certain facets, where high concentration of nickel was observed as shown in Fig. S7 in ESI.† | ||
2.4 Structure of LMR NMC with medium Li/TM ratio
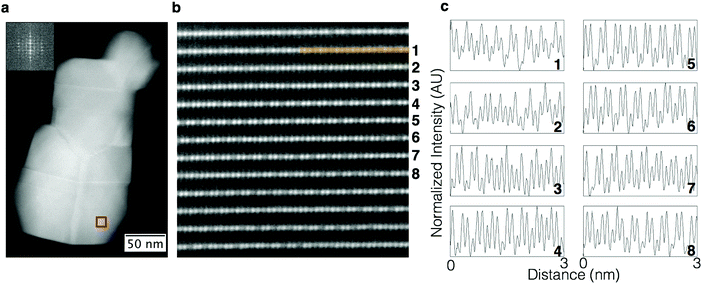
As shown in the HAADF STEM image in Fig. 5b that was taken using the [100]supercell zone axis, the amount of transition metal in the shared column increases as compared to the high Li/TM sample. Therefore, the doublets, although present, are not seen as clearly on the LMR NMC with medium Li/TM ratio. In contrast to the high Li/TM sample, the ratio of Li to TM in this shared column appears random in some of the rows. These effects can be observed more clearly in the line profiles shown in Fig. 5c. It should be noted that the intensity of the columns suggests that there is no mixing between lithium and transition metal in the columns corresponding to the doublets, and that these columns most likely consist of transition metals only. The Fourier transform (FFT) of the image (shown in inset of Fig. 5a) shows the two streaks between the rows of fundamental spots which are characteristic of the structure consisting of three monoclinic domains. The domains corresponding to [100], [1![[1 with combining macron]](https://www.rsc.org/images/entities/char_0031_0304.gif) 0], and [110] can still be identified, although not as clearly as with the LMR NMC with a high Li/TM ratio. This structure was observed over the entire primary particle. It can thus be said that the general structure consists of a (disordered) monoclinic phase, which additionally exhibits local compositional variations. The Li/TM ratio of the shared columns is not constant throughout the particle, resulting in a degree of disorder in the structure. Similar to the high Li/TM ratio LMR NMC, EELS maps taken with sub-nanometer resolution over several areas in different particles showed a relatively uniform distribution of transition metals, except for certain facets as shown in Fig. 6.
0], and [110] can still be identified, although not as clearly as with the LMR NMC with a high Li/TM ratio. This structure was observed over the entire primary particle. It can thus be said that the general structure consists of a (disordered) monoclinic phase, which additionally exhibits local compositional variations. The Li/TM ratio of the shared columns is not constant throughout the particle, resulting in a degree of disorder in the structure. Similar to the high Li/TM ratio LMR NMC, EELS maps taken with sub-nanometer resolution over several areas in different particles showed a relatively uniform distribution of transition metals, except for certain facets as shown in Fig. 6.
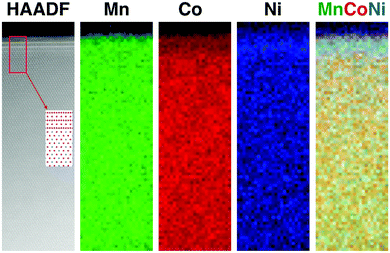 | ||
| Fig. 6 EELS for LMR NMC with medium Li/M ratio: (a) HAADF image and EELS maps showing relatively uniform distribution of transition metals except at certain facets, where high concentration of nickel was observed. HAADF image taken at [001]monoclinic shows surface spinel in [112] zone axis, as previously observed in ref. 6. | ||
2.5 Structure of LMR NMC with low Li/TM ratio
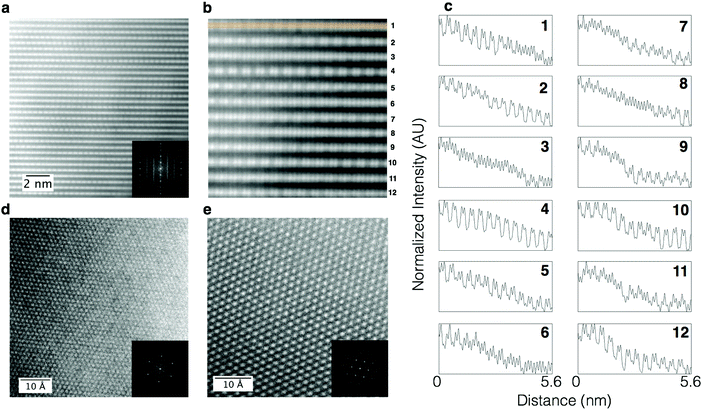
The sample with a low Li/TM ratio was studied in detail using HAADF imaging performed at various zone axes, giving a complete, three-dimensional characterization of its structure. HAADF images of the low Li/TM ratio material taken using [100]supercell zone axis, as shown in Fig. 7a, show a further increase in the randomness of Li/TM ratio in the shared column described in the previous section. This is shown more clearly in the image with higher magnification (Fig. 7b) and the line profiles shown in Fig. 7c that correspond to the rows of atomic columns shown in Fig. 7b. Certain rows show doublets like those observed in the LMR NMC with a high Li/TM ratio (for example, lines 2, 4, 5, 10, and 12), because the Li/TM ratio in the shared column is high. A lower Li/TM ratio in the shared column leads to some rows that do not show the doublet character as clearly, as shown in lines 3, 6, 8, and 11. In many cases, this pattern changes even within the same row, with a few columns showing higher Li/TM ratio in the shared column (giving a doublet character) followed by several columns with lower Li/TM ratio, as shown in rows 1 and 6. The stacking of rows with higher and lower Li/TM ratio appears to have no ordering at the observed length scales. Thus, there is a lack of long range order whereby areas with high Li/TM ratio and those with low Li/TM ratio in the shared column are not extended over several nanometers. It should be noted that this apparent difference in structure, showing discontinuous rows of atomic columns with and without doublets, is simply due to local compositional variation, whereas the symmetry remains the same for both types of regions. Both regions, with or without the appearance of doublets, are monoclinic. Furthermore, although there is a variation of composition at the atomic scale as shown by the HAADF STEM images, the distribution of transition metals in the bulk at the nanometer scale remains uniform, as shown in the EELS maps (Fig. 8), except at certain facets that exhibited higher concentrations of nickel.Recent studies on LMRTMOs have suggested a presence of separate monoclinic and trigonal phases based on observations of elemental segregation, whereby manganese-rich areas are assigned to a monoclinic phase while remaining areas are assigned to a trigonal phase.12,13 It should be noted that although we observe a relatively uniform distribution of transition metals in the bulk of samples for all the compositions investigated in this study, observation of any non-uniformity in elemental composition does not necessarily imply the presence of a two-phase composite structure consisting of separate Li2MnO3 (monoclinic) and LiNiMnCoO2 (trigonal) phases. Moreover, the homogeneity reported here refers to the results obtained from single grains (excluding any surfaces) instead of over secondary particles as described in these reports that either involved grain boundaries between primary particles or nickel-rich surfaces. It has also been shown recently that even particles that appear to be made up of a single grain can, in fact, consist of several grains.14 The origin of the presence of these grains within a primary particle can be attributed to the presence of several equivalent {111} planes in the parent NaCl structure as described in detail by Jarvis et al.15 for Li1+xMnNiO2. The presence of these grains with different orientations and the resulting hidden surfaces within a primary particle further complicates structure determination of LMR NMC. Indeed, high resolution HAADF STEM imaging and spectroscopy results obtained over discrete grains have shown that these elemental segregations are limited to surfaces, in agreement with our results.16 The presence of grain boundaries within a primary particle is more common in LMRTMOs prepared using co-precipitation, a method used more commonly in commercial cathode materials, as compared to those prepared by molten salt method, which mostly results in discrete particles consisting of single grains.6,17
HAADF images taken using the [103]monoclinic zone axis, which is orthogonal to the previously-discussed [100]monoclinic direction, further help in understanding the structure of LMR NMC. A HAADF image taken from a single variant of a LMR NMC with high Li/TM ratio would consist of two rows of atomic columns consisting of transition metals separated by a row of atoms with mixed lithium and transition metals, giving a striped pattern. Three variants that are rotated 120° from each other would give rise to a criss-cross pattern as described in ref. 6. In the case of NMC with pure trigonal structure without any ordering of the transition metals, the intensity of all the columns (in the equivalent [001]trigonal direction) would be equal. In Fig. 7d, which shows the HAADF image taken on LMR NMC with low Li/TM ratio using a [103]monoclinic zone axis, a criss-cross pattern is clearly observed, but the column intensities are not uniform across the field of view, displaying a level of randomness at this length scale. Furthermore, the diffractogram clearly shows extra spots present at 1/3 and 2/3rd distance from the fundamental spot, confirming the presence of all three monoclinic variants. Imaging the sample along the [001]monoclinic direction, on the other hand, gives a HAADF image that apparently looks very uniform as shown in Fig. 7e. This apparent absence of disorder in this projection is observed because the variants of monoclinic are stacked in such a way that columns corresponding to a mixture of transition metals and lithium sit directly above a column consisting purely of transition metals, thus giving an averaged intensity for each column that appears uniform throughout the particle, as one would observe in a [001] direction of a pure trigonal phase, but with a larger column spacing. Faint {110} and {120} reflections can barely be seen in an FFT diffractogram taken from a HAADF image consisting of primarily (or only) one monoclinic variant. However, these reflections can be easily observed using an electron diffraction pattern as shown in Fig. S2b of the ESI,† exemplifying how FFTs do not necessarily provide the same information as that obtained from electron diffraction patterns. These results also highlight the importance of using multiple techniques and zone axes for solving complex structures: while electron diffraction is more ambiguous for the [103]monoclinic direction than HAADF imaging, it can be useful for avoiding ambiguity from HAADF imaging for the [001]monoclinic direction.
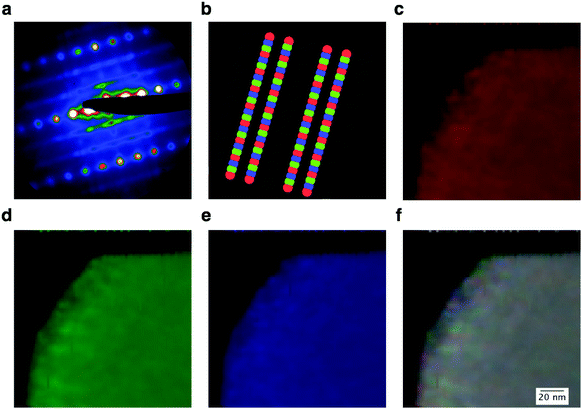
In order to confirm that the structure of LMR NMC with a low Li/TM ratio consists of only the monoclinic structure throughout the primary particle, we performed STEM diffraction imaging experiments, where a 2D image of the diffracted STEM probe was recorded over a 2D grid of probe positions, forming a four-dimensional dataset that we will hereafter refer to as a “4D-STEM experiment”. These 4D-STEM experiments allow diffraction mapping on particles with large fields of view at high spatial resolution.18–20Fig. 9a shows an electron diffraction pattern that was summed using 5625 individual diffraction patterns obtained using a probe size of approximately 2 nm and a step size of 2 nm. The pair of streaks between the rows of the brighter fundamental reflections are observed due to the closeness of diffraction spots corresponding to the [100], [1![[1 with combining macron]](https://www.rsc.org/images/entities/char_0031_0304.gif) 0], and [110] variants of the monoclinic phase, as described in Fig. S3 in ESI.†Fig. 9b shows the virtual apertures used for these three variants. The fundamental reflections, shown in gray, are common for all three variants. As shown in Fig. 9c–e, the individual variants are not resolved as rows of atoms except for thin areas in the edges due to the aforementioned randomness in this structure, unlike in the case of LMR NMC with a high Li/TM ratio shown in a previously published study20 where the variants are clearly resolved using this technique. However, it can be noticed that the intensity from these three monoclinic variants are present roughly equally throughout the crystal. None of the 5625 frames in the dataset exhibited diffraction patterns without the streaks. The experiment was repeated using a step size of 5 nm over the entire primary particle and identical results were obtained, as shown in Fig. S5 in ESI.† These observations show that there are no areas having long-range order with a trigonal structure throughout the crystal (which would give only fundamental reflections without the streaks).
0], and [110] variants of the monoclinic phase, as described in Fig. S3 in ESI.†Fig. 9b shows the virtual apertures used for these three variants. The fundamental reflections, shown in gray, are common for all three variants. As shown in Fig. 9c–e, the individual variants are not resolved as rows of atoms except for thin areas in the edges due to the aforementioned randomness in this structure, unlike in the case of LMR NMC with a high Li/TM ratio shown in a previously published study20 where the variants are clearly resolved using this technique. However, it can be noticed that the intensity from these three monoclinic variants are present roughly equally throughout the crystal. None of the 5625 frames in the dataset exhibited diffraction patterns without the streaks. The experiment was repeated using a step size of 5 nm over the entire primary particle and identical results were obtained, as shown in Fig. S5 in ESI.† These observations show that there are no areas having long-range order with a trigonal structure throughout the crystal (which would give only fundamental reflections without the streaks).
It can be argued, however, that each diffraction pattern in the 4D-STEM dataset is an averaged diffraction pattern taken through the thickness of the sample, and that the presence of any pure trigonal regions in the direction of the electron beam will not be observed in these patterns. To confirm that the entire particles indeed consisted of only the monoclinic phase throughout the particle and that there was no misinterpretation due to the projection problem, we performed 4D-STEM experiments on the same particle using several zone axes and found identical results. Fig. S5 in ESI† shows the results obtained using the [302]monoclinic zone axis. Electron diffraction simulations for the monoclinic phase with a single variant in the [302] direction and a supercell made using three monoclinic variants are shown in Fig. S6 in ESI,† along with an electron diffraction pattern for a trigonal structure in its equivalent direction ([7![[7 with combining macron]](https://www.rsc.org/images/entities/char_0037_0304.gif) 2]). Although the slabs of monoclinic domains would overlap each other in this orientation, the spots corresponding to the monoclinic variants are well-separated and the 4D-STEM diffraction maps show that the entire particle is made up of a single monoclinic phase.
2]). Although the slabs of monoclinic domains would overlap each other in this orientation, the spots corresponding to the monoclinic variants are well-separated and the 4D-STEM diffraction maps show that the entire particle is made up of a single monoclinic phase.
Although it is clear from these results that over the entire composition range studied here LMR NMC is not a “composite” material consisting of “structurally integrated” domains of Li2MnO3 and LiNiMnCoO2 as suggested by earlier reports,1,3,21,22 there is another structural model that also warrants consideration. Extra reflections in electron diffraction patterns of layered oxides, both with stoichiometric (Li = 1) and excess lithium compositions, have been attributed to long-range ordering of the type ( ) R30°.11,23,24 Meng et al.23 proposed that in the case of LiNi0.5Mn0.5O2 and Li1.11Ni0.3Mn0.55O2, there is an in-plane (
 ) R30° ordering of lithium, manganese, and nickel ions such that the overall symmetry of the crystal is P3112 with some C2/m stacking. Yabuuchi et al.11 and Weill et al.24 proposed similar in-plane ordering based on electron diffraction studies for materials containing nickel, manganese, and cobalt. We also considered this possibility for the presence of faint reflections and streaks in electron diffraction patterns, although they can be clearly attributed to the presence of the three monoclinic variants. We found that although the electron diffraction patterns simulated using a unit cell with a superstructure closely match the experimental diffraction patterns for certain zone axes (such as [001]trigonal), the model fails for other zone axes, even high symmetry ones such as [010] and [
![[1 with combining macron]](https://www.rsc.org/images/entities/char_0031_0304.gif) 10] as shown in Fig. S8 in ESI,† which shows electron diffraction patterns simulated using the unit cell described in ref. 11. In fact, in a later publication, Boulineau et al.25 used a model example of monoclinic Li2MnO3 to show how a superstructure was not needed for the interpretation of these extra reflections and how these can be described simply by the stacking of variants of the monoclinic phase, as we suggest here. We agree with this interpretation, and our results show that this is true for LMR NMC over a wide range of compositions. This does not suggest that there is no short-range ordering or clustering, but that the simulations make it clear that the extra reflections and streaks in electron diffraction patterns are formed principally due to the presence of monoclinic variants rather than to long-range (
10] as shown in Fig. S8 in ESI,† which shows electron diffraction patterns simulated using the unit cell described in ref. 11. In fact, in a later publication, Boulineau et al.25 used a model example of monoclinic Li2MnO3 to show how a superstructure was not needed for the interpretation of these extra reflections and how these can be described simply by the stacking of variants of the monoclinic phase, as we suggest here. We agree with this interpretation, and our results show that this is true for LMR NMC over a wide range of compositions. This does not suggest that there is no short-range ordering or clustering, but that the simulations make it clear that the extra reflections and streaks in electron diffraction patterns are formed principally due to the presence of monoclinic variants rather than to long-range ( ) R30° ordering of transition metals. The latter would also lead to extra reflections in the row of fundamental reflections, as shown in Fig. S6, which is clearly not observed in experimental patterns as shown in Fig. S2 in ESI.†
McCalla et al. studied the effect of cooling rate on combinatorial samples prepared for a Li–Co–Mn oxide system.26 Although their system did not contain nickel, some of their findings can be related to the results obtained in the present study. They found that phase separation occurs for layered oxides synthesized using a very slow rate of cooling (∼1 °C min−1), while it does not occur for samples prepared using intermediate cooling rates (∼10 °C min−1), as used in the case of most commercial cathode materials. It was noted that at intermediate cooling rates, the system does not have sufficient time to make larger crystallites for each phase. They also observed that XRD patterns for the samples with compositions between LiCoO2 and Li2MnO3 that showed phase separation exhibited peak splitting, especially at the peaks around 45° and 65° 2θ, a feature that was absent in our XRD patterns. It should be noted that the phase separation for the compositions discussed by McCalla et al. do not refer to a coexistence of LiCoO2 and Li2MnO3 phases.
2.6 Effect of composition on surface structure
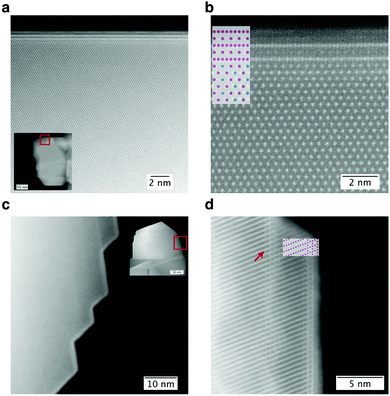
Several studies have shown that the surface of LMR NMC has a different structure and composition than the bulk.27,28 In a recently-published study on LMR NMC with higher Li/TM ratio,6 it was demonstrated that this surface is a spinel (typically nickel- and/or cobalt-enriched, based on the composition) and has an orientation relationship with the bulk given by (001)M‖(1![[1 with combining macron]](https://www.rsc.org/images/entities/char_0031_0304.gif) 1)S, [010]M‖[110]S, where subscripts M and S refer to the monoclinic and spinel phases, respectively. The spinel phase is preferentially formed on {131}monoclinic facets. The results were confirmed in a detailed study by Johnston-Peck et al.7 published recently. In spite of several studies that have discussed the role of phase transformations on the surface of the cathode particles,29–32 the role that this spinel surface layer (vis-à-vis that of the bulk) plays on the electrochemical shortcomings such as poor cycle life, voltage fade, and DC resistance is not yet clearly understood. In order to investigate the influence, if any, of the Li/TM ratio on this surface layer and ultimately on the electrochemical performance of the cathode material, we studied the surface of the LMR NMC with the aforementioned compositions using HAADF STEM imaging, 4D-STEM, EELS, and XEDS. We found that the Li/TM ratio hardly had any effect on the thickness, structure, or composition of this surface layer. All of the LMR NMC samples, irrespective of the composition, exhibited a spinel layer. EELS and XEDS experiments suggested that the spinel surfaces exhibited a higher concentration of nickel (and some cobalt) at the expense of a lower content of manganese at the surface as shown in Fig. 4, 6, 8 and Fig. S8 in ESI.† We note that the exact composition of this thin layer of spinel might be affected by the bulk composition. Fig. 10 shows this spinel layer at higher resolution. Fig. 10a and b show HAADF images taken on LMR NMC with medium Li/TM ratio using the [103]monoclinic zone axis, where an approximately 2 nm thick spinel surface layer having a [112] zone axis is clearly visible. Similarly, Fig. 10c and d show a [110]spinel surface on LMR NMC with the lowest Li/TM ratio in [010] zone axis.
1)S, [010]M‖[110]S, where subscripts M and S refer to the monoclinic and spinel phases, respectively. The spinel phase is preferentially formed on {131}monoclinic facets. The results were confirmed in a detailed study by Johnston-Peck et al.7 published recently. In spite of several studies that have discussed the role of phase transformations on the surface of the cathode particles,29–32 the role that this spinel surface layer (vis-à-vis that of the bulk) plays on the electrochemical shortcomings such as poor cycle life, voltage fade, and DC resistance is not yet clearly understood. In order to investigate the influence, if any, of the Li/TM ratio on this surface layer and ultimately on the electrochemical performance of the cathode material, we studied the surface of the LMR NMC with the aforementioned compositions using HAADF STEM imaging, 4D-STEM, EELS, and XEDS. We found that the Li/TM ratio hardly had any effect on the thickness, structure, or composition of this surface layer. All of the LMR NMC samples, irrespective of the composition, exhibited a spinel layer. EELS and XEDS experiments suggested that the spinel surfaces exhibited a higher concentration of nickel (and some cobalt) at the expense of a lower content of manganese at the surface as shown in Fig. 4, 6, 8 and Fig. S8 in ESI.† We note that the exact composition of this thin layer of spinel might be affected by the bulk composition. Fig. 10 shows this spinel layer at higher resolution. Fig. 10a and b show HAADF images taken on LMR NMC with medium Li/TM ratio using the [103]monoclinic zone axis, where an approximately 2 nm thick spinel surface layer having a [112] zone axis is clearly visible. Similarly, Fig. 10c and d show a [110]spinel surface on LMR NMC with the lowest Li/TM ratio in [010] zone axis.
As discussed earlier, the non-uniformity of transition metal distribution reported in recent studies on samples with multiple grains can be attributed to the presence of grain boundaries and surfaces that are richer in nickel and cobalt. Fig. 10d demonstrates how these non-uniformities can be observed even in the case of a single grain. It is well-known that crystals often contain growth ledges,33 such as one shown using a red arrow in Fig. 10d, which shows a hidden surface layer containing the spinel structure. Since the spinel surface is rich in nickel, an XEDS map taken in projection would show an area with relatively higher manganese content sandwiched between areas with relatively higher nickel content.
For comparison, we also studied the surface of a “stoichiometric” NMC with a nominal composition of LiNi1/3Mn1/3Co1/3O2 and found that the sample also exhibited a spinel surface with the same orientation relationship with the bulk as observed with the LMR NMCs studied in this work. The fact that the thickness, relative composition, and orientation relationship with the bulk does not change with different Li/TM ratios suggests that the formation of this spinel layer is common for a wide variety of layered oxides. The materials in this study were prepared using a co-precipitation method described in the Methods section, but similar results have been shown in LMR NMC made with other synthesis techniques such as the molten salt method.6,17 These studies suggest that the spinel, which most likely forms during the synthesis process, is a common occurrence in a wide range of layered oxides, including both lithium-rich and stoichiometric compositions. The spinel forms only on the unstable facet (which is also the facet corresponding to the path of lithium diffusion) and a few unit cells of spinel act as a stabilizing layer. The surface of this spinel layer has a {111} facet, which is known to be a very stable surface.34 It is not clear if this spinel layer facilitates the diffusion of lithium or hinders it, but the fact that pristine samples (prior to electrochemical testing) did not exhibit any change in the spinel when varying the composition suggests that the changes in electrochemical performance (reduced voltage fade, capacity fade, and DC resistance) are most likely due to the changes in the bulk structure of LMR NMC rather than to effects related to this surface layer.
We would like to emphasize that use of high spatial resolution, electron probe-based imaging and spectroscopy was essential in revealing the formation of surface spinel structure on specific crystallographic planes. Techniques such as X-ray photoelectron spectroscopy (XPS) and X-ray absorption spectroscopy (XAS), although being surface-sensitive can only provide information averaged over all the facets of the particles and therefore do not provide a complete or accurate description of the surface structure and composition.
3 Conclusion
In summary, the present study is the first in demonstrating that even small amounts of excess lithium (or Li/TM ratio > 1) in LMR NMC materials result in a material consisting solely of a monoclinic phase rather than one with the parent trigonal structure of LiMO2, which is often assumed for layered oxides. While decreasing the lithium content resulted in a significant change in terms of order and atomic-level local composition in the bulk of LMR NMC primary particles, no noticeable change in structure or thickness was observed for the surface spinel layer that was consistently observed on specific facets of these materials. The surface spinel exhibited a higher concentration of nickel and cobalt compared to that in the bulk, across the composition range studied. In the bulk, although the structure across the different compositions consists of an aperiodic arrangement of monoclinic variants, there is an obvious decrease in order as we decrease the Li/TM ratio. The transition metal layer in LMR NMC, when examined along the [100] direction, consists of pairs of columns of transition metals separated by a mixed-content column consisting of both lithium and transition metals. The ratio of Li/TM in this shared column is more or less uniform in LMR NMC with more excess lithium and it becomes random at lower amounts of excess lithium. We did not find regions with pure trigonal (LiMO2) or pure monoclinic phase consisting of manganese only as the transition metal (Li2MnO3). This observation is particularly relevant in the context of a drive towards higher-performance battery cathodes, because it is a common practice to use extra lithium during the synthesis of stoichiometric lithium transition metal oxides in order to compensate for the loss of lithium during synthesis, and it is difficult to accurately confirm an exact stoichiometric composition (Li/TM ratio = 1) in these materials even with well-established techniques such as inductively coupled plasma optical emission spectroscopy.These structural observations are all the more important now that we have also demonstrated, in the case of compositions with lower Li/TM ratio, a significant improvement in electrochemical performance, especially with respect to voltage fade and DC resistance, albeit at the cost of some decrease in capacity. The fact that the characteristics of the surface do not significantly change with changes in composition suggests that the transformation in the bulk of the cathode material might play a larger role in the manifestation of issues such as capacity fade, voltage fade, and DC resistance. While there have been very detailed and systematic studies on the effect of cycling on phase transformation at the surface of layered oxides,29,30 it is often assumed in these studies that the surface has the same crystal structure as that of the bulk. The demonstration of the presence of a surface spinel layer on layered oxides with a wide range of compositions in this study therefore warrants a closer and detailed examination of as-synthesized samples before studying any phase transformation that may occur upon cycling.
4 Methods
Materials synthesis
The lithium-rich NMC materials were synthesized by co-precipitation reaction.35,36 Stoichiometric amounts of metal sulfates were slowly dripped using a peristatic pump into a continuously stirred tank reactor (10L CSTR), wherein sodium carbonate and ammonium hydroxide were also added using a peristatic pump. The pH of the reaction was maintained at approximately 7.5 and the reaction temperature was maintained at 50 °C while the agitation was maintained at 500 rpm in order enable a complete precipitation with a well-defined particle morphology. The metal carbonate precursor was then mixed appropriately with lithium carbonate and calcined at 550 °C for 10 h and 850 deg. C for 20 h.Electrode preparation and electrochemical measurements
For coin cell testing, composite electrodes were prepared with 80% by weight of active material, 10% by weight of polyvinylidene fluoride binder (Kureha, Japan), 5% by weight of Super P carbon black (Timcal, Belgium), and 5% by weight of KS6 graphite (Timcal, Belgium) with 1-methyl-2-pyrrolidinone (Sigma Aldrich, USA) as the solvent. The slurry was coated onto aluminum foil (Tokai, Japan (20 μm thick)) then dried in a vacuum at 120 °C for 2 hours. Celgard 2320 separator and a 1.2 M LiPF6 electrolyte solution in ethylene carbonate/dimethyl carbonate (BASF, USA) were used in the coin cells with lithium metal as the negative electrode. The diameter of cathode used in this study is 14 mm and the loading is 8–10 mg cm−2 for half cells (vs. Li, 150 μm, FMC, USA). The coin cells were tested at different discharge currents corresponding to two cycles each at C/10, C/5, C/3, 1C, and 2C, and then cycled at a C/3 rate for 50 cycles. The half cells were charged to 4.6 V in the first C/10 cycle, then subsequently cycled between 2.0 V and 4.5 V vs. Li/Li+ for all remaining cycles.Electron microscopy
All the samples were studied using either a probe-corrected microscope operating at 100 kV accelerating voltage using a convergence angle of approximately 30 mrad and a collection angle for HAADF images that was calibrated at 82–190 mrad (SuperSTEM 2) or a probe-corrected microscope operating at 80 kV accelerating voltage using a convergence angle of approximately 30 mrad and a collection angle for HAADF images of 60–180 mrad (TEAM 0.5). It should be noted that LMRTMO, and particularly the spinel surface, is easily damaged under the electron beam. Depending on the imaging conditions, damage ranging from anti-site defect formation (lithium in tetragonal site replaced by transition metal), change in structure (likely to a rock-salt structure) or complete loss of material due to surface sputtering can be observed when the surface is exposed for a longer period. A HAADF image showing different modes of damage by parking the beam at the surface is shown in Fig. S9 (ESI†). To avoid the beam damage and to record the spinel surface before the damage, we used a different area on the particle for tilting and recorded a time series of low exposure scans that were drift corrected and averaged, rather than single slow scans. Damage on the top most layer, however was unavoidable due to some focusing required at the region of interest as evident in Fig. 10. XEDS maps with sub-nanometer resolution were obtained at 120 kV accelerating voltage using an FEI Titan microscope equipped with a quad-detector system. 4D-STEM maps (electron diffraction maps) with resolution ranging from 2 to 5 nm were obtained at 120 kV accelerating voltage using a Digital Micrograph script as described in ref. 19. Samples for electron microscopy were prepared by drop casting a sonicated solution of LMRTMOs and anhydrous ethanol. HAADF STEM simulations were performed using a custom code that was prepared using details provided in ref. 37 and compared with experimental images. More than a dozen primary particles were studied for each composition using various zone axes.Other material characterization
Powder X-ray diffraction (XRD) was carried out with a Rigaku Ultima IV X-Ray Diffractometer using Cu-K-alpha radiation. Elemental analysis was carried out using a Varian 715-ES inductively-coupled plasma optical emission spectrometer (ICP-OES), which determined the molar ratios of lithium, nickel, cobalt, and manganese present in each cathode material. Three runs were conducted for each sample using sample mass of 500 mg. Scanning electron microscopy (SEM) using a Hitachi S4800 was used to assess the quality of samples prepared for the transmission electron microscopy (TEM) grid.Conflicts of interest
There are no conflicts to declare.Acknowledgements
This work was supported by the Assistant Secretary for Energy Efficiency and Renewable Energy, Office of Vehicle Technologies of the U.S. Department of Energy under Contract No. DE-EE0006443 under the Applied Battery Research (ABR) program. We also acknowledge financial support from Envia Systems and US Department of Energy's Small Business Voucher Pilot program. Work at the Molecular Foundry was supported by the Office of Science, Office of Basic Energy Sciences, of the U.S. Department of Energy under Contract No. DE-AC02-05CH11231. The authors also acknowledge support SuperSTEM, Daresbury, UK, which is the National Facility for Aberration-Corrected Scanning Transmission Electron Microscopy, supported by the Engineering and Physical Science Research Council. The authors would like to thank Dr Robert Kostecki, Dr Sujeet Kumar, Dr Herman Lopez, Dr Saravanan Kuppan, Prof. Gerbrand Ceder and Dr Ulrich Dahmen for the useful discussions. The authors would also like to thank Mr Chengyu Song, Dr Karen Bustillo and Dr Peter Ercius for their assistance in operating the microscopes at the National Center of Electron Microscopy, Molecular Foundry. The authors thank Dr Sumanjeet Kaur and Dr Frank Ogletree for their assistance with X-ray photoelectron spectroscopy experiments.References
- M. M. Thackeray, C. S. Johnson, J. T. Vaughey, N. Li and S. A. Hackney, J. Mater. Chem., 2005, 15, 2257–2267 RSC
.
- Z. Lu and J. R. Dahn, J. Electrochem. Soc., 2002, 149, A815–A822 CrossRef CAS
.
- J. R. Croy, S. H. Kang, M. Balasubramanian and M. M. Thackeray, Electrochem. Commun., 2011, 13, 1063–1066 CrossRef CAS
.
- S.-H. Kang and M. M. Thackeray, Electrochem. Commun., 2009, 11, 748–751 CrossRef CAS
.
- K. A. Jarvis, Z. Deng, L. F. Allard, A. Manthiram and P. J. Ferreira, Chem. Mater., 2011, 23, 3614–3621 CrossRef CAS
.
- A. K. Shukla, Q. M. Ramasse, C. Ophus, H. Duncan, F. Hage and G. Chen, Nat. Commun., 2015, 6, 8711 CrossRef CAS PubMed
.
- A. C. Johnston-Peck, I. Levin, A. A. Herzing and L. A. Bendersky, Mater. Charact., 2016, 119, 120–128 CrossRef CAS PubMed
.
- K. Jarvis, Z. Deng and A. Manthiram, Microsc. Microanal., 2012, 18, 1484–1485 CrossRef
.
- C.-C. Wang, K. A. Jarvis, P. J. Ferreira and A. Manthiram, Chem. Mater., 2013, 25, 3267–3275 CrossRef CAS
.
- D. Mohanty, A. Huq, E. A. Payzant, A. S. Sefat, J. Li, D. P. Abraham, D. L. Wood, III and C. Daniel, Chem. Mater., 2013, 25, 4064–4070 CrossRef CAS
.
- N. Yabuuchi, Y. Koyama, N. Nakayama and T. Ohzuku, J. Electrochem. Soc., 2005, 52, A1434–A1440 CrossRef
.
- M. Gu, A. Genc, I. Belharouak and D. Wang, Chem. Mater., 2013, 25, 23192326 Search PubMed
.
- A. Devaraj, M. Gu, R. Colby, P. Yan and C. M. Wang, Nat. Commun., 2015, 6, 8014 CrossRef CAS PubMed
.
- H. Yu, Y. G. So, A. Kuwabara, E. Tochigi and N. Shibata, Nano Lett., 2016, 16, 2907–2915 CrossRef CAS PubMed
.
- K. A. Jarvis, C.-C. Wang, A. Manthiram and P. J. Ferreira, J. Mater. Chem. A, 2014, 2, 1353–1362 CAS
.
- P. Yan, J. Zheng, J. Zheng, Z. Wang, G. Teng, S. Kuppan, J. Xiao, G. Chen, F. Pan, J.-G. Zhang and C. M. Wang, Adv. Energy Mater., 2016, 1502455 CrossRef
.
- S. Kuppan, A. K. Shukla, D. Membreno, D. Nordlund and G. Chen, Adv. Energy Mater., 2017, 17, 1602010 CrossRef
.
- C. Ophus, P. Ercius, M. Sarahan, C. Czarnik and J. Ciston, Microsc. Microanal., 2014, 20, 62–63 CrossRef
.
- C. Gammer, V. B. Özdöl, C. H. Liebscher and A. M. Minor, Ultramicroscopy, 2015, 155, 1–10 CrossRef CAS PubMed
.
- A. K. Shukla, C. Ophus, C. Gammer and Q. M. Ramasse, Microsc. Microanal., 2016, 22, 494–495 CrossRef
.
- M. M. Thackeray, S.-H. Kang, C. S. Johnson, J. T. Vaughey, R. Benedek and S. A. Hackney, J. Mater. Chem., 2007, 17, 3112–3125 RSC
.
- M. M. Thackeray, S. H. Kang, C. S. Johnson, J. T. Vaughey and S. A. Hackney, Electrochem. Commun., 2006, 8, 1531–1538 CrossRef CAS
.
- Y. S. Meng, G. Ceder, C. P. Grey, W. S. Yoon, M. Jiang, J. Bréger and Y. Shao-Horn, Chem. Mater., 2005, 17, 2386–2394 CrossRef CAS
.
- F. Weill, N. Tran, L. Croguennec and C. Delmas, J. Power Sources, 2007, 172, 893–900 CrossRef CAS
.
- A. Boulineau, L. Croguennec, C. Delmas and F. Weill, Chem. Mater., 2009, 21, 4216–4222 CrossRef CAS
.
- E. McCalla, C. M. Lowartz, C. R. Brown and J. R. Dahn, Chem. Mater., 2013, 25, 912–918 CrossRef CAS
.
- H. Dixit, W. Zhou, J.-C. Idrobo, J. Nanda and V. R. Cooper, ACS Nano, 2014, 8, 12710–12716 CrossRef CAS PubMed
.
- M. Gu, I. Belharouak, A. Genc, Z. Wang, D. Wang, K. Amine, F. Gao, G. Zhou, S. Thevuthasan and D. R. Baer, Nano Lett., 2012, 12, 5186–5191 CrossRef CAS PubMed
.
- F. Lin, I. M. Markus, D. Nordlund and T. C. Weng, Nat. Commun., 2014, 5, 3529 Search PubMed
.
- H. Liu, M. Bugnet, M. Z. Tessaro, K. J. Harris, M. J. R. Dunham, M. Jiang, G. R. Goward and G. A. Botton, Phys. Chem. Chem. Phys., 2016, 18, 29064–29075 RSC
.
- P. Yan, A. Nie, J. Zheng, Y. Zhou, D. Lu, X. Zhang, R. Xu, I. Belharouak, X. Zu, J. Xiao, K. Amine, J. Liu, F. Gao, R. Shahbazian-Yassar, J.-G. Zhang and C. M. Wang, Nano Lett., 2014, 15, 514–522 CrossRef PubMed
.
- F. Yang, Y. Liu, S. K. Martha, Z. Wu, J. C. Andrews, G. E. Ice, P. Pianetta and J. Nanda, Nano Lett., 2014, 14, 4334–4341 CrossRef CAS PubMed
.
-
D. A. Porter and K. E. Easterling, Phase Transformation in Metals and Alloys, Chapman & Hall, 2nd edn, 1992 Search PubMed
.
- A. Karim, S. Fosse and K. A. Persson, Phys. Rev. B: Condens. Matter Mater. Phys., 2013, 87, 075322 CrossRef
.
- M. H. Lee, Y. J. Kang, S. T. Myung and Y. K. Sun, Electrochim. Acta, 2004, 50, 939–948 CrossRef CAS
.
- M. H. Lee, Y. J. Kang, S. T. Myung and Y. K. Sun, Electrochim. Acta, 2004, 939–948 CrossRef CAS
.
-
E. J. Kirkland, Advanced Computing in Electron Microscopy, Springer US, Boston, MA, 2010 Search PubMed
.
Footnote |
| † Electronic supplementary information (ESI) available. See DOI: 10.1039/c7ee02443f |
| This journal is © The Royal Society of Chemistry 2018 |

