DOI:
10.1039/C7DT03992A
(Paper)
Dalton Trans., 2018,
47, 1614-1623
Two polymorphic Co(II) field-induced single-ion magnets with enormous angular distortion from the ideal octahedron†
Received
24th October 2017
, Accepted 21st December 2017
First published on 21st December 2017
Abstract
A mononuclear complex [Co(neo)(PhCOO)2,], neo = neocuproine, PhCOO− = the benzoate anion, was prepared in two polymorph forms crystallizing in the C2/c, (1) and P21/c, (2) space groups. The polymorphs differ in the Co–O bond lengths and the level of trigonal distortion of their coordination polyhedra. The static and dynamic magnetic properties of these compounds were thoroughly studied by experimental (magnetometry) and theoretical (ab initio calculations) methods. The analysis of magnetic data was performed using the spin Hamiltonian formalism or the L–S model considering also the orbital angular momentum. It was revealed that both polymorphs possess a very large magnetic anisotropy with a pronounced rhombic character leading to the separation of the Kramers doublets larger than 120 cm−1. The measurements of alternating current susceptibility revealed that both polymorphs behave as field induced single molecule magnets with a small barrier of spin reversal (U = 22.1 K (for 1) and 17.1 K (for 2)) which indicates that relaxation processes other than the thermally activated Orbach process take place.
Introduction
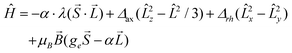
CoII coordination compounds often exhibit the slow-relaxation of magnetization1 of a purely molecular origin.2 This phenomenon is characteristic for the group of so-called single-molecule magnets (SMMs), or more specifically single-ion magnets (SIMs, if the compound involves only one paramagnetic centre).3 The slow-relaxation of magnetisation occurs in SMMs due to the existence of an energy barrier acting against spin reversal, the so-called spin reversal barrier (U). The height of the barrier is closely related to magnetic anisotropy, while it is given by U = |D| × S2 for an integer S and U = |D| × (S2 − 1/4) for a half-integer S, where S denotes the spin of the molecule and D is the axial parameter of magnetic anisotropy which is supposed to be negative. The coordination geometry, spin–spin and spin–orbit interactions induce the zero-field splitting (ZFS) of atomic terms which manifests itself as splitting of the ground state (at symmetry lower than cubic and S > 1/2) to the sublevels in zero magnetic field and represent the origin of the magnetic anisotropy.4 In CoII coordination compounds, the ground state splits to the Kramers doublets |3/2, ± 3/2〉 and |3/2, ± 1/2〉 and the order of these states defines the sign of the D parameter: if the ground state is |3/2, ± 3/2〉, then D < 0 and magnetic anisotropy is axial (easy axis) and if the ground state is |3/2, ± 1/2〉, then the magnetic anisotropy is easy-plane with D > 0. Furthermore, these spin state wave functions could be mixed due to the rhombicity of magnetic anisotropy which is quantified by the parameter E. Then, the spin Hamiltonian (valid for E/D from 0 to 1/3) of the spin system reads:| | | Ĥ = D(Ŝz2 − Ŝ2/3) + E(Ŝx2 − Ŝy2) | (1) |
It must be stressed that rhombicity of anisotropy is considered as a main reason for the occurrence of the quantum tunnelling which effectively decreases U.5 On the other hand, large E (E/D ≈ 1/3) leads eventually to the axial type of the magnetic anisotropy even in the systems with D > 0.6
Since the discovery of SMMs, the field has undergone a rapid development in the experimental and theoretical investigations of magnetic properties of 3d and 4f/5f coordination compounds. Impressive results have been reported especially for SIMs containing Kramers ions such as DyIII and CoII as paramagnetic centres. The DyIII complexes often exhibit very large axial anisotropy, zero-field slow-relaxation of magnetization and for certain coordination geometries also very large U exceeding 1000 K.7 Spin–orbit coupling in the CoII compounds is significantly weaker than that in DyIII compounds due to the ca. three times weaker spin–orbit coupling constant ξ.8 Nevertheless, the CoII compounds are interesting due to the well explored possibility of the magnetic anisotropy fine tuning by modification of the strength and symmetry of the crystal field. Furthermore, the theoretical analysis of magnetic behaviour is often easier than that in the case of the DyIII compounds, because the spin Hamiltonian is usually applicable. The reports on the zero-field CoII SIMs (ZF-SIMs) are scarce and in most of the cases they are tetra-, penta- or hexacoordinate.9 Hexacoordinate zero-field SIMs are represented solely by compounds with trigonal distortion from the ideal octahedral geometry. This type of the distortion leads to the orbitally degenerate ground state (4E) and thus to unquenched spin–orbit coupling causing large magnetic anisotropy and U. For example, the analysis of static magnetic data for (HNEt3)[CoIICoIII3(LA)6], where H2LA = R-4-bromo-2-((2-hydroxy-1-phenylethylimino)methyl)phenol, revealed very large and negative D (−115 cm−1) with small rhombicity (E/D = 0.02), and rather large U (75.8 cm−1).10 Other examples involving hexacoordinate compounds with strong trigonal distortion include a group of CoII compounds with the clathrochelate-type of ligands (ZF-SIMs, U = 100–190 cm−1),11 a triaminocyclohexane-derived ditopic ligand (ZF-SIM, U = 52.3 cm−1),12 tris(pyrazol-1-yl)methane ligands (U = 30–45 cm−1) and sulfadiazine ligands (U = 35.2 cm−1).
Polymorphism might play a significant role in the modulation of properties of magnetically bistable materials as was previously demonstrated for compounds exhibiting the spin crossover phenomenon.13 The influence of polymorphism on slow-relaxation of magnetization has not been intensively studied yet; however, the following CoII examples might be mentioned. Both polymorphs (α and β) of [Co(3,5-dnb)2(py)2(H2O)2] complex possess large positive D (derived from magnetometry: α-[Co(3,5-dnb)2(py)2(H2O)2], D = +58 cm−1; β-[Co(3,5-dnb)2(py)2(H2O)2], D = +68 cm−1, E/D = 0.22) and they exhibit field-assisted slow-relaxation of magnetization based on the direct and Raman relaxation processes.14 Other examples involve two polymorphs (α-[Co(C16–L6)]Cl and β-[Co(C16–L6)]Cl, where C16–L6− is the hexadecylboron-tris-pyrazoloximate anion) which were prepared using different crystallization solvents and they differ structurally only by conformation of the peripheral hexadecylboron moiety.11b Despite only tiny structural distinctions between the polymorphs, the difference in the height of U is striking: 180 cm−1 (α-Co) and 109 cm−1 (β-Co).
In light of the aforementioned results, we have focused our attention on finding CoII complexes with large and possibly trigonal distortions from the ideal octahedral geometry. The coordination geometry in the heteroleptic [Co(LN)(RCOO)2] complexes (LN stands for a bidentate electroneutral N-donor ligand, while RCOO− represents the carboxylato ligands) is strongly influenced by the acute bite angles of the LN and η2 coordinating carboxylato ligands. Therefore, in some cases, the topology of their coordination polyhedra resembles the propeller-like complexes with the D3 symmetry. Due to this apparent trigonal distortion, we decided to investigate the static and dynamic magnetic properties of this group of compounds thoroughly. As the first examples, herein we report on the synthesis, crystal structure and magnetic properties of two polymorphs of the [Co(neo)(PhCOO)2] compound (neo stands for neocuproine). Furthermore, we report on the crystal structure of the Zn compound [Zn(neo)(PhCOO)2], which is not isostructural to any of the cobalt polymorphs and this is the reason why we did not succeed in the preparation of the Zn-diluted compounds for an advanced study of the relaxation processes.
Results and discussion
Synthesis and crystal structure
The synthesis and crystal structure of α-[Co(neo)(PhCOO)2], (1), was firstly reported by Zhao et al. in 2008.15 The compound was prepared by mixing of a water solution of Co(NO3)2·6H2O and sodium benzoate (PhCOONa) with an ethanol solution of neocuproine. The resulting solution was refluxed for 4 hours. We have found out that if only 10 min reflux is applied, then the polymorph β-[Co(neo)(PhCOO)2], (2) is prepared. In an attempt to synthesise analogues of 1 and 2 as zinc diluted compounds, we performed various syntheses (adopting both aforementioned synthetic protocols) with two Zn![[thin space (1/6-em)]](https://www.rsc.org/images/entities/char_2009.gif) :Co ratios (9:1, 1:1) and using different Zn salts (Zn(NO3)2·6H2O and ZnSO4·7H2O), but we always ended up with the preparation of the heterogeneous mixtures of the Co and Zn compounds in which [Zn(neo)(PhCOO)2], (3), slightly structurally differs from 1 and 2 (vide infra).
:Co ratios (9:1, 1:1) and using different Zn salts (Zn(NO3)2·6H2O and ZnSO4·7H2O), but we always ended up with the preparation of the heterogeneous mixtures of the Co and Zn compounds in which [Zn(neo)(PhCOO)2], (3), slightly structurally differs from 1 and 2 (vide infra).
Both polymorphs crystallize in the monoclinic crystal system, but the space groups differ: C2/c in 1, P21/n in 2 (see ESI, Table S1†). The crystal structure of 1 was described in the original paper briefly,15 herein, we add a more detailed discussion of the features potentially important for the magnetic behaviour and for the comparative purposes.
The molecular structures of 1 and 2 consist of the neocuproine and benzoato ligands coordinated to the cobalt centre with a slightly different organization of the donor atoms around the CoII atom. In 1, the CoII atom is located on a twofold rotation axis going directly through the middle of the neocuproine ligands, which makes only a half of the molecule to be crystallographically independent (Fig. 1). Thus, the symmetry of the coordination polyhedron in 1 is C2. In 2, the positions of the ligands in the molecule are not symmetry related. In both compounds the neo ligand coordinates the CoII atom in the same bidentate way adopting very similar Co–N bond lengths (2.10–2.11 Å, Fig. 1) and bite angles (79.7° in 1 and 79.5° in 2). The difference between the coordination geometry of 1 and 2 is the most obvious when the coordination of the benzoato ligands is compared. In 1, as it was mentioned above, both ligands are symmetry related and coordinated in a η2 fashion forming very similar Co–O bond lengths (2.155 and 2.159 Å) and the acute bite angle (59.9°). In 2, the benzoato ligands are coordinated also in a η2 fashion with the acute bite angles (59.8° and 60.7°), but the Co–O distances significantly differ from each other: 2.085(2) and 2.215(2) Å; 2.048(2) and 2.314(2) Å (Fig. 1). Due to these bond length inequalities the best way to classify the geometry of the coordination polyhedron in 2 is to use SHAPE 2.1 software developed by Alvarez et al.16 The results of the calculations showed that the lowest deviations in both cases were found for a regular octahedron and the second lowest for a trigonal prism shape (see ESI, Table S2†). Furthermore, it has to be noted that the deviations from the regular octahedron are rather similar for both compounds (6.83 vs. 6.43), but the trigonal distortion is more pronounced in 2 (12.25 vs. 10.69, the deviations from trigonal prism). The fact that the coordination geometries in 1 and 2 were classified to be the closest to the regular octahedron geometry, together with the apparent angular distortion presented in both compounds, inspired us to determine the actual measure of this distortion by employing the angular distortion parameter Σ, which is calculated as a deviation of the cis-angles from the ideal value (90°).17 The calculated value of the Σ parameter confirms enormous angular distortion in both compounds (in °): Σ(1) = 175.3, Σ(2) = 159.7. The smaller value of Σ in 2 is in agreement with the results of the SHAPE analysis, which determined that the coordination geometry of 2 is less distorted from regular octahedron than that in 1.
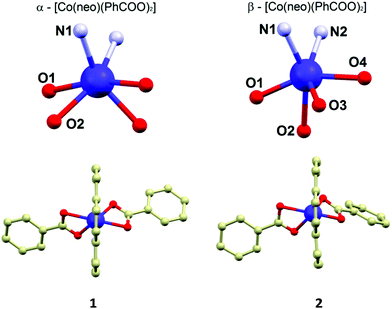 |
| | Fig. 1 Molecular structures of 1 (left below) and 2 (right below). The geometry of the coordination polyhedra of 1 (left above) and 2 (right above) with the labelling of the donor atoms. Hydrogen atoms were omitted for clarity. Selected bond lengths (in Å): in 1, Co1–N1 = 2.113(2), Co1–O1 = 2.155(2), Co1–O2 = 2.159(3); in 2, Co1–N1 = 2.116(2), Co1–N2 = 2.097(2), Co1–O1 = 2.048(2), Co1–O2 = 2.314(2), Co1–O3 = 2.085(2), Co1–O4 = 2.215(2). | |
The crystal structure of 1 is composed of the α-[Co(neo)(PhCOO)2] molecules held together by the weak non-covalent interactions of the C–H⋯O, C–H⋯π and π⋯π types. The main supramolecular motif is composed of the complex molecules assembled into a 1D chain structure by π–π interactions of the coordinated neo ligands (the shortest C⋯C distance is 3.411(2) Å) of the adjacent molecules. The shortest Co⋯Co separation (d = 8.31 Å) in the crystal structure of 1 is observed for the in-chain aligned CoII molecules.
The crystal structure of 2 is composed of the β-[Co(neo)(PhCOO)2] molecules connected together by the C–H⋯O, C–H⋯π and π⋯π non-covalent interactions. The main supramolecular motif is represented by the centrosymmetric dimer held by the face-to-face interactions of the neo rings of the neighbouring complex molecules and C–H⋯O hydrogen bond (both interactions are displayed as (i) in Fig. 2) The shortest C⋯C separation is 3.372(3) Å and the C⋯O distance is 3.248(3) Å. The Co⋯Co separation within the supramolecular dimer is 8.5277(8) Å. The supramolecular dimer is expanded to both sides by the further face-to-face π⋯π interactions of the neo rings with the benzoate ring (the shortest C⋯C separation of 3.330(4) Å, displayed as (ii) in Fig. 2 left) from the adjacent complex molecule (the Co⋯Co separation of 8.2383(6) Å). This assembly is supported also by the C–H⋯O hydrogen bond (d(C⋯O) = 3.313(3) Å, (iii) in Fig. 2 left). The motif is completed by the edge-to-face interactions of the benzoate ring ((iv) and (v) in Fig. 2 left).
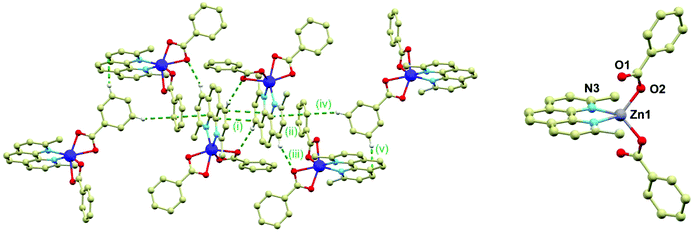 |
| | Fig. 2 Left: A perspective view on the centrosymmetric crystal packing motif in 2. The non-covalent interactions are displayed as green dashed lines and they are labelled as explained in the text of the article. Right: Molecular structure of 3. Selected bond lengths (in Å): Zn–N3 = 2.073(6), Zn1–O1 = 2.701(7), Zn1–O2 = 1.942(7). | |
The crystal structure of the ZnII compound (3) is composed of the [Zn(neo)(PhCOO)2] molecules and it is analogous to 1 to some extent, while it crystallizes in the monoclinic C2/c space group with very similar unit cell parameters (Table S1 in ESI†). Also in 3, the metal centre is located on a twofold rotation axis and therefore only a half of the complex molecule is in the asymmetric unit. However, there is a significant difference between the molecular structures of 1 and 3; the Zn–O bonds adopt significantly different lengths than the Co–O bonds in 1: 1.942(7) and 2.701(7) Å thus making the Zn centre formally tetracoordinate (Fig. 2 right). This striking difference is most probably the reason why the attempts to dilute compounds 1 and 2 with the ZnII atoms failed.
Magnetism and ab initio calculations
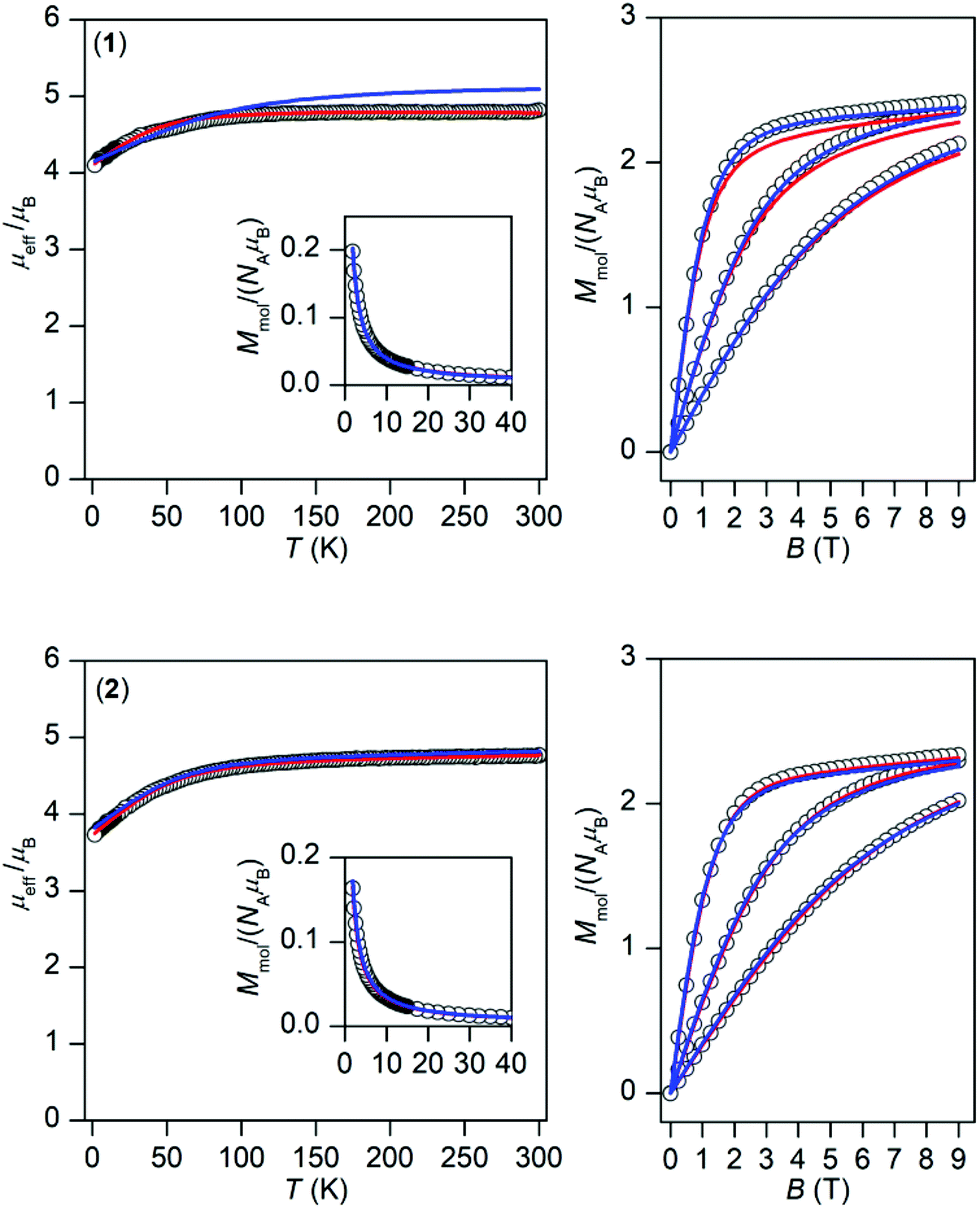
The temperature and field dependent experimental magnetic data of 1 and 2 are depicted in Fig. 3. The effective magnetic moments at room temperature are 4.8μB for 1 and 4.8μB for 2 and upon lowering the temperature they decrease to the values 4.1μB, and 3.7μB, respectively. This is most probably caused by the depopulation of Kramers doublets resulting from 3d7 electronic configuration and usually the splitting of these energy levels is described by the zero-field splitting formalism resulting in magnetic anisotropy. The large magnetic anisotropy is also evidenced by the isothermal magnetizations, which significantly deviate from Brillouin function, and their maximal values for the highest magnetic field are substantially below the theoretical limit defined as Mmol/NAμB → gS.
 |
| | Fig. 3 Magnetic data for 1 (top) and 2 (bottom). Left: Temperature dependence of the effective magnetic moment and molar magnetization measured at B = 0.1 T. Right: Isothermal magnetizations measured at T = 2, 5, and 10 K. The empty circles represent the experimental data, red full lines represent the fitted data using eqn (2) for 1 with α = 1.50, λ = −102 cm−1, Δax = −1362 cm−1, Δrh = −160 cm−1, and using eqn (3) for 2 with D = +58.7 cm−1, E/D = 0, gxy = 2.54 with fixed gz = 2.0 and χTIP = 6.4 × 10⁻⁹ m3 mol−1. The blue full lines represent the calculated data using the CASSCF/NEVPT2 energy levels from CAS(7,5) calculations with eqn (6) and scaled by factor 0.999 for 1 and 0.985 for 2. | |
Prior to analysing the magnetic data, a prognostic role of ab initio calculations in magnetochemistry was applied with the aim to elucidate the electronic structure of the studied complexes and get better insight into the low-lying energy levels. This is a crucial step because in octahedral CoII complexes the 4F atomic term is split into the 4T1g ground state, the first excited 4T2g state and the second excited 4A2g state, and as the ground state possesses an unquenched orbital angular momentum, the spin Hamiltonian formalism is prohibited.18 Further lowering of the symmetry of the coordination polyhedron, e.g. the transition from Oh to D4h symmetry, also does not automatically enable the utilization of the spin Hamiltonian because only in the case of the compressed tetragonal bipyramid, the 4A2g ground term validates such an approach. In the case of the elongated tetragonal bipyramid, 4Eg is the ground term and much advanced models must be applied.19 The splitting of energy levels arising from the 4T1g state was analysed with the L–S Hamiltonian based on Griffith and Figgis20
| |  | (2) |
where
Δax and
Δrh describe splitting of the
4T
1g ground term induced by lowering of the symmetry,
α is an orbital reduction factor,
λ is a spin–orbit coupling and
ge = 2.0023. This Hamiltonian utilizes T
1–P isomorphism, thus the angular orbital momentum
L is equal to 1 with the effective Lande
g-factor,
gL = −α, and is applied to |
S,
L,
MS,
ML〉 functions with
ML = 0, ±1 and
MS = ±1/2, ±3/2.
21 The orbital reduction factor embodies two parameters,
α =
Aκ, where
A is the Figgis coefficient of the configuration interaction resulting from the admixture of the excited terms reflecting the ligand field strength (1 <
A < 3/2), and
κ describes the lowering orbital contribution due to covalency of the metal–ligand bond and it usually holds 0.70 <
κ < 1. Moreover, the spin–orbit coupling parameter
λ can also be reduced in comparison with its free-ion value
λ0 = −180 cm
−1 attributable to the covalent character of the donor–acceptor bond. On the other hand, when the ground state is well isolated from the excited states due to lower symmetry of the ligand field, the spin Hamiltonian formalism for
S = 3/2 is adequate and reads
| | | Ĥ = D(Ŝz2 − Ŝ2/3) + E(Ŝx2 − Ŝy2) + μBBgŜa | (3) |
where
D and
E were already discussed above as the single-ion axial and rhombic ZFS parameters and the next component is the Zeeman term defined in the direction of the magnetic field as
Ba =
B(sin(
θ)cos(
φ), sin(
θ)sin(
φ), cos(
θ)) with the help of the polar coordinates. Independently of choice of the Hamiltonian (
eqn (2) or
eqn (3)), the molar magnetization in
a-direction of magnetic field can be numerically calculated as
| |  | (4) |
where
Z is the partition function.
8 Then, the averaged molar magnetization of the powder sample was calculated as integral (orientational) average
22| |  | (5) |
In order to choose the best model defined either by eqn (2) or eqn (3) for the analysis of 1 and 2, the information about the low-lying energy spectrum is requisite. Therefore, the multi-reference method based on the Spin-Averaged Complete Active Space Self Consistent Field (SA-CASSCF) was utilized to calculate all ninety energy levels resulting from 3d7 electronic configuration with the ORCA computational package. The active space was defined as seven electrons in five d-orbitals, CAS(7,5) and dynamic electronic correlation was treated with the NEVPT2 method. For comparative purposes, the same computational approach was used for a simple octahedral model complex [Co(H2O)6]2+ and the obtained results are depicted in Fig. 4.
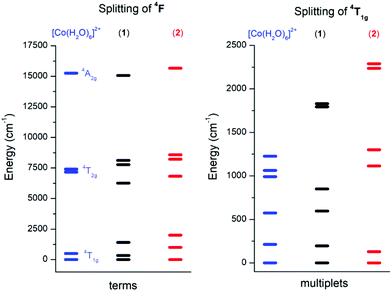 |
| | Fig. 4 The energy diagram for ligand field terms arising from the 4F atomic term (left) and for ligand field multiplets arising from the 4T1g term (right) calculated with CASSCF/NEVPT2 for octahedral [Co(H2O)6]2+, 1 and 2 complexes. | |
It is evident from Fig. 4 (left) that splitting of the 4T1g ground state is more pronounced in 2 than in 1, which is also manifested in the energy scheme of the ligand field multiplets after introducing the spin–orbit interaction (Fig. 4, right). The energy separation between the first two Kramers doublets is 196 cm−1 in 1 and 129 cm−1 in 2. The third doublet has energy 596 cm−1 in 1 and 1113 cm−1 in 2, thus it is evident that the spin Hamiltonian formalism with S = 3/2 is not applicable for 1, but most probably is applicable for 2. The application of the effective Hamiltonian theory to 2 with S = 3/2 using the ORCA software resulted in D = +62.1 cm−1, E/D = 0.158, gx = 2.461, gy = 2.682 and gz = 1.966. An analogous procedure is also possible for 1, but the calculated parameters listed in Table 1 must be treated with great care due to the low lying excited states.
Table 1 The comparison of ab initio calculated and fitted parameters for 1 and 2a
| |
1
|
2
|
|
The values in italics must be considered with great care, because the first excited state is relatively close to the ground state.
|
|
CASSCF/NEVPT2 – the effective Hamiltonian analysis (S = 3/2)
|
|
D (cm−1) |
+87.5 |
+62.1 |
|
E/D |
0.290
|
0.158 |
|
g
x
|
2.290
|
2.461 |
|
g
y
|
2.933
|
2.682 |
|
g
z
|
1.961
|
1.966 |
| |
|
CASSCF/NEVPT2 – the L–S Hamiltonian analysis
|
|
Δ
ax (cm−1) |
−1269 |
+1522 |
|
Δ
rh (cm−1) |
−181 |
+489 |
|
α·λ |
−236 |
−246 |
| |
|
The best-fit of the experimental magnetic data
|
|
|
Δ
ax = −1362 cm−1 |
D = +58.7 cm−1 |
|
|
Δ
rh = −160 cm−1 |
E/D = 0 |
|
|
α = 1.50 |
g
xy
= 2.54 |
|
|
λ = −102 cm−1 |
g
z
= 2.0 |
To deduce the type of the magnetic anisotropy in 1 and 2, the lowest Kramers doublets were analysed with the effective spin Seff = 1/2 resulting in the g-factors gx,eff = 1.941, gy,eff = 2.536, gz,eff = 7.645 for 1 and gx,eff = 1.886, gy,eff = 3.706, gz,eff = 6.428 for 2, thus proposing the easy-axis (in 1) and easy-plane (in 2) types of the magnetism. Rhombicity is much more pronounced for 2, which is also visualized in the 3D pictures of the molar magnetization overlaid over the molecular structures in Fig. 5. We also took a step further and analysed the CASSCF/NEVPT2 zero-field multiplet energy levels resulting from the 4T1g term (energies of the six lowest Kramers doublets) with the L–S Hamiltonian (eqn (2)) and the analyses ended up in α·λ = −236 cm−1, Δax = −1269 cm−1, Δrh = −181 cm−1 for 1 and in α·λ = −246 cm−1, Δax = +1522 cm−1, Δrh = +489 cm−1 for 2 (see ESI, Fig. S1†). Thus, these parameters can be used as starting ones for the fitting of the experimental magnetic data. In order to utilize the results of the ab initio calculations even further, the calculated CASSCF/NEVPT2 matrices of the spin–orbit coupling HSOC, the spin momentum operators (Sx, Sy, Sz) and the orbital momentum operators (Lx, Ly, Lz) were used to calculate the energy levels for any strength and orientation of the magnetic field by the diagonalization of the matrix H defined as
| | | H = HSOC + μB(L + geS)·B | (6) |
which enabled us to calculate the partition function
Z and finally the integral average of the molar magnetization
Mmol for
1 and
2. The great advantage of this procedure is the fact that no restriction of the spin Hamiltonian formalism is applied, thus no ZFS or
g-tensor parameters are used. The calculated data are displayed in
Fig. 3. There is almost perfect agreement with the experimental data for compound
2 whereas the temperature-dependent data for
1 show deviation from the experiment at higher temperatures.
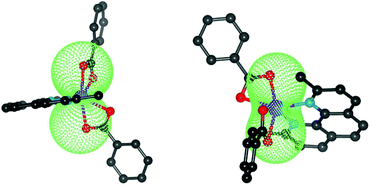 |
| | Fig. 5 The molecular geometries of 1 (left) and 2 (right) overlaid with the calculated molar magnetization from CASSCF/NEVPT energies at T = 2 K and B = 3 T. | |
Considering the results of ab initio calculations, the experimental magnetic data of 1 were analysed with the L–S Hamiltonian according to eqn (2), which resulted in the following parameters: α = 1.50, λ = −102 cm−1, Δax = −1362 cm−1, Δrh = −160 cm−1 (Fig. 3). The fitted parameters Δax and Δrh are close to those calculated from CASSCF/NEVPT2 energies, only the product of α·λ = −154 cm−1 is lower than the one from ab initio calculations. Here we must note that we tried to fit the magnetic data of 1 also with the spin Hamiltonian in eqn (3), but without success. On the contrary, the application of the spin Hamiltonian to the magnetic data of 2 was successful and provided these values of the parameters: D = +58.7 cm−1, E/D = 0, gxy = 2.54 with fixed gz = 2.0 and χTIP = 6.4 × 10⁻⁹ m3 mol−1 (Fig. 3). These parameters are in agreement with the predicted ones from the CASSCF/NEVPT2 calculations (Table 1). To summarize, the ab initio calculations helped us to select the best model for the reported compounds and good agreement with the experimental data was achieved for 1 and 2.
Dynamic magnetic data
The dynamic magnetic data were studied by measuring AC susceptibility for both compounds 1 and 2. We found zero out-of-phase signals in a zero static magnetic field, but upon turning on the magnetic field, the imaginary susceptibility became non-zero for both compounds (see ESI, Fig. S2 and S3†). Therefore, the AC susceptibility was measured at BDC = 0.1 T and revealed maxima of the imaginary susceptibility at various temperatures upon applying different frequencies, thus confirming the slow relaxation of the magnetization in 1 and 2. Then, the one-component Debye's model was applied based on the equation| | 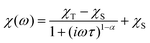 | (7) |
which resulted in isothermal (χT) and adiabatic (χS) susceptibilities, relaxation times (τ) and distribution parameters (α) both for 1 and 2 (see ESI, Tables S3 and S4†).
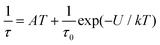
This enabled us to construct the Argand (Cole–Cole) plot (Fig. 6 and 7). Next, the linear fit to the Arrhenius law revealed τ0 = 6.51 × 10⁻⁷ s, U = 22.1 K (15.3 cm−1) for 1, and τ0 = 8.52 × 10⁻⁷ s, U = 17.1 K (11.9 cm−1) for 2. Next, we tried to fit all relaxation times to the combination of direct (A) and Orbach (τ0 and U) relaxation processes as
| |  | (8) |
which resulted in
A = 99.7 K
−1 s
−1,
τ0 = 5.04 × 10
−7 s,
U = 23.5 K for
1, and
A = 249 K
−1 s
−1,
τ0 = 4.74 × 10
−7 s,
U = 19.5 K for
2 (
Fig. 6 and
7). Both approaches resulted in similar values of
τ0 and
U. It is obvious that these acquired
U are rather small in comparison with the two lowest Kramers doublet separations expected from the fitting of the magnetic data or from CASSCF/NEVP2 calculations. As
U reflects the thermally activated Orbach mechanism, limiting the analysis of AC susceptibility data only to the data having the maxima in the Argand diagram could also be the source of underestimation of
U, because non-zero out-of-phase AC susceptibility is already observed below 6 K for
1 and below 5.5 for
2. Therefore, AC susceptibility data were also analysed with a simplified model derived under the assumption that the adiabatic susceptibility is usually approaching zero in single-molecule magnets (
χS → 0).
23 Then the following equation
| | | ln(χ′′/χ′) = ln(2πfτ0) + U/kT | (9) |
can be utilized. Here, the AC susceptibility data for two highest frequencies were used, which resulted in
τ0 = 6.68 × 10
−9 s,
U = 42.9 K (29.8 cm
−1) for
f = 1488.1 Hz and
τ0 = 1.60 × 10
−8 s,
U = 36.4 K (25.3 cm
−1) for
f = 715.6 Hz for
1 (see ESI, Fig. S3
†). A similar procedure for
2 resulted in
τ0 = 2.18 × 10
−8 s,
U = 29.3 K (20.4 cm
−1) for
f = 1488.1 Hz and
τ0 = 2.15 × 10
−8 s,
U = 29.4 K (20.5 cm
−1) for
f = 715.6 Hz (see ESI, Fig. S4
†). This procedure provided us with higher
U values, but they are still much smaller than expected. Therefore, we can conclude that also other mechanisms of the relaxation are active. Thus, the relaxation times were fitted with the following equation
| |  | (10) |
comprising the one-phonon direct (
A) and two-phonon Raman (
C and
n) processes. The application of this equation resulted in
A = 84.8 K
−1 s
−1,
C = 0.271 K
−n s
−1,
n = 7.28 for
1 and
A = 201 K
−1 s
−1,
C = 2.16 K
−n s
−1,
n = 6.66 for
2 (
Fig. 6 and
7). For a well-separated Kramers doublet,
n = 9 is expected;
24 however, usually
n < 9 are reported for Co(
II) complexes. If the Raman relaxation process is active at higher temperatures, the approximate relationship analogous to
eqn (9) can be derived as well
| | | ln(χ′′/χ′) = ln(2πfC) − nlnT | (11) |
and it was used to analyse AC susceptibility data for both compounds
1 and
2, again for data with two highest frequencies (see ESI, Fig. S5
†). As a result,
C = 8.74 K
−n s
−1,
n = 7.9 for
f = 1488.1 Hz and
C = 2.94 K
−n s
−1,
n = 7.3 for
f = 715.6 Hz for
1 was obtained. Analogously,
C = 0.302 K
−n s
−1,
n = 6.6 for
f = 1488.1 Hz and
C = 0.458 K
−n s
−1,
n = 6.8 for
f = 715.6 Hz was found for
2. The
n-values are close to that found by
eqn (10).
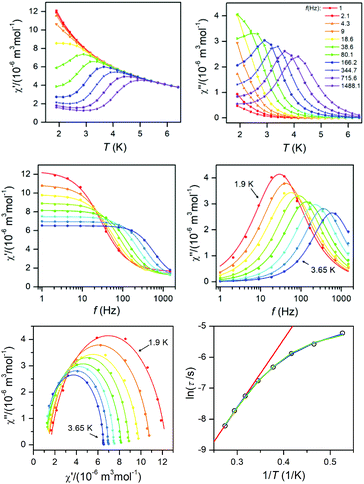 |
| | Fig. 6 AC susceptibility data for 1. Top: In-phase χ′ and out-of-phase χ′′ molar susceptibilities at the applied external magnetic field BDC = 0.1 T (full lines are only guides for eyes). Middle: Frequency dependence of in-phase χ′ and out-of-phase χ′′ molar susceptibilities fitted with one-component Debye's model using eqn (7) (full lines). Bottom: The Argand (Cole–Cole) plot with full lines fitted with eqn (7) and the fit of resulting relaxation times τ with Arrhenius law (red line), with the combination of direct and Orbach processes (green line) using eqn (8) and with the combination of direct and Raman processes (blue line) using eqn (10). | |
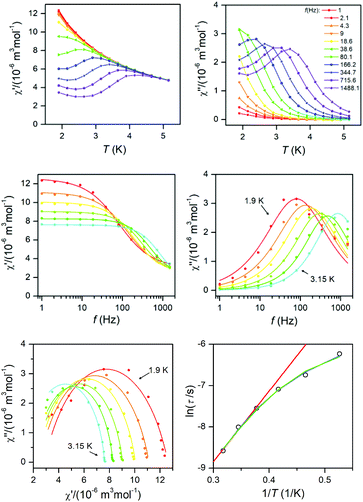 |
| | Fig. 7 AC susceptibility data for 2. Top: In-phase χ′ and out-of-phase χ′′ molar susceptibilities at the applied external magnetic field BDC = 0.1 T (full lines are only guides for eyes). Middle: Frequency dependence of in-phase χ′ and out-of-phase χ′′ molar susceptibilities fitted with one-component Debye's model using eqn (7) (full lines). Bottom: The Argand (Cole–Cole) plot with full lines fitted with eqn (7) and the fit of resulting relaxation times τ with Arrhenius law (red line), with the combination of direct and Orbach processes (green line) using eqn (8) and with the combination of direct and Raman processes (blue line) using eqn (10). | |
To summarize, both studied approaches (direct + Orbach vs. direct + Raman) can elucidate temperature dependence of the relaxation time for 1 and 2, thus is difficult to decide which interpretation is correct. However, the U-values of the Orbach process are rather low in the comparison with the expected values, thus is seems likely that in higher temperatures Raman relaxation process dominates.
Electron paramagnetic spectroscopy
The electronic structures of 1 and 2 were also studied by the X-band EPR spectroscopy. The spectra recorded at 113 K are shown in Fig. S6.† Although at this temperature only very weak signals can be observed, compound 1 shows resonances that can be still nicely simulated in the spin Hamiltonian framework for Seff = 1/2 with gx,eff = 1.91, gy,eff = 2.72, gz,eff = 6.77 and 59Co hyperfine terms of Az = 420 MHz, Ay = 28 MHz and Ax = 134 MHz. The EPR resonance envelope recorded for compound 2 is however much more complex, and features a broad and relatively strong absorption that spans in the wide magnetic field range 1100–2800 Gauss. Although very tentative, the simulation of the observed EPR resonance envelope can be obtained by imposing an overlapped contribution of four species (Seff = 1/2, Kramer doublets coded a, b, c, d), with relative ratio 0.6(a)/0.8(b)/1.8(c)/1.6(d); the following spin-Hamiltonian parameters have been used for the simulation of the EPR envelope: (a, black line) gx,eff = 1.92, gy,eff = 3.40, gz,eff = 6.10 and 59Co hyperfine terms of Az = 644 MHz, Ay = 48 MHz and Ax = 120 MHz; (b, purple line) gx,eff = 2.00, gy,eff = 2.30, gz,eff = 4.40 and Co hyperfine terms of Az = 448 MHz, Ay = 48 MHz and Ax = 100 MHz; (c, blue line) gx,eff = 2.10, gy,z,eff = 2.60, and (d, green line) gx,y,z,eff = 2.10. Taken these results together, the experimentally observed resonances of 1 and 2 clearly point towards differences in the electronic configuration holding in these two systems. Furthermore, the occurrence of much complicated EPR pattern in 2 at T = 113 K clearly indicates a smaller inter-Kramers energy gap, because other energy levels than the ground state are populated at temperature of measurement and this is in agreement with the CASSCF calculations (Fig. 4).
Experimental
Synthesis
All used chemicals and solvents were purchased from commercial sources and were used without any further purification.
Synthesis of α-[Co(neo)(PhCOO)2](1).
This compound was synthesized according to the literature procedure,15 where 0.15 g of Co(NO3)2·6H2O together with 0.15 g of NaPhCOO were dissolved in 15 ml of water and mixed with a methanol solution of neocuproine (0.1 g in 10 ml of CH3OH). The resulting solution was refluxed for 4 h, filtered and left to crystallize slowly at room temperature. Violet needle-like crystals (0.1 g, yield: 38%) were obtained after 1 day. Anal. calc. for C28H22CoN2O4 (in %): C, 66.0; H, 4.4; N, 5.5. Observed: C, 66.0; H, 4.3; N, 5.3. The phase identity of 1 was confirmed by the X-ray powder diffraction measurements and following comparison of the diffraction pattern with the pattern calculated from the previously published crystal structure of 1.
Synthesis of β-[Co(neo)(PhCOO)2] (2).
The water solution of 0.15 g of Co(NO3)2·6H2O dissolved together with 0.15 g of NaPhCOO (in 15 ml of H2O) was added to the methanol solution of neocuproine (0.1 g in 10 ml of CH3OH). The resulting solution was stirred at room temperature at first and the formation of a violet precipitate was observed. This was dissolved by the addition of a small amount of methanol (ca. 2 ml). Then, the solution was refluxed for 10 minutes and filtered. The solution was left to crystallize slowly at room temperature. Violet prism-like single-crystals were obtained after 3 days (0.13 g, yield: 50%). Anal. calc. for C28H22CoN2O4 (in %): C, 66.0; H, 4.4; N, 5.5. Observed: C, 66.1; H, 4.4; N, 5.4.
Synthesis of [Zn(neo)(PhCOO)2] (3).
As described above, in attempts to prepare Zn diluted analogues of 1 and 2 we performed a series of syntheses adopting the preparation protocols as described for 1 and 2 with two Zn:Co ratios (9:1 and 1:1) and using different salts as the source of the metal atoms (e.g. Co(NO3)2·6H2O and Zn(NO3)2·6H2O, CoSO4·7H2O and ZnSO4·7H2O). None of these experiments were successful in the preparation of diluted compounds and we always ended up with a mixture of Co (1 or 2) and Zn needle-like single-crystals, which were subsequently used for the crystal structure determination of 3. No other analytic methods were used for the characterization of 3.
Physical methods
Temperature dependence of the magnetization at B = 0.1 T from 1.9 to 300 K and the isothermal magnetizations at T = 2.0, 5.0 and 10.0 K up to B = 9 T were measured using a PPMS Dynacool with a VSM option. The experimental data were corrected for diamagnetism and for the signal of the sample holder. Measurements of AC susceptibility were carried out in a 3.8 Oe AC field oscillating at various frequencies from 1 to 1500 Hz and with various dc fields using a MPMS XL7 SQUID magnetometer. The X-ray powder diffraction patterns of all solid samples were recorded on an MiniFlex600 (Rigaku) instrument equipped with the Bragg–Brentano geometry, and with iron-filtered Cu Kα1,2 radiation. EPR spectra were recorded on a JEOL JES-X-320 operating at X-band frequency (∼9.14–0.17 GHz), equipped with a variable temperature control ES 13060DVT5 apparatus. The cavity Q quality factor was kept above 6000 in all measurements and signal saturation was avoided by working at low-applied microwave powers. The powder samples (8–10 mg) were loaded onto polypropylene VSM holders (P125E) and the sealed capsules were put inside an EPR quartz tube. Highly-pure quartz tubes were employed (Suprasil, Wilmad, ≤0.5 OD).
Single-crystal X-ray analysis details
X-ray measurements on the selected crystals of 2 were performed on an Oxford Diffraction Xcalibur™2 equipped with a Sapphire2 CCD detector using Mo-Kα radiation at 150 K. The CrysAlis program package (version 1.171.33.52, Oxford Diffraction) was used for data collection and reduction.25 X-ray measurement on the single-crystal of 3 was performed on a Bruker D8 Quest diffractometer equipped with a Photon 100 CMOS detector using the Mo-Kα radiation at 150 K. Data collection, data reduction, and cell parameters refinements were performed using the Bruker Apex III software package.26 The molecular structures were solved by direct methods SHELXS-2014 and all non-hydrogen atoms were refined anisotropically on F2 using full-matrix least-squares procedure SHELXL-2014.27 All hydrogen atoms were found in differential Fourier maps and their parameters were refined using a riding model with Uiso(H) = 1.2 (CH) or 1.5 (CH3) Ueq.
Theoretical methods
All theoretical calculations were performed with the ORCA 4.0 computational package.28 All the calculations employed the triple-ζ def2-TZVP(-f) basis functions29 together with the auxiliary basis def2/JK30 and also utilizing the chain-of-spheres (RIJCOSX) approximation to exact exchange.31 The ZFS and g tensors were calculated using self-consistent field (SA-CASSCF) wave functions32 complemented by N-electron valence second order perturbation theory (NEVPT2).33 The active space of the CASSCF calculation was set to five d-orbitals of Co(II) (CAS(7,5)). The ZFS parameters, based on dominant spin–orbit coupling contributions from excited states, were calculated through quasi-degenerate perturbation theory (QDPT),34 in which approximations to the Breit-Pauli form of the spin–orbit coupling operator (SOMF approximation)35 and the effective Hamiltonian theory36 were utilized.
Conclusions
We reported on the crystal structures, static and dynamic magnetic behaviour of two polymorphs (1 and 2) of the [Co(neo)(PhCOO)2] compound. It was revealed that 1 and 2 differ in the Co–O bond lengths and also in the shape of the coordination polyhedron. Compound 2 shows stronger trigonal distortion than 1 and remarkably, both compounds have enormous angular distortion compared to the regular octahedron geometry. The static magnetic data were analysed using the L–S Hamiltonian (1) or spin Hamiltonian formalism (2) and both approaches revealed large magnetic anisotropy of the axial (1) or easy-plane (2) character. All analyses of magnetic data were supported by CASSCF calculations and these predicted large separations of the Kramers doublets (larger than 120 cm−1 in both) and low lying exciting states in 1, which is in agreement with the necessity to use the L–S model for fitting of the magnetic data for compound 1. The measurements of dynamic magnetic data confirmed that both compounds behave as field-induced SMMs, with relatively small values of the spin reversal barrier: U = 22.1 (for 1) and 17.1 (for 2) K. These values are much lower than those which can be expected for the Kramers doublets separations in 1 and 2 and the purely thermally activated Orbach mechanism of relaxation of magnetization. The attempts to study the relaxation mechanism in greater details on the Zn diluted samples failed because we were not able to prepare diluted samples and instead, we ended up with the preparation of the compound [Zn(neo)(PhCOO)2], (3), which significantly differs in coordination geometry from 1 and 2.
Conflicts of interest
There are no conflicts to declare.
Acknowledgements
We acknowledge financial support from the National Programme of Sustainability I (LO1305) of the Ministry of Education, Youth and Sports of the Czech Republic. The authors are also grateful to Dr Giorgio Zoppellaro (RCPTM, UP in Olomouc) for his help with EPR experiments.
Notes and references
- M. Murrie, Chem. Soc. Rev., 2010, 39, 1986–1995 RSC.
-
(a)
D. Gatteschi, R. Sessoli and J. Villain, Molecular Nanomagnets, Oxford University Press, New York, 2006 Search PubMed;
(b)
M. Ganzhorn and W. Wernsdorfer, in Molecular Magnets, ed. J. Bartolomé, F. Luis and J. F. Fernández, Springer, Berlin Heidelberg, 2014, pp. 319–364 Search PubMed.
-
(a) J. M. Frost, K. L. Harriman and M. Murugesu, Chem. Sci., 2016, 7, 2470–2491 RSC;
(b) G. A. Craig and M. Murrie, Chem. Soc. Rev., 2015, 44, 2135–2147 RSC.
- R. Boča, Coord. Chem. Rev., 2004, 248, 757–815 CrossRef.
- D. Gatteschi and R. Sessoli, Angew. Chem., Int. Ed., 2003, 42, 268–297 CrossRef CAS PubMed.
- R. Herchel, L. Váhovská, I. Potočňák and Z. k. Trávníček, Inorg. Chem., 2014, 53, 5896–5898 CrossRef CAS PubMed.
-
(a) J. Liu, Y.-C. Chen, J.-L. Liu, V. Vieru, L. Ungur, J.-H. Jia, L. F. Chibotaru, Y. Lan, W. Wernsdorfer, S. Gao, X.-M. Chen and M.-L. Tong, J. Am. Chem. Soc., 2016, 138, 5441–5450 CrossRef CAS PubMed;
(b) Y.-S. Ding, N. F. Chilton, R. E. P. Winpenny and Y.-Z. Zheng, Angew. Chem., 2016, 128, 16305–16308 CrossRef.
-
R. Boča, Theoretical Foundations of Molecular Magnetism, Elsevier, Amsterdam, 1999 Search PubMed.
- See e.g.:
(a) R. Boča, J. Miklovič and J. Titiš, Inorg. Chem., 2014, 53, 2367–2369 CrossRef PubMed;
(b) D.-K. Cao, J.-Q. Feng, M. Ren, Y.-W. Gu, Y. Song and M. D. Ward, Chem. Commun., 2013, 49, 8863–8865 RSC;
(c) J. M. Zadrozny, J. Liu, N. A. Piro, C. J. Chang, S. Hill and J. R. Long, Chem. Commun., 2012, 48, 3927–3929 RSC;
(d) J. M. Zadrozny and J. R. Long, J. Am. Chem. Soc., 2011, 133, 20732–20734 CrossRef CAS PubMed;
(e) L. Smolko, J. Cernak, M. Dusek, J. Miklovic, J. Titiš and R. Boča, Dalton Trans., 2015, 44, 17565–17571 RSC;
(f) M. S. Fataftah, J. M. Zadrozny, D. M. Rogers and D. E. Freedman, Inorg. Chem., 2014, 53, 10716–10721 CrossRef CAS PubMed;
(g) F. Yang, Q. Zhou, Y. Zhang, G. Zeng, G. Li, Z. Shi, B. Wang and S. Feng, Chem. Commun., 2013, 49, 5289–5291 RSC;
(h) T. Jurca, A. Farghal, P.-H. Lin, I. Korobkov, M. Murugesu and D. S. Richeson, J. Am. Chem. Soc., 2011, 133, 15814–15817 CrossRef CAS PubMed;
(i) F. Habib, O. R. Luca, V. Vieru, M. Shiddiq, I. Korobkov, S. I. Gorelsky, M. K. Takase, L. F. Chibotaru, S. Hill, R. H. Crabtree and M. Murugesu, Angew. Chem., Int. Ed., 2013, 52, 11290–11293 CrossRef CAS PubMed;
(j) V. Chandrasekhar, A. Dey, A. J. Mota and E. Colacio, Inorg. Chem., 2013, 52, 4554–4561 CrossRef CAS PubMed;
(k) Y.-Y. Zhu, C. Cui, Y.-Q. Zhang, J.-H. Jia, X. Guo, C. Gao, K. Qian, S.-D. Jiang, B.-W. Wang, Z.-M. Wang and S. Gao, Chem. Sci., 2013, 4, 1802–1806 RSC;
(l) J. Vallejo, I. Castro, R. Ruiz-García, J. Cano, M. Julve, F. Lloret, G. De Munno, W. Wernsdorfer and E. Pardo, J. Am. Chem. Soc., 2012, 134, 15704–15707 CrossRef CAS PubMed;
(m) Y.-L. Wang, L. Chen, C.-M. Liu, Y.-Q. Zhang, S.-G. Yin and Q.-Y. Liu, Inorg. Chem., 2015, 54, 11362–11368 CrossRef CAS PubMed;
(n) A. Świtlicka-Olszewska, J. Palion-Gazda, T. Klemens, B. Machura, J. Vallejo, J. Cano, F. Lloret and M. Julve, Dalton Trans., 2016, 45, 10181–10193 RSC;
(o) C. Rajnák, J. Titiš, J. Moncoľ, F. Renz and R. Boča, Eur. J. Inorg. Chem., 2017, 2017, 1520–1525 CrossRef;
(p) C. Rajnák, F. Varga, J. Titiš, J. Moncoľ and R. Boča, Eur. J. Inorg. Chem., 2017, 2017, 1915–1922 CrossRef;
(q) C. Rajnák, J. Titiš, J. Miklovič, G. E. Kostakis, O. Fuhr, M. Ruben and R. Boča, Polyhedron, 2017, 126, 174–183 CrossRef;
(r) T. J. Woods, M. F. Ballesteros-Rivas, S. Gómez-Coca, E. Ruiz and K. R. Dunbar, J. Am. Chem. Soc., 2016, 138, 16407–16416 CrossRef CAS PubMed;
(s) R. Bruno, J. Vallejo, N. Marino, G. De Munno, J. Krzystek, J. Cano, E. Pardo and D. Armentano, Inorg. Chem., 2017, 56, 1857–1864 CrossRef CAS PubMed;
(t) S. Ziegenbalg, D. Hornig, H. Görls and W. Plass, Inorg. Chem., 2016, 55, 4047–4058 CrossRef CAS PubMed;
(u) A. Switlicka-Olszewska, J. Palion-Gazda, T. Klemens, B. Machura, J. Vallejo, J. Cano, F. Lloret and M. Julve, Dalton Trans., 2016, 45, 10181–10193 RSC;
(v) P. Antal, B. Drahoš, R. Herchel and Z. Trávníček, Inorg. Chem., 2016, 55, 5957–5972 CrossRef CAS PubMed;
(w) D. Shao, S.-L. Zhang, L. Shi, Y.-Q. Zhang and X.-Y. Wang, Inorg. Chem., 2016, 55, 10859–10869 CrossRef CAS PubMed;
(x) S. Sottini, G. Poneti, S. Ciattini, N. Levesanos, E. Ferentinos, J. Krzystek, L. Sorace and P. Kyritsis, Inorg. Chem., 2016, 55, 9537–9548 CrossRef CAS PubMed.
- Y. Y. Zhu, C. Cui, Y. Q. Zhang, J. H. Jia, X. Guo, C. Gao, K. Qian, S. D. Jiang, B. W. Wang, Z. M. Wang and S. Gao, Chem. Sci., 2013, 4, 1802 RSC.
-
(a) V. V. Novikov, A. A. Pavlov, Y. V. Nelyubina, M.-E. Boulon, O. A. Varzatskii, Y. Z. Voloshin and R. E. P. Winpenny, J. Am. Chem. Soc., 2015, 137, 9792–9795 CrossRef CAS PubMed;
(b) A. A. Pavlov, Y. V. Nelyubina, S. V. Kats, L. V. Penkova, N. N. Efimov, A. O. Dmitrienko, A. V. Vologzhanina, A. S. Belov, Y. Z. Voloshin and V. V. Novikov, J. Phys. Chem. Lett., 2016, 7, 4111–4116 CrossRef CAS PubMed.
- T. J. Ozumerzifon, I. Bhowmick, W. C. Spaller, A. K. Rappé and M. P. Shores, Chem. Commun., 2017, 53, 4211–4214 RSC.
- see e.g.
(a) J. Tao, R.-J. Wei, R.-B. Huang and L.-S. Zheng, Chem. Soc. Rev., 2012, 41, 703–737 RSC;
(b) I. Salitros, O. Fuhr and M. Ruben, Materials, 2016, 9(7), 585 CrossRef PubMed;
(c) I. Salitros, L. Pogany, M. Ruben, R. Boca and W. Linert, Dalton Trans., 2014, 43, 16584–16587 RSC;
(d) I. Salitros, O. Fuhr, A. Eichhofer, R. Kruk, J. Pavlik, L. Dlhan, R. Boca and M. Ruben, Dalton Trans., 2012, 41, 5163–5171 RSC.
- S. Roy, I. Oyarzabal, J. Vallejo, J. Cano, E. Colacio, A. Bauza, A. Frontera, A. M. Kirillov, M. G. B. Drew and S. Das, Inorg. Chem., 2016, 55, 8502–8513 CrossRef CAS PubMed.
- P.-Z. Zhao, X.-P. Xuan and Q.-H. Tang, Acta Crystallogr., Sect. E: Struct. Rep. Online, 2008, 64, m327 CAS.
-
M. Llunell, D. Casanova, J. Cicera, P. Alemany and S. Alvarez, SHAPE, Version 2.1, Barcelona, Spain, 2013 Search PubMed.
-
(a) The distortion parameter is defined as the sum of deviations from 90° of the twelve cis angles in the coordination sphere; ;
(b) P. Guionneau, M. Marchivie, G. Bravic, J.-F. Létard and D. Chasseau, Top. Curr. Chem., 2004, 234, 97–128 CrossRef CAS.
-
R. Boča, in Magnetic Functions Beyond the Spin-Hamiltonian, ed. D. M. P. Mingos, Springer Berlin Heidelberg, Berlin, Heidelberg, 2006, pp. 1–264 Search PubMed.
- J. Titiš and R. Boča, Inorg. Chem., 2011, 50, 11838–11845 CrossRef PubMed.
-
(a)
J. S. Griffith, The theory of transition metal ions, Cambridge University Press, 1961 Search PubMed;
(b) B. N. Figgis, M. Gerloch, J. Lewis, F. E. Mabbs and G. A. Webb, J. Chem. Soc. A, 1968, 2086–2093 RSC.
-
(a)
R. Boča, A Handbook of Magnetochemical Formulae, Elsevier, Amsterdam, 2012 Search PubMed.
-
R. Boča and R. Herchel, Program Polymagnet, 2009–2017 Search PubMed.
-
D. Gatteshi, R. Sessoli and J. Villain, Molecular Nanomagnets, Oxford University Press, New York, 2006 Search PubMed.
-
R. L. Carlin, Magnetochemistry, Springer-Verlag, Berlin, 1986 Search PubMed.
-
CrysAlis CCD and CrysAlis RED, Version 1.171.33.52, Oxford Diffraction Ltd, England, 2009 Search PubMed.
-
Bruker. Apex3. Bruker AXS Inc., Madison, Wisconsin, USA, 2015 Search PubMed.
- G. M. Sheldrick, Acta Crystallogr., Sect. C: Struct. Chem., 2015, 71(1), 3–8 CrossRef PubMed.
-
(a) F. Neese, Wiley Interdiscip. Rev.: Comput. Mol. Sci., 2012, 2, 73–78 CrossRef CAS;
(b) F. Neese, Wiley Interdiscip. Rev.: Comput. Mol. Sci., 2018, 8, e1327 CrossRef.
- F. Weigend and R. Ahlrichs, Phys. Chem. Chem. Phys., 2005, 7, 3297–3305 RSC.
- F. Weigend, J. Comput. Chem., 2008, 29, 167–175 CrossRef CAS PubMed.
- F. Neese, F. Wennmohs, A. Hansen and U. Becker, Chem. Phys., 2009, 356, 98–109 CrossRef CAS.
- P. A. Malmqvist and B. O. Roos, Chem. Phys. Lett., 1989, 155, 189–194 CrossRef CAS.
-
(a) C. Angeli, R. Cimiraglia, S. Evangelisti, T. Leininger and J. P. Malrieu, J. Chem. Phys., 2001, 114, 10252–10264 CrossRef CAS;
(b) C. Angeli, R. Cimiraglia and J. P. Malrieu, Chem. Phys. Lett., 2001, 350, 297–305 CrossRef CAS;
(c) C. Angeli, R. Cimiraglia and J. P. Malrieu, J. Chem. Phys., 2002, 117, 9138–9153 CrossRef CAS;
(d) C. Angeli, S. Borini, M. Cestari and R. Cimiraglia, J. Chem. Phys., 2004, 121, 4043–4049 CrossRef CAS PubMed;
(e) C. Angeli, B. Bories, A. Cavallini and R. Cimiraglia, J. Chem. Phys., 2006, 124, 054108 CrossRef PubMed.
- D. Ganyushin and F. Neese, J. Chem. Phys., 2006, 125, 024103 CrossRef PubMed.
- F. Neese, J. Chem. Phys., 2005, 122, 034107 CrossRef PubMed.
- R. Maurice, R. Bastardis, C. de Graaf, N. Suaud, T. Mallah and N. Guihéry, J. Chem. Theory Comput., 2009, 5, 2977–2984 CrossRef CAS PubMed.
Footnote |
| † Electronic supplementary information (ESI) available. CCDC 1581344 and 1581345. For ESI and crystallographic data in CIF or other electronic format see DOI: 10.1039/c7dt03992a |
|
| This journal is © The Royal Society of Chemistry 2018 |

 Open Access Article
 This Open Access Article is licensed under a Creative Commons Attribution-Non Commercial 3.0 Unported Licence
 ,
R.
Herchel
,
R.
Herchel