 Open Access Article
Creative Commons Attribution 3.0 Unported Licence
The half Heusler system Ti1+xFe1.33−xSb–TiCoSb with Sb/Sn substitution: phase relations, crystal structures and thermoelectric properties
A.
Tavassoli
ab,
A.
Grytsiv
 *acd,
G.
Rogl
 acd,
V. V.
Romaka
 e,
H.
Michor
 c,
M.
Reissner
c,
E.
Bauer
c,
M.
Reissner
c,
E.
Bauer
 cd,
M.
Zehetbauer
 b and
P.
Rogl
 ad
ad
aInstitute of Materials Chemistry and Research, University of Vienna, Währingerstraße 42, A-1090 Wien, Austria. E-mail: andriy.grytsiv@univie.ac.at
bPhysics of Nanostructured Materials, Faculty of Physics, University of Vienna, Boltzmanngasse 5, A-1090 Wien, Austria
cInstitute of Solid State Physics, TU Wien, Wiedner Hauptstr., 8-10, A-1040 Wien, Austria
dChristian Doppler Laboratory for Thermoelectricity, Wien, Austria
eDepartment of Materials Science and Engineering, Lviv Polytechnic National University, Ustiyanovycha Str. 5, 79013 Lviv, Ukraine
First published on 30th November 2017
Abstract
Investigations of phase relations in the ternary system Ti–Fe–Sb show that the single-phase region of the Heusler phase is significantly shifted from stoichiometric TiFeSb (reported previously in the literature) to the Fe-rich composition TiFe1.33Sb. This compound also exhibits Fe/Ti substitution according to Ti1+xFe1.33−xSb (−0.17 ≤ x ≤ 0.25 at 800 °C). Its stability, crystal symmetry and site preference were established by using X-ray powder techniques and were backed by DFT calculations. The ab initio modeling revealed TiFe1.375Sb to be the most stable composition and established the mechanisms behind Fe/Ti substitution for the region Ti1+xFe1.33−xSb, and of the Fe/Co substitution within the isopleth TiFe1.33Sb–TiCoSb. The calculated residual resistivity of Ti1+xFe1.33−xSb, as well as of the isopleths TiFe1.33Sb–TiCoSb, TiFe0.665Co0.5Sb–TiCoSb0.75Sn0.25 and TiFe0.33Co0.75Sb–TiCoSb0.75Sn0.25, are in a good correlation with the experimental data. From magnetic measurements and 57Fe Mössbauer spectrometry, a paramagnetic behavior down to 4.2 K was observed for TiFe1.33Sb, with a paramagnetic Curie–Weiss temperature of −8 K and an effective moment of 1.11μB per Fe. Thermoelectric (TE) properties were obtained for the four isopleths Ti1+xFe1.33−xSb, TiFe1.33Sb–TiCoSb, TiFe0.665Co0.5Sb–TiCoSb0.75Sn0.25 and TiFe0.29Co0.78Sb–TiCoSb0.75Sn0.25 by measurements of electrical resistivity (ρ), Seebeck coefficient (S) and thermal conductivity (λ) at temperatures from 300 K to 823 K allowing the calculation of the dimensionless figure of merit (ZT). Although p-type Ti1+xFe1.33−xSb indicates a semi-conducting behavior for the Fe rich composition (x = −0.133), the conductivity changes to a metallic type with increasing Ti content. The highest ZT = 0.3 at 800 K was found for the composition TiFe1.33Sb. The TE performance also increases with Fe/Co substitution and reaches ZT = 0.42 for TiCo0.5Fe0.665Sb. No further increase of the TE performance was observed for the Sb/Sn substituted compounds within the sections TiFe0.665Co0.5Sb–TiCoSb0.75Sn0.25 and TiFe0.33Co0.75Sb–TiCoSb0.75Sn0.25. However, ZT-values could be enhanced by about 12% via the optimization of the preparation route (ball-mill conditions and heat treatments).
1. Introduction
Thermoelectricity is one of the simplest means of the direct conversion of heat into electricity. Here, the energy conversion efficiency is governed by the dimensionless figure of merit ZT = S2σ/(λe + λph), where S is the Seebeck coefficient, T the absolute temperature, σ the electrical conductivity, and λe and λph the electron and lattice components of the total thermal conductivity λ, respectively. Whilst the Seebeck coefficient of a distinct thermoelectric material increases with decreasing charge carrier concentration (n), the electrical conductivity decreases; thus, an optimum thermoelectric performance of heavily doped semiconductors is obtained for n ∼ 1019–1021 cm−3.Half Heusler (HH) alloys have attracted considerable interest as thermoelectric (TE) materials in the temperature range around 700 K and above, which is close to the temperature range of most industrial waste heat sources.1–6 HH compounds crystallize in the cubic MgAgAs structure-type, space group F![[4 with combining macron]](https://www.rsc.org/images/entities/char_0034_0304.gif) 3m, forming three interpenetrating face-centered cubic (fcc) sublattices and one vacant sublattice.7 In view of the Zintl mechanism, HH materials with 18 valence electrons were shown to exhibit semiconducting properties.8 A great advantage in the optimization of the thermoelectric properties of HH compounds is the possibility to individually dope each of these sublattices. The most attractive properties of HH materials for thermoelectrics are their high Seebeck coefficient S up to 300 μV K−1 at room temperature and their high electrical conductivity (100 to 1000 S cm−1); however, the drawback of HH alloys is their relatively high thermal conductivity reaching up to 10 W mK−1 at room temperature.9 Many HH compounds were investigated in the past with the aim to improve their thermoelectric properties. So far the highest ZT = 1.5 has been reported by Sakurada and Shutoh10 for Sb-doped n-type Ti0.5Zr0.25Hf0.25NiSn0.998Sb0.002 at 690 K and by Rogl et al.11 at a slightly higher temperature of 825 K. Schwall and Balke12 obtained ZT = 1.2 at 830 K via intrinsic phase separation in Ti0.5Zr0.25Hf0.25NiSn0.998Sb0.002. More recent attempts have succeeded in obtaining a ZT of ∼1.35 for n-type Ti0.15Zr0.25Hf0.65NiSn0.995Sb0.005 with nano-dispersed ZrO2
3m, forming three interpenetrating face-centered cubic (fcc) sublattices and one vacant sublattice.7 In view of the Zintl mechanism, HH materials with 18 valence electrons were shown to exhibit semiconducting properties.8 A great advantage in the optimization of the thermoelectric properties of HH compounds is the possibility to individually dope each of these sublattices. The most attractive properties of HH materials for thermoelectrics are their high Seebeck coefficient S up to 300 μV K−1 at room temperature and their high electrical conductivity (100 to 1000 S cm−1); however, the drawback of HH alloys is their relatively high thermal conductivity reaching up to 10 W mK−1 at room temperature.9 Many HH compounds were investigated in the past with the aim to improve their thermoelectric properties. So far the highest ZT = 1.5 has been reported by Sakurada and Shutoh10 for Sb-doped n-type Ti0.5Zr0.25Hf0.25NiSn0.998Sb0.002 at 690 K and by Rogl et al.11 at a slightly higher temperature of 825 K. Schwall and Balke12 obtained ZT = 1.2 at 830 K via intrinsic phase separation in Ti0.5Zr0.25Hf0.25NiSn0.998Sb0.002. More recent attempts have succeeded in obtaining a ZT of ∼1.35 for n-type Ti0.15Zr0.25Hf0.65NiSn0.995Sb0.005 with nano-dispersed ZrO2![[thin space (1/6-em)]](https://www.rsc.org/images/entities/char_2009.gif) 2 and for (Zr0.40Hf0.60)0.00V0.01NiSn0.998Sb0.002 with vanadium resonant states.13 For commercial thermoelectric applications, however, the high priced Hf-metal needs to be avoided. Therefore, it is interesting to note that for the Hf-free grades Ti0.5Zr0.5NiSn0.98Sb0.02
2 and for (Zr0.40Hf0.60)0.00V0.01NiSn0.998Sb0.002 with vanadium resonant states.13 For commercial thermoelectric applications, however, the high priced Hf-metal needs to be avoided. Therefore, it is interesting to note that for the Hf-free grades Ti0.5Zr0.5NiSn0.98Sb0.02![[thin space (1/6-em)]](https://www.rsc.org/images/entities/char_2009.gif) 14 and Ti0.50Zr0.48Nb0.02NiSn0.98Sb0.02,11 a ZT = 1.2 was obtained with a thermoelectric efficiency η300–800 K > 11%. A significant progress was also made for p-type Nb1−xHfxFeSb with ZTmax ≈ 1.5 at 1200 K (ref. 15) and for the Hf free Ti-substituted solid solution Nb1−xTixFeSb.16–18 During our study of thermoelectric alloys in the section NbFeSb–TiFeSb,18 we noticed the absence of transport properties of the parent compound TiFeSb, which also served as the base for Fe/Co and Sb/Sn substituted thermoelectric materials. The Fe/Co substitution in TiFexCo1−xSb results in a significant increase of ZT from 0.05 for TiCoSb19 to 0.42 for TiFe0.3Co0.7Sb.20 These values are close to that reported for Sb/Sn substituted TiCoSb0.8Sn0.2 (ZTmax = 0.5 at 700 K (ref. 21)). In addition, a DFT calculation of Ti/Fe substitution in Ti1−xFexCoSb indicated a decrease of ZT from 0.05 for TiCoSb19 to 0.02 for Ti0.9Fe0.1CoSb.22
14 and Ti0.50Zr0.48Nb0.02NiSn0.98Sb0.02,11 a ZT = 1.2 was obtained with a thermoelectric efficiency η300–800 K > 11%. A significant progress was also made for p-type Nb1−xHfxFeSb with ZTmax ≈ 1.5 at 1200 K (ref. 15) and for the Hf free Ti-substituted solid solution Nb1−xTixFeSb.16–18 During our study of thermoelectric alloys in the section NbFeSb–TiFeSb,18 we noticed the absence of transport properties of the parent compound TiFeSb, which also served as the base for Fe/Co and Sb/Sn substituted thermoelectric materials. The Fe/Co substitution in TiFexCo1−xSb results in a significant increase of ZT from 0.05 for TiCoSb19 to 0.42 for TiFe0.3Co0.7Sb.20 These values are close to that reported for Sb/Sn substituted TiCoSb0.8Sn0.2 (ZTmax = 0.5 at 700 K (ref. 21)). In addition, a DFT calculation of Ti/Fe substitution in Ti1−xFexCoSb indicated a decrease of ZT from 0.05 for TiCoSb19 to 0.02 for Ti0.9Fe0.1CoSb.22
Furthermore, we noticed that some controversy concerns the region of existence of the HH phase in the Ti–Fe–Sb system. The HH phase TiFeSb (with symmetry F![[4 with combining macron]](https://www.rsc.org/images/entities/char_0034_0304.gif) 3m) was first reported by Krypyakevych et al.23,24 Its symmetry and composition have been confirmed;25,26 however, a HH phase with composition Ti1.27FeSb was reported by Skolozdra et al.27 with additional Ti atoms occupying the tetrahedral vacancies. From an investigation of the isothermal section of the Ti–Fe–Sb system at 800 °C (mainly based on X-ray diffraction analyses), Melnyk and Tremel26 determined the homogeneity region for the HH phase as Ti1+xFeSb (−0.2 ≤ x ≤ 0.27) at 800 °C. In contrast to these findings, weak X-ray reflections but also neutron powder diffraction experiments claimed for TiFeSb a superstructure with 8-fold unit cell (Fm
3m) was first reported by Krypyakevych et al.23,24 Its symmetry and composition have been confirmed;25,26 however, a HH phase with composition Ti1.27FeSb was reported by Skolozdra et al.27 with additional Ti atoms occupying the tetrahedral vacancies. From an investigation of the isothermal section of the Ti–Fe–Sb system at 800 °C (mainly based on X-ray diffraction analyses), Melnyk and Tremel26 determined the homogeneity region for the HH phase as Ti1+xFeSb (−0.2 ≤ x ≤ 0.27) at 800 °C. In contrast to these findings, weak X-ray reflections but also neutron powder diffraction experiments claimed for TiFeSb a superstructure with 8-fold unit cell (Fm![[3 with combining macron]](https://www.rsc.org/images/entities/char_0033_0304.gif) m; a = 2a0 = 1.1898 nm, Cu4Mn3Bi4-type).28
m; a = 2a0 = 1.1898 nm, Cu4Mn3Bi4-type).28
Our preliminary investigations of the phase equilibria in the Ti–Fe–Sb system29,30 showed that the single phase region of the Heusler phase at 800 °C excludes the stoichiometric composition TiFeSb, which appears to be significantly shifted to a higher Fe-content. For a significant Fe/Ti substitution, the resulting chemical formula is Ti1+xFe1.33−xSb. The formula TiFe1.33Sb is consistent with the composition Ti30Fe40Sb30 (in at%; determined with an uncertainty of ∼5 at%) as reported by Naghibolashrafi et al.31 who, however, labeled this phase as TiFe1.5Sb. Based on their Rietveld refinement (RI = 0.1) and selected area electron diffraction (SAED) results, these authors31 concluded the Heusler symmetry Fm![[3 with combining macron]](https://www.rsc.org/images/entities/char_0033_0304.gif) m for TiFe1.5Sb. Besides this strong discrepancy on the composition of the Ti–Fe–Sb Heusler phase, no reliable data exist on the exact symmetry (Fm
m for TiFe1.5Sb. Besides this strong discrepancy on the composition of the Ti–Fe–Sb Heusler phase, no reliable data exist on the exact symmetry (Fm![[3 with combining macron]](https://www.rsc.org/images/entities/char_0033_0304.gif) m or F
m or F![[4 with combining macron]](https://www.rsc.org/images/entities/char_0034_0304.gif) 3m) and atom site preference of this compound. Although new experimental findings located the Heusler phase at a higher Fe-content (TiFe1+xSb), recent DFT calculations did not necessarily take them into account. The calculations of Azar et al.32 for Ti1+xFeSb were based on the old crystallographic model with additional titanium atoms in the unit cell Ti1+xFeSb,26 while Sharma and Kumar treated the stoichiometric Heusler phase TiFe2Sb.33
3m) and atom site preference of this compound. Although new experimental findings located the Heusler phase at a higher Fe-content (TiFe1+xSb), recent DFT calculations did not necessarily take them into account. The calculations of Azar et al.32 for Ti1+xFeSb were based on the old crystallographic model with additional titanium atoms in the unit cell Ti1+xFeSb,26 while Sharma and Kumar treated the stoichiometric Heusler phase TiFe2Sb.33
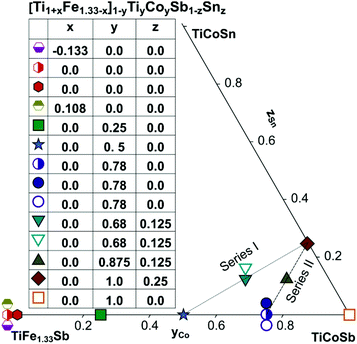
The aforementioned conflicting facts for TiFeSb-based thermoelectrics clearly reveal that both sections TiFexCo1−xSb and Ti1−xFexCoSb were ill chosen demanding a re-optimization of thermoelectric properties along proper isopleths. These arguments prompted us to focus our investigations in this work on several tasks: (i) to clarify the crystal structure and extension of the single-phase region of the Heusler phase in the ternary system Ti–Fe–Sb; and (ii) to re-investigate the homogeneity regions and to study the effects of Fe/Ti, Fe/Co and Sb/Sn substitutions on the TE properties for the Heusler phase in the system Ti–Fe–Co–Sb–Sn (for detailed location of the samples planned and investigated, see Fig. 1). As major means of investigation/alloy characterization we employed X-ray diffraction, electron microprobe analyses and the general techniques for physical property measurements (see the section Experimental details). However, since the X-ray atom scattering powers of the elements Ti, Fe, Co are rather similar and thus might not allow an unambiguous evaluation of atom site distributions in the crystal structures, the present study is assisted by (i) DFT calculations of the electronic structures and in particular their stability, as well as by (ii) Mössbauer and magnetic susceptibility measurements in order to elucidate the details of the Fe-sublattice.
2. Experimental details
2.1. Sample preparation
Samples with a weight of 1.5 g were prepared by conventional arc melting on a water-cooled copper hearth under an inert gas atmosphere (Ar, 5 N) using appropriate amounts of ingots of elements with purity above 99.9%. In order to compensate the weight losses of antimony during arc melting about 3 wt% Sb were added. Repeated flipping over and re-melting homogenized the reguli. Samples were then sealed in quartz ampoules under an argon pressure of 0.25–0.3 bar and were heat treated (HT1) at 800 °C (Ti–Fe–Sb alloys: 2–3 weeks) and 950 °C (Ti–Fe–Co–Sb/Sn: 9–11 days).In order to obtain bigger samples for the measurement of TE properties, 3–4 reguli were crushed into powders with a grain size below 75 μm and then ball milled in tungsten carbide vessels (volume = 80 ml, Ar filled) in a Fritsch planetary mill (Pulverisette 4) with balls of 10 mm diameter under two conditions: (i) at 200 rpm (main disc) and −500 rpm (vessels) for 2 h (ball milled – BM) or (ii) at 400 rpm (main disc) and −1000 rpm (vessels) for 4 h (high energy ball milled – HEBM). The obtained powder was packed into a graphite die with 10 mm diameter and consolidated to a pellet under 56 MPa employing a uniaxial hot press (HP, FCT, W200/250-2200-200-KS) using 5 N Ar as an inert atmosphere at temperatures from 800 °C to 950 °C (Table 1). In some cases the samples were additionally heat-treated (HT2). The compositions of all samples (from EPMA) are shown in Fig. 1 and specific details for their preparation are listed in Table 1.
| #a | Nominal composition | Composition EPMAb | HT1, T, °C | BM | HP, °C | HT2, T, °C | a, nm | E g, meV | d R, % | ||||
|---|---|---|---|---|---|---|---|---|---|---|---|---|---|
| x | y | z | x | y | z | ||||||||
| a These symbols were used for the samples in all figures in this article. b The composition of the HH phase. c After hot-pressing at 950 °C for 1/2 h the pressure was released and the sample was annealed at 800 °C for 4 h. d The low density of this sample is due to the insufficient pressure during hot pressing (collision limit for piston). e No maximum was observed for the Seebeck coefficient in the investigated temperature range. | |||||||||||||

|
−0.168 | 0.0 | 0.0 | −0.133 | 0.0 | 0.0 | 800, 8d | HEBM | 950c | 800, 13d | 0.59480(2) | 62 | 98.2 |

|
0.0 | 0.0 | 0.0 | 0.0 | 0.0 | 0.0 | 800, 21d | BM | 950 | 800, 10d | 0.59587(1) | 122 | 89.9d |

|
0.0 | 0.0 | 0.0 | 0.0 | 0.0 | 0.0 | 800, 8d | HEBM | 950c | 800, 13d | 0.59578(1) | 121 | 98.0 |

|
0.143 | 0.0 | 0.0 | 0.108 | 0.0 | 0.0 | 800, 8d | HEBM | 950c | 800, 13d | 0.59771(4) | 146 | 98.0 |

|
0.0 | 0.25 | 0.0 | 0.0 | 0.25 | 0.0 | 950, 11d | BM | 975 | 950, 9d | 0.59344(3) | 161 | 96.6 |

|
0.0 | 0.5 | 0.0 | 0.0 | 0.5 | 0.0 | 950, 11d | BM | 970 | 950, 9d | 0.59192(2) | —e | 94.4 |

|
0.0 | 0.75 | 0.0 | 0.0 | 0.78 | 0.0 | 950, 11d | BM | 970 | 950, 9d | 0.58981(2) | —e | 97.4 |

|
0.0 | 0.75 | 0.0 | 0.0 | 0.78 | 0.0 | — | HEBM | 970 | — | 0.58959(4) | 339 | 99.8 |

|
0.0 | 0.75 | 0.0 | 0.0 | 0.78 | 0.0 | — | HEBM | 970 | 950, 9d | 0.58956(2) | —e | 93.9 |

|
0.0 | 0.75 | 0.125 | 0.0 | 0.68 | 0.125 | — | HEBM | 950 | — | 0.59059(5) | —e | 99.0 |

|
0.0 | 0.75 | 0.125 | 0.0 | 0.68 | 0.125 | — | HEBM | 950 | 950, 9d | 0.59043(3) | —e | 98.2 |

|
0.0 | 0.875 | 0.125 | 0.0 | 0.875 | 0.125 | — | HEBM | 970 | — | 0.58945(5) | —e | 99.8 |

|
0.0 | 1 | 0.25 | 0.0 | 1 | 0.25 | — | HEBM | 970 | — | 0.58994(3) | 316 | 99.8 |

|
0.0 | 1 | 0.0 | 0.0 | 1 | 0.0 | 900, 7d | BM | 990 | — | 0.58816(4) | —e | |
2.2. Sample characterization (X-ray and micro-structure)
The phase structures of the samples were investigated by X-ray powder diffraction (XPD) collected from a HUBER-Guinier image plate with monochromatic CuKα1-radiation (λ = 0.154056 nm) and pure Ge (99.9999%) as an internal standard. Precise lattice parameters were calculated by least squares fits to the indexed 2Θ values (calibrated with respect to Ge as an internal standard; aGe = 0.565791 nm at room temperature) using the program STRUKTUR.34 The microstructure and chemical composition were analyzed by scanning electron microscopy (SEM) and electron probe microanalysis (EPMA) via INCA Penta FETx3 – Zeiss SUPRA™55VP equipment with an EDX detector. Standard deviations on a minimum of ten points measured per phase in equilibrated alloys were less than ±0.2 mass% i.e. never exceeding ±0.5 at% for the accepted composition. For the maximum difference of atomic numbers, the measured deviation was less than 1 at% for the line compound TiSb2. Quantitative Rietveld refinement was used to determine the atom site, phase distribution and lattice parameter employing the program FULLPROF.35,362.3. Physical property measurements
The Seebeck coefficient and electrical resistivity were measured simultaneously from 300 to 823 K using an ULVAC-RIKO ZEM-3 system. The thermal conductivity was calculated from the thermal diffusivity (D), the heat capacity (Cp) and the density (d) employing the formula λ = D × Cp × d. The thermal diffusivity and the heat capacity were determined using a flash method (ANTER Flashline 3000 unit) in the temperature range of 423–800 K. The density (dA) was measured by the Archimedes principle in distilled water; the relative density, dR, in percent was calculated by dR = (dA/dX) 100%; dX is defined as dX-ray = nM/VNA, where n is the number of atoms in the cell, M is the molecular weight, V is the cell volume and NA is Loschmidt's number. Generally, measurement errors for the electrical resistivity and Seebeck measurements are ∼3%, and for thermal conductivity ∼5%.57Fe Mössbauer measurements were performed at 294 K and at 4.2 K in standard transmission mode using a 57CoRh source relative to which the values of the center shift are given. Specific heat measurements were performed on a commercial Quantum Design PPMS calorimeter in the temperature range of 0.4–5 K with a 3He insert and from 2–300 K with a 4He puck. DC magnetic susceptibility measurements were performed at 0.1 T using a CRYOGENIC SQUID magnetometer in the range of 2–300 K. Additional magnetization data were collected at 1 T, 3 T and 5 T in order to verify the approximate linearity of the field dependent isothermal magnetization.
2.4. First-principles calculations
The DFT calculations were carried out using the ELK v2.3.22 package37 – an all-electron full-potential linearized augmented-plane wave (FP-LAPW) code with the Perdew–Burke–Ernzerhof exchange–correlation functional in the generalized gradient approximation (GGA).38 The k-point mesh grid was equal to 10 × 10 × 10 k-points. Prior to the final total energy calculations the lattice parameter a was optimized by using the universal equation of state39 for the set of 11 values of the lattice parameter with 0.1 nm step in the range of 0.55–0.65 nm. The appropriate values of the muffin-tin radii were selected automatically at the initial stage of the calculations. In general, the enthalpy of formation (ΔH) at T = 0 K for a compound with the general composition TiaFebCocSbdSne was calculated according to the following formula: | (1) |
![[thin space (1/6-em)]](https://www.rsc.org/images/entities/char_2009.gif) 000 k-points in the Brillouin zone.
000 k-points in the Brillouin zone.
3. Results and discussion
3.1. Homogeneity regions, phase relations and crystal structures of the Heusler phase in the system Ti–Fe–Sb
Fig. 2 presents the isothermal section of the system Ti–Fe–Sb as reported by Melnyk et al.26 One can see that the homogeneity region of the HH phase (τ1-Ti1+xFeSb) at 800 °C includes the stoichiometric composition TiFeSb with an extended homogeneity region (−0.2 ≤ x ≤ 0.27). However, our re-investigation of this system shows a significant discrepancy with these data. The EPMA of the microstructure of the as-cast sample TiFeSb (Fig. 3a) shows primary crystallization of τ2 with the composition Ti37.5Fe24.5Sb38 (at%) and a fine eutectic structure of the composition Ti21Fe60Sb19. After annealing at 950 and 800 °C the sample reveals at both temperatures two phases with compositions TiFe1.33Sb and Ti37.5Fe24.5Sb38, respectively. Although XPD clearly shows the presence of a cubic Heusler structure, none of the above mentioned compositions are included in the single phase region of τ1 as reported by Melnyk et al.26 SEM, EPMA and XPD for two additional compositions TiFe1.33Sb and TiFe2Sb in as-cast and annealed states (Fig. 3b and c) unambiguously show τ1 with the composition TiFe1.33Sb. Further investigations of the phase relations of the Heusler phase (Fig. 4) reveal that the homogeneity region for this compound at 800 °C exists with a constant antimony content of about 30 at% Sb but with Ti/Fe substitution characterized by the formula Ti1+xFe1.33−xSb (−0.17 ≤ x ≤ 0.25). The lattice parameters for this phase (Fig. 5) increase with increasing Ti content in line with the difference between the atomic radii of iron and titanium. The literature data on Ti1.27FeSb27 and Ti1.25FeSb26 fit well to this tendency because these compositions are located near the Ti-rich end of Ti1+xFe1.33−xSb established in this work (see Fig. 4). The literature data reported for TiFeSb,24,25,28,44 Ti0.8FeSb26 and TiFe1.5Sb31 do not obey the chemical formula Ti1+xFe1.33−xSb and therefore they are plotted in Fig. 6 as a function of Ti/(Fe + Ti). One may note that the lattice parameters reported for TiFeSb and Ti0.8FeSb drop out from the general tendency and may be explained by incorrect compositions assigned for HH. It should be noted that the lattice parameters for “TiFeSb”24,25,28,44 are similar to those obtained in this work for a sample with this nominal composition, but the composition of the HH phase in this sample is TiFe1.33Sb. Similarly, the lattice parameter reported for Ti0.8FeSb26 corresponds to our Fe-rich end of the solid solution at x = −0.17 (Ti0.83Fe1.5Sb).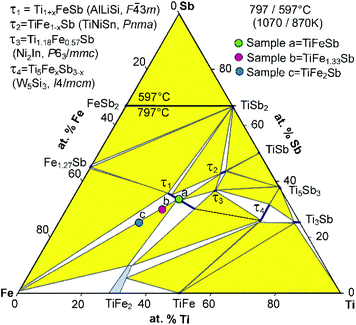 | ||
| Fig. 2 An isothermal section at 800 °C of the phase diagram Ti–Fe–Sb after ref. 57 based on the original work of Melnyk et al.26 The colored filled circles refer to sample compositions (a, b, c) in this investigation. | ||
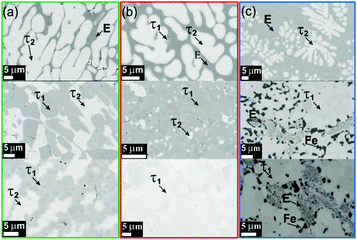 | ||
| Fig. 3 Microstructures of TiFeSb (a), TiFe1.33Sb (b) and TiFe2Sb (c). Top row: as cast alloys; middle row: alloys annealed at 950 °C; lower row: alloys annealed at 800 °C. The labels (and color frames) correspond to the alloys (a, b, c) shown in Fig. 2. | ||
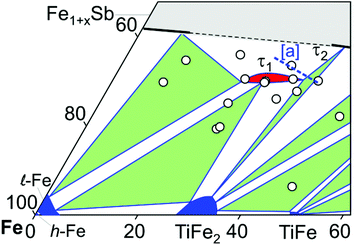 | ||
| Fig. 4 A partial isothermal section of the Ti–Fe–Sb system at 800 °C (this work); the vertices of the three-phase equilibria after EPMA; [a] the dashed line indicates the homogeneity region of the HH phase after ref. 26. | ||
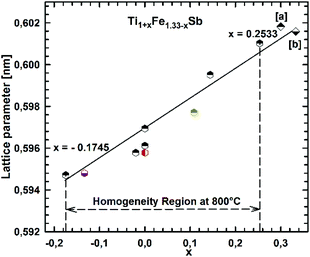 | ||
| Fig. 5 The compositional dependence of lattice parameters for Ti1+xFe1.33−xSb. [a] ref. 26 and [b] ref. 27. | ||
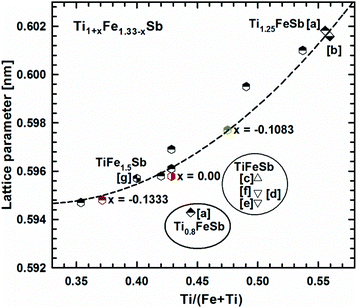 | ||
| Fig. 6 The compositional dependence of lattice parameters for Ti1+xFe1.33−xSb. [a] ref. 26, [b] ref. 27, [c] ref. 24, [d] ref. 44, [e] ref. 25, [f] ref. 28, and [g] ref. 31. | ||
The significant shift of the location of τ1 to Fe rich compositions at first glance may raise doubts on the non-centrosymmetric crystal symmetry (F![[4 with combining macron]](https://www.rsc.org/images/entities/char_0034_0304.gif) 3m) for this compound: τ1 might crystallize in the centrosymmetric space group (Fm
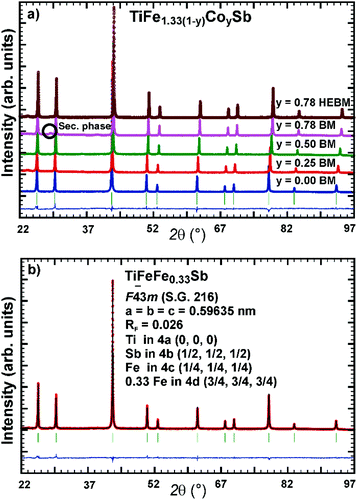
3m) for this compound: τ1 might crystallize in the centrosymmetric space group (Fm![[3 with combining macron]](https://www.rsc.org/images/entities/char_0033_0304.gif) m), or even structures with both symmetries may occur within the homogeneity region. However, Rietveld refinements of the X-ray powder diffraction data for a single-phase sample TiFe1.33Sb were performed applying the crystallographic model (SG Fm
m), or even structures with both symmetries may occur within the homogeneity region. However, Rietveld refinements of the X-ray powder diffraction data for a single-phase sample TiFe1.33Sb were performed applying the crystallographic model (SG Fm![[3 with combining macron]](https://www.rsc.org/images/entities/char_0033_0304.gif) m) proposed by Naghibolashrafi et al.31 The refinement reveals the composition TiFe1.39(2)Sb with the reliability factors RI = 0.083 and RF = 0.047 being close to that (RI = 0.1) obtained recently for this symmetry.31 In contrast to this, refinements in the non-centrosymmetric SG F
m) proposed by Naghibolashrafi et al.31 The refinement reveals the composition TiFe1.39(2)Sb with the reliability factors RI = 0.083 and RF = 0.047 being close to that (RI = 0.1) obtained recently for this symmetry.31 In contrast to this, refinements in the non-centrosymmetric SG F![[4 with combining macron]](https://www.rsc.org/images/entities/char_0034_0304.gif) 3m yield a much better fit to the experimental XPD intensities (RI = 0.033 and RF = 0.026) and composition of TiFe1.26(2)Sb. When the composition was fixed in correspondence with EPMA (TiFe1.33Sb), the reliability factors of RI = 0.045 and RF = 0.030 were still significantly lower than those for the centrosymmetric SG Fm
3m yield a much better fit to the experimental XPD intensities (RI = 0.033 and RF = 0.026) and composition of TiFe1.26(2)Sb. When the composition was fixed in correspondence with EPMA (TiFe1.33Sb), the reliability factors of RI = 0.045 and RF = 0.030 were still significantly lower than those for the centrosymmetric SG Fm![[3 with combining macron]](https://www.rsc.org/images/entities/char_0033_0304.gif) m. The Fe atoms were found to fully occupy the 4b site (1/4, 1/4, 1/4) of the structure (occ. = 0.99(1)) while the remaining iron atoms fill the 4d site (3/4, 3/4, 3/4). It should be noted here that all refinements for the three compositions shown in Fig. 4 within the homogeneity region of the Heusler phase do confirm non-centrosymmetry. Although the refinement of the XPD intensity allowed one to determine the symmetry of this compound, we were unable to determine reliably the site preference with Ti/Fe substitution in the solid solution Ti1+xFe1.33−xSb, but details of the most stable atom site distribution are available from our DFT calculations (see the following section). It is important to note that no additional reflections were observed in the XPD profiles (from the samples annealed at 950 and 800 °C) which could confirm the 8-fold unit cell claimed by Syztula and Bazela-Wrobel.28
m. The Fe atoms were found to fully occupy the 4b site (1/4, 1/4, 1/4) of the structure (occ. = 0.99(1)) while the remaining iron atoms fill the 4d site (3/4, 3/4, 3/4). It should be noted here that all refinements for the three compositions shown in Fig. 4 within the homogeneity region of the Heusler phase do confirm non-centrosymmetry. Although the refinement of the XPD intensity allowed one to determine the symmetry of this compound, we were unable to determine reliably the site preference with Ti/Fe substitution in the solid solution Ti1+xFe1.33−xSb, but details of the most stable atom site distribution are available from our DFT calculations (see the following section). It is important to note that no additional reflections were observed in the XPD profiles (from the samples annealed at 950 and 800 °C) which could confirm the 8-fold unit cell claimed by Syztula and Bazela-Wrobel.28
3.2. The DFT study of the Heusler phase in the Ti–Fe–Sb system
DFT calculations of the Heusler phase in the Ti–Fe–Sb system were conducted in two steps: (i) modeling of the TiFe1+xSb interstitial solid solution to explain the experimentally established composition TiFe1.33Sb of the Heusler phase and (ii) modeling of the Ti1+xFe1.25−xSb substitutional solid solution to explain the Ti1+xFe1.33−xSb homogeneity region, and revealing the mechanism of the Fe/Ti substitution. To model the TiFe1+xSb solid solution, the following compositions were used: x = 0, 0.25, 0.5, 0.75, and 1 for a single unit cell and x = 0.125 and 0.375 for a doubled cell (Table 2). The values of the lattice parameter a for x = 0.125 and 0.375 were not used as they are systematically higher due to the effect of the doubled unit cell in one direction. It is obvious from Fig. 7 that filling the vacancies at the 4d site with additional Fe atoms is energetically favorable up to x ∼ 0.375, where the minimum of the concentration dependent heat of formation is observed. The minimum is quite sharp, thus excluding the existence of a significant homogeneity region towards the Fe-rich corner of the Ti–Fe–Sb system. This result is in good agreement with the EPMA and XPD data of the Heusler phase composition TiFe1.33Sb and earlier DFT modeling of TiFe1+xSb reported in ref. 31, where the most stable composition was predicted to be TiFe1.5Sb for the centrosymmetric symmetry Fm![[3 with combining macron]](https://www.rsc.org/images/entities/char_0033_0304.gif) m. Moreover, the authors31 predicted for TiFe1.5Sb the R3m symmetry with Fe/vacancy ordering and nonmagnetic semiconducting properties. The lattice parameter a increases with x (Fig. 8) revealing almost linear concentration dependence. A visible change in the slope is observed at x ∼ 0.4, presumably corresponding to a change of bonding between the [Fe] and the [Ti, Sb] sublattices as a result of a symmetry change.
m. Moreover, the authors31 predicted for TiFe1.5Sb the R3m symmetry with Fe/vacancy ordering and nonmagnetic semiconducting properties. The lattice parameter a increases with x (Fig. 8) revealing almost linear concentration dependence. A visible change in the slope is observed at x ∼ 0.4, presumably corresponding to a change of bonding between the [Fe] and the [Ti, Sb] sublattices as a result of a symmetry change.
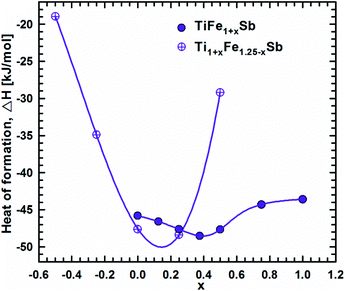 | ||
| Fig. 7 Heat of formation as a function of composition along the TiFe1+xSb and Ti1+xFe1.25−xSb solid solution. | ||
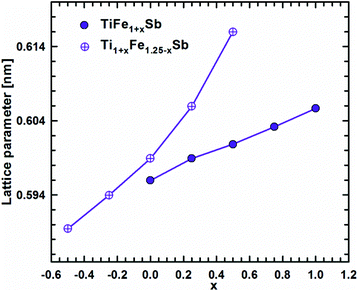 | ||
| Fig. 8 Lattice parameter versus Fe-concentration within the TiFe1+xSb and Ti1+xFe1.25−xSb solid solution. | ||
| Composition | 4a (0 0 0) | 4b (1/2 1/2 1/2) | 4c (1/4 1/4 1/4) | 4d (3/4 3/4 3/4) | ΔHf | a | B |
|---|---|---|---|---|---|---|---|
| a Three closest atoms at the 4c site to the selected atom at the 4d site. | |||||||
| Ti0.5Fe1.75Sb | Ti2Fe2 | Sb4 | Fe4 | Fe1 | −196.394 | 0.58944 | 158.6 |
| Ti1Fe3 | Sb4 | Fe4 | Ti1 | −25.126 | 0.59322 | 151.0 | |
| Ti1Fe3 | Sb4 | Fe3Ti1 | Fe1 | +31.622 | 0.59377 | 153.3 | |
| Ti2 | Sb4 | Fe4 | Fe3 | −125.350 | 0.59455 | 156.0 | |
| Ti0.75Fe1.5Sb | Ti3Fe1 | Sb4 | Fe4 | Fe1 | −361.468 | 0.59396 | 157.4 |
| Ti2Fe2 | Sb4 | Fe4 | Ti1 | −181.325 | 0.59760 | 150.1 | |
| Ti2Fe2 | Sb4 | Fe3Ti1 | Fe1 | −78.819 | 0.59881 | 150.2 | |
| Ti3 | Sb4 | Fe4 | Fe2 | −308.531 | 0.59767 | 156.4 | |
| TiFe1.25Sb | Ti4 | Sb4 | Fe4 | Fe1 | −493.595 | 0.59891 | 157.4 |
| Ti1.25FeSb | Ti4 | Sb4 | Fe4 | Ti1 | −501.363 | 0.60593 | 150.6 |
| Ti4 | Sb4 | Fe3Ti1 | Fe1 | −265.226 | 0.60887 | 144.7 | |
| Ti1.25FeSb32 | 0.6035 | 143.4 | |||||
| Ti1.33FeSb | Ti4 | Sb3 | Fe3 | — | −72.353 | 0.58567 | 118.4 |
| Ti1.5Fe0.75Sb | Ti4 | Sb4 | Fe3Ti1 | Ti1 | −302.487 | 0.61598 | 139.3 |
| Ti4 | Sb4 | Fe2Ti2 | Fe1 | −62.938 | 0.61857 | 130.2 | |
| TiFeSb | Ti4 | Sb4 | Fe4 | — | −474.760 | 0.59596 | 145.4 |
| TiFeSb55 | 0.59466 | ||||||
| TiFeSb32 | 0.5978 | 119.0 | |||||
| TiFe1.125Sb (doubled cell) | — | — | — | — | −482.922 | — | — |
| TiFe1.375Sb (doubled cell) | — | — | — | — | −502.863 | — | — |
| TiFe1.5Sb | Ti4 | Sb4 | Fe4 | Fe2 | −493.957 | 0.60083 | 173.8 |
| TiFe1.75Sb | Ti4 | Sb4 | Fe4 | Fe3 | −459.058 | 0.60317 | 188.6 |
| TiFe2Sb | Ti4 | Sb4 | Fe4 | Fe4 | −451.753 | 0.60566 | 237.9 |
| TiCo0.25Fe0.75Sb | Ti4 | Sb4 | Fe3Co1 | — | −521.144 | 0.59588 | 142.0 |
| TiCo0.5Fe0.5Sb | Ti4 | Sb4 | Fe2Co2 | — | −571.679 | 0.59523 | 142.0 |
| TiCo0.75Fe0.25Sb | Ti4 | Sb4 | Fe1Co3 | — | −627.724 | 0.59411 | 143.5 |
| TiCoSb | Ti4 | Sb4 | Co4 | — | −687.170 | 0.59259 | 149.9 |
| TiCoSb56 | 0.5886 | ||||||
| TiCo1.25Sb | Ti4 | Sb4 | Co4 | Co1 | −523.578 | 0.59882 | 154.3 |
| TiFeCo0.25Sb | Ti4 | Sb4 | Fe4 | Co1 | −467.293 | 0.59942 | 155.8 |
| Fe1(4d)–Fe2Co1(4c)a | Ti4 | Sb4 | Fe3Co1 | Fe1 | −517.447 | 0.59838 | 162.6 |
| Fe1(4d)–Fe3(4c)a | Ti4 | Sb4 | Fe3Co1 | Fe1 | −530.320 | 0.59860 | 162.1 |
| Ti4 | Sb4 | Fe2Co1 | Fe2 | −411.236 | 0.59933 | 160.1 | |
| Ti4 | Sb4 | Fe3 | Fe1Co1 | −404.957 | 0.59928 | 159.9 | |
| TiFe0.75Co0.5Sb | Ti4 | Sb4 | Fe3Co1 | Co1 | −494.306 | 0.59914 | 160.1 |
| Co1(4d)–Fe2Co1(4c)a | |||||||
| Co1(4d)–Fe3(4c)a | Ti4 | Sb4 | Fe3Co1 | Co1 | −505.128 | 0.59902 | 160.4 |
| Fe1(4d)–Fe2Co1(4c)a | Ti4 | Sb4 | Fe2Co2 | Fe1 | −548.500 | 0.59814 | 162.3 |
| Fe1(4d)–Fe1Co2(4c)a | Ti4 | Sb4 | Fe2Co2 | Fe1 | −531.230 | 0.59834 | 162.0 |
| TiFe0.5Co0.75Sb | Ti4 | Sb4 | Fe1Co3 | Fe1 | −542.314 | 0.59850 | 161.0 |
| Fe1(4d)–Fe1Co2(4c)a | |||||||
| Fe1(4d)–Co2Fe1(4c)a | Ti4 | Sb4 | Fe1Co3 | Fe1 | −526.614 | 0.59863 | 160.9 |
| Co1(4d)–Fe1Co2(4c)a | Ti4 | Sb4 | Fe2Co2 | Co1 | −518.011 | 0.59868 | 160.5 |
| Co1(4d)–Fe2Co1(4c)a | Ti4 | Sb4 | Fe2Co2 | Co1 | −528.331 | 0.59856 | 160.8 |
| TiFe0.25CoSb | Ti4 | Sb4 | Co4 | Fe1 | −519.361 | 0.59877 | 155.1 |
| Co1(4d)–Fe1Co2(4c)a | Ti4 | Sb4 | Fe1Co3 | Co1 | −538.054 | 0.59823 | 160.8 |
| Co1(4d)–Co3(4c)a | Ti4 | Sb4 | Fe1Co3 | Co1 | −524.301 | 0.59883 | 159.8 |
| Fe1(4d)–Co3(4c)a | Ti4 | Sb4 | Co3 | Fe1Co1 | −375.284 | 0.60061 | 154.6 |
| TiCoSb0.75Sn0.25 | Ti4 | Sb3Sn1 | Co4 | — | −589.923 | 0.59616 | 148.0 |
Modeling of the Ti1+xFe1.25−xSb solid solution is more complex due to several possible crystallographic configurations for the compositions: x = −0.5, −0.25, 0, 0.25, and 0.5 which are listed in Table 2 covering the experimentally established homogeneity region Ti1+xFe1.33−xSb (−0.17 ≤ x ≤ 0.25 at 800 °C). At the composition Ti0.5Fe1.75Sb, which corresponds to x ≈ −0.5, the most favorable arrangement of atoms is found for the following configuration: the 4a site is occupied by a mixture of Ti2Fe2 atoms, whereas the 4c and the 4b sites are solely occupied by Fe and Sb atoms, respectively, and the 4d site is partially occupied (25% – 1 atom) by additional Fe atoms. An attempt at substituting one Fe atom at the 4d site by Ti as well as three Ti atoms at the 4a site by Fe leads to a less negative heat of formation. A substitution of Fe by Ti at the 4c site and Ti by Fe at the 4a site is energetically unfavorable, yielding a positive heat of formation. Even the introduction of some vacancies at 4a with a three Fe atom configuration for this composition is similar to the previous case, but contains more Ti and less Fe atoms. For TiFe1.25Sb (x = 0) only one configuration was tested, corresponding to the fully filled 4a, 4b, and 4c sites with Ti, Sb, and Fe atoms, respectively and the 4d site filled by one additional Fe atom. Two possible configurations were tested for Ti1.25FeSb (x = 0.25): in one case additional Ti atoms completely substitute Fe at the 4d site, and in the other configurations they partially substitute Fe in 4c. For the first configuration, the heat of formation appeared to be almost two times more negative than that for the second case. For the composition Ti1.5Fe0.75Sb (x = 0.5), the most energetically favorable configuration consists of completely filled 4a and 4b sites with Ti and Sb, respectively, an Fe3Ti mixture at the 4c site and only one Ti atom in the 4d site. A configuration where the 4c site consists of an Fe2Ti2 mixture, while the 4d site is partially occupied by one additional Fe atom, appeared to be much worse. Additionally, a Ti1.33FeSb composition consisting of 4 Ti atoms in 4a, 3 Sb atoms in 4b, and 3 Fe atoms in 4c was tested, but the heat of formation appeared to be less negative than for Ti1.25FeSb. The substitution mechanism was established by the selection of the best configuration for each composition. In the x < 0 range of the solid solution, additional Fe atoms substitute Ti atoms at 4a, whilst the 4d site is partially occupied by one Fe atom, and remains unchanged. In the range x > 0, Ti atoms at first completely substitute Fe atoms at the 4d site, and only after that, Fe atoms at the 4c site. The formation of the Ti1+xFe1.25−xSb solid solution is an exothermal process (Fig. 7) with a broad minimum at the most stable composition (x ≈ 0.15). Unfortunately, the lack of heat-of-formation data for the remaining phases of the Ti–Fe–Sb system does not allow the construction of tangent lines in order to determine the boundaries of the Ti1+xFe1.25−xSb homogeneity region. With increasing x, the lattice parameter a increases (Fig. 8), but the dependence is nonlinear, which is in a good agreement with the experimental data for the Ti1+xFe1.33−xSb solid solution (see Fig. 6).
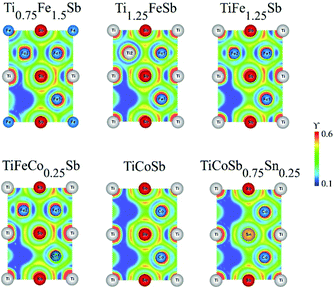
To study the effect of substitution in the Ti1+xFe1.25−xSb solid solution, the charge distribution as derived by the electron localization function (ELF) was calculated (Fig. 9). In TiFe1.25Sb the distribution of ELF around the Ti atoms in 4a is almost spherical. In addition, ELF indicates distinctly different bonding between Fe1 and Sb, compared to that between Fe2 and Sb. Due to charge transfer from Ti to Fe, some localized ELF, shifted to Fe1, is observed between Fe1 and Ti. Such localization, however, is absent between Fe2 and Ti. In Ti0.75Fe1.5Sb, where Ti atoms are partly substituted by additional Fe atoms, the ELF localization between Fe at the 4a site and Fe1 is somewhat lower than that between Fe1 and Ti. The ELF distribution around Fe2 atoms remains the same as in TiFe1.25Sb. With increasing Ti content up to Ti1.25FeSb, i.e., a partial occupation of the 4d site by Ti2 atoms, the ELF localization between Fe1 and Ti/Sb increases. The ELF distribution around Ti2 atoms looks almost the same as around Fe2 atoms in TiFe1.25Sb. Within the solubility region the bonds between Fe1 and Ti/Sb atoms remain more or less the same, and Ti/Fe or Fe/Ti substitutions do not have significant effects on the stability of the structure.
Physical properties derived from the present DFT calculations are discussed in the following paragraph. The residual resistivity, as well as the distribution of the density of states of Ti1+xFe1.33−xSb, were modeled by using the KKR-CPA method for several concentrations: x = −0.2, 0, 0.1, 0.2, and 0.3 (Table 3). The lowest residual resistivity (the lowest structural disorder) is observed in TiFe1.33Sb. It increases in Ti0.8Fe1.53Sb and Ti1.1Fe1.23Sb due to the statistical mixtures in both the 4a and 4d sites. However, with an increase of Ti, x > 0.1, the effect of disorder decreases at the 4d site generating a decreasing residual resistivity. This result is in a good agreement with the experimental data. The energy dependent density of states (Fig. 10a) of TiFe1.33Sb exhibits a band gap, with the Fermi level located in the valence band. The effective band gap is reduced due to the presence of a localized maximum inside the gap at ∼0.75 eV. This maximum contains an almost equal contribution of Fe1 and Fe2 electronic states and a somewhat lower contribution of Ti and Sb states. At the composition Ti0.8Fe1.53Sb the DOS distribution (Fig. 10b) reveals a filling of the band gap, mainly by Fe states from the 4c and 4d sites and the Fermi level is located at these states. At a higher Ti content, Ti1.1Fe1.23Sb (Fig. 10c), two localized maxima are formed by Fe and Ti states inside the band gap, with the Fermi level being located in the valence band. As a consequence, the Seebeck coefficient for x = 0 and x = 0.1 should have a positive sign while the resistivity data could exhibit a metal to insulator like transition with different mechanisms of conductivity. It should be noted that in all calculations no spin polarized DOS was observed, requiring a paramagnetic behavior for the samples studied. This is interesting, as for hypothetically ordered TiFeSb, Tobola et al.45 obtained a DOS polarization and a total magnetic moment of 0.78μB. The authors stated that TiFeSb is a metal, but in fact it is a semiconductor with the Fermi level situated in the valence band; as a result, a metallic behavior of the resistivity is observed. An attempt by Azar et al.32 at modeling Ti1+xFeSb showed that TiFeSb has the lowest formation energy. The equilibrated lattice parameters of Ti1.25FeSb and TiFeSb are in agreement with our calculations (Table 2): the bulk modulus for TiFeSb obtained by Azar et al.32 is, however, somewhat lower. The authors have shown a spin polarization of the DOS spectra for Ti1.25FeSb by using a Tran–Blaha parametrization of the modified Becke–Johnson exchange potential, which is absent in the case of the PBE exchange–correlation functional. They also noted the non-magnetic behavior of Ti1.25FeSb.
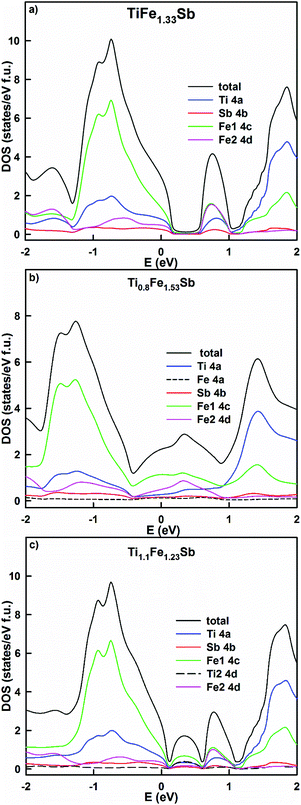 | ||
| Fig. 10 The distribution of the total and partial densities of states in TiFe1.33Sb (a), Ti0.8Fe1.53Sb (b) and Ti1.1Fe1.23Sb (c). The Fermi level is at E = 0 eV. | ||
| Composition | ρ0 | N(EF) |
|---|---|---|
| Ti0.8Fe1.53Sb | 586.7 | 2.22 |
| TiFe1.33Sb | 286.3 | 2.98 |
| Ti1.1Fe1.23Sb | 675.7 | 2.44 |
| Ti1.2Fe1.13Sb | 583.7 | 1.56 |
| Ti1.3Fe1.03Sb | 307.8 | 2.37 |
| TiFeCo0.25Sb | — | 2.66 |
| TiFe0.66Co0.5Sb | — | 2.24 |
| TiFe0.33Co0.75Sb | — | 0.96 |
| TiCoSb | — | 0.40 |
| TiCoSb0.75Sn0.25 | — | 3.66 |
| TiFe0.43Co0.68Sb0.88Sn0.12 | — | 2.48 |
| TiFe0.17Co0.88Sb0.88Sn0.12 | — | 0.97 |
3.3. Magnetic susceptibility, Mössbauer spectroscopy and specific heat of TiFe1.33Sb
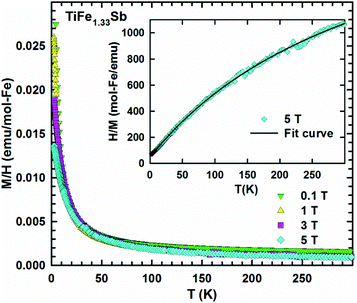
In order to check the magnetic ground state of TiFe1.33Sb and to corroborate our DFT results, specific heat (Cp), DC-magnetic susceptibility, magnetization and Mössbauer measurements have been performed from 1.5 to 300 K. The temperature and field dependent magnetization (Fig. 11) reveal a Curie–Weiss type paramagnetic behavior within the whole temperature range, which is superimposed by a small, almost temperature independent ferromagnetic component. An intrinsically paramagnetic state of TiFe1.33Sb is corroborated by Mössbauer spectra (see below); accordingly, we attribute the small ferromagnetic component to iron impurities with a molar fraction of less than 0.1% (corresponding to a saturated moment of about 0.003μB per Fe-atom). Thus, the inverse magnetic susceptibility 1/χ(T) = H/M(T) (5 T, inset of Fig. 11) is analyzed in terms of a modified Curie–Weiss law, χ(T) = χ0 + C/(T − Θp), where χ0 relates to a temperature independent component, Θp is the paramagnetic Curie–Weiss temperature, and C is the Curie constant, which is used to calculate the effective paramagnetic moment, μeff. The corresponding fit to the experimental data is displayed by a solid line. The temperature independent component χ0 = 4.3 × 10⁻³ emu per mol-Fe is essentially an artifact of the above mentioned saturated moment of iron impurities. The intrinsic susceptibility of TiFe1.33Sb is Curie–Weiss paramagnetic with Θp = −8 K and C = 0.154 emu K per mol-Fe. The latter reveals an effective paramagnetic moment of 1.11μB per Fe-atom.Fig. 12 shows the temperature dependent heat capacity Cp plotted as Cp/T versus T of TiFe1.33Sb. A distinct low temperature-increase is obtained indicating an evolution of magnetic short range or spin-fluctuation-type correlations. A magnetic phase transition is not observed within the measured temperature range.
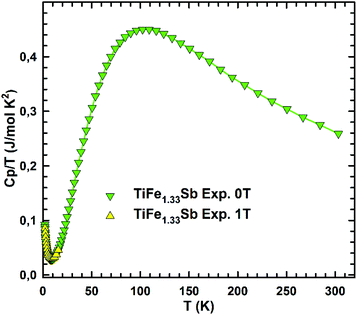 | ||
| Fig. 12 The temperature dependent heat capacity, Cp(T)/T, of TiFe1.33Sb measured at zero field and at 1 T externally applied magnetic field. | ||
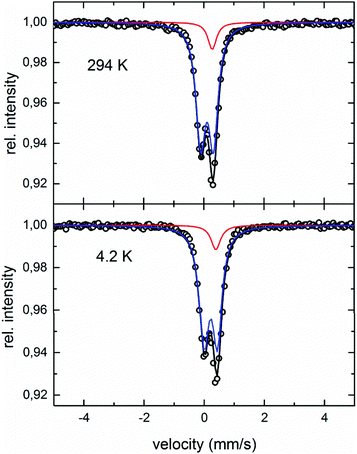
Fig. 13 shows the Mössbauer spectra obtained at 294 K and 4.2 K. Both spectra can be analysed by a superposition of two subspectra, one doublet and one singlet with an intensity ratio of 0.9![[thin space (1/6-em)]](https://www.rsc.org/images/entities/char_2009.gif) :
:![[thin space (1/6-em)]](https://www.rsc.org/images/entities/char_2009.gif) 0.1. Values for the center shift are 0.279 mm s−1 (singlet) and 0.108 mm s−1 (doublet) for the 294 K spectrum, as well as 0.400 mm s−1 (singlet) and 0.220 mm s−1 (doublet) for 4.2 K, respectively. The quadrupole splitting changes from 0.211 mm s−1 to 0.220 mm s−1, with temperature decreasing from 294 K to 4.2 K. The half-width of 0.18 (294 K) and 0.19 (4.2 K) is approximately 50% larger than for the respective α-Fe calibration spectrum, pointing to the small scatter of the hyperfine parameter between crystallographically identical sites. No sign of magnetic components is found in the temperature range investigated. According to the crystallographic model obtained from XRD-analyses, 4 Fe atoms occupy the 4c sites, and 1.33 Fe atoms are distributed over the 4d sites. This corresponds to an occupation number of 0.33 of Fe on the 4d sites. Assuming a purely random distribution of Fe atoms over the 4d sites, the probability to find no Fe atom in the 4d site around one 4c site is 4.1%. In that case, the electronic surrounding around a 4c site is highly symmetric, with no quadrupole splitting. Therefore, this surrounding should be represented by the singlet in the Mössbauer spectra. For 95.9% of the 4d sites, one or more Fe atoms are in the next 4d shell, thus disturbing the symmetric charge distribution leading to the doublet in the spectrum. The fact that the intensity of the singlet (∼10%) is larger than the expected 4.1% indicates that the distribution of the Fe atoms over the 4d sites is not perfectly random.
0.1. Values for the center shift are 0.279 mm s−1 (singlet) and 0.108 mm s−1 (doublet) for the 294 K spectrum, as well as 0.400 mm s−1 (singlet) and 0.220 mm s−1 (doublet) for 4.2 K, respectively. The quadrupole splitting changes from 0.211 mm s−1 to 0.220 mm s−1, with temperature decreasing from 294 K to 4.2 K. The half-width of 0.18 (294 K) and 0.19 (4.2 K) is approximately 50% larger than for the respective α-Fe calibration spectrum, pointing to the small scatter of the hyperfine parameter between crystallographically identical sites. No sign of magnetic components is found in the temperature range investigated. According to the crystallographic model obtained from XRD-analyses, 4 Fe atoms occupy the 4c sites, and 1.33 Fe atoms are distributed over the 4d sites. This corresponds to an occupation number of 0.33 of Fe on the 4d sites. Assuming a purely random distribution of Fe atoms over the 4d sites, the probability to find no Fe atom in the 4d site around one 4c site is 4.1%. In that case, the electronic surrounding around a 4c site is highly symmetric, with no quadrupole splitting. Therefore, this surrounding should be represented by the singlet in the Mössbauer spectra. For 95.9% of the 4d sites, one or more Fe atoms are in the next 4d shell, thus disturbing the symmetric charge distribution leading to the doublet in the spectrum. The fact that the intensity of the singlet (∼10%) is larger than the expected 4.1% indicates that the distribution of the Fe atoms over the 4d sites is not perfectly random.
3.4. Isopleths TiFe1.33Sb–TiCoSb, TiFe0.665Co0.5Sb–TiCoSb0.75Sn0.25 and TiFe0.33Co0.75Sb–TiCoSb0.75Sn0.25
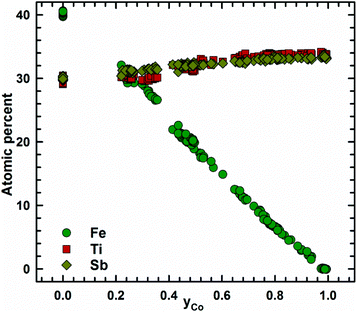
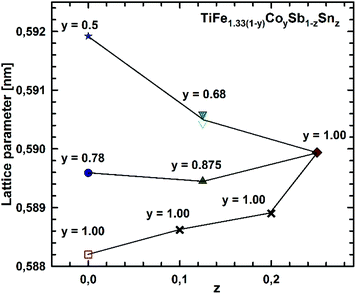
Micrographs of as-cast samples from these sections indicate that (i) the formation of the HH-phase occurs incongruently, and that (ii) the composition of this compound strongly varies from centre to rim of the grains. Only TiCoSb (stoichiometric composition) was found to be single-phase in the as-cast state. Fig. 14 represents the EPMA results for all measurements of the HH phase in the as-cast samples TiFe1.33(1−y)CoySb with nominal compositions y = 0.25, 0.5, 0.75 and 1.00. We can observe a gradual increase of Sb- and Ti-contents from 30 at% (at y = 0) to 33.3 at% (y = 1.00). After annealing the samples with y = 0.25 and 0.5 at 950 °C for 9 days, single-phase homogeneous samples were obtained; for a higher cobalt content (y = 0.75), however, annealing results in a still heterogeneous composition similar to that observed in the as-cast state. Almost complete equilibration (Fig. 15) was achieved by annealing the hot-pressed samples produced from fine powders after BM or HEBM (for details see Table 1). These data on the extension of the solid solution are inconsistent with an immiscibility gap reported to exist in TiFe1−yCoySb for 0.2 ≤ y ≤ 0.9.46 Unfortunately, these authors did not report the temperature at which this immiscibility gap should exist.The compositional dependence of the lattice parameters for TiFe1.33(1−y)CoySb in Fig. 16 reveals a strong decrease with increasing Co content due to a decrease of the total number of atoms in the unit cell, from 13.33 for TiFe1.33Sb to 12 for TiCoSb. The same consideration applies to the analysis of the lattice parameters for the sections TiFe0.665Co0.5Sb–TiCoSb0.75Sn0.25, TiFe0.33Co0.75Sb–TiCoSb0.75Sn0.25, and TiCoSb–TiCoSb0.75Sn0.25 (Fig. 17).
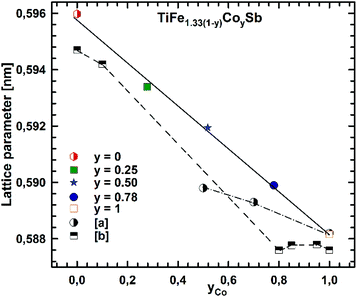 | ||
| Fig. 16 The compositional dependence of the lattice parameter for TiFe1.33(1−y)CoySb. The literature data for TiFe1−yCoySb: [a] ref. 20 and [b] ref. 25. | ||
3.5. The DFT study of the TiFe1.33−yCoySb1−zSnz solid solution
To model the Fe for Co substitution in the TiFe1.33Sb Heusler phase, two possible solid solutions were chosen: TiFe1−yCoySb (y = 0, 0.25, 0.5, 0.75, 1) and TiFe1.25−yCoySb (y = 0, 0.25, 0.5, 0.75, 1, 1.25) (Table 2). Modeling of TiFe1−yCoySb is quite straightforward as substitutions occur only at the 4c site, keeping the 4d site vacant. With increasing Co concentration, the absolute heat of formation increases almost linearly, while the concentration dependent lattice parameter a decreases and has nonlinear character. The difference in ΔHf between TiFeSb and TiCoSb is quite significant: >19.3 kJ mol−1.The presence of atoms at the 4d site makes TiFe1.25−yCoySb more complicated, as several atomic configurations are possible within the same composition. For the composition TiFeCo0.25Sb, five configurations were tested (Table 2). The most favorable one appeared when Co atoms substitute Fe atoms at 4c as a random mixture Fe3Co1. Moreover, the configuration where one Fe atom in 4d makes contact with the three Fe atoms in the 4c site is more preferable than an Fe atom in 4d that makes contact with two Fe atoms and one Co atom in 4c within one unit cell. A substitution of Fe in 4d by Co, as well as a Fe2Co1 mixture in 4c with 2 Fe atoms in 4d and three Fe atoms in 4c with a Fe1Co1 mixture in the 4d site, is energetically less favorable. TiFe0.75Co0.5Sb is realized in the most preferred configuration, where 4a and 4b sites are fully occupied by Ti and Sb atoms, respectively, whereas the 4c site is occupied by a mixture Fe2Co2, and the 4d site is occupied by one Fe atom coming in contact with two Fe and one Co atoms in the 4c site within one unit cell. A simultaneous substitution of Fe by Co atoms in 4c and 4d sites is less favorable. Further Fe by Co substitution in TiFe0.5Co0.75Sb was found to occur in a configuration, where Co atoms only substitute Fe in the 4c site, with one Fe atom in the 4d site brought into contact with two Co and one Fe atoms in 4c. The remaining configurations are characterized by a less negative heat of formation. For TiFe0.25CoSb, the most preferable configuration is where Co atoms completely substitute Fe atoms in 4d, and the 4c site is occupied by a statistical mixture Fe1Co3 with one Co atom in the 4d site coming in contact with two Co and one Fe atoms in 4c. A complete substitution of Fe at 4c by Co atoms, while keeping the 4d site partially occupied by Fe atoms, is less preferred, as well as vacancies and Co atoms at 4c and an Fe1Co1 mixture at 4d. For each of the selected compositions with the most negative heat of formation, the concentration dependence shows a local minimum at y ≈ 0.5, consistent with the lattice parameter exhibiting a similar behavior.
A combination of DFT data for the solid solutions TiFe1−yCoySb and TiFe1.25−yCoySb within the range 0 ≤ y ≤ 1.0 (Fig. 18 and 19) provides the substitution mechanism of Fe/Co: Co atoms initially substitute Fe at the 4c site, followed by the 4d site, emptying Fe at 4d for y ∼0.33. Further substitution occurs according to the TiFe1−yCoySb solid solution.
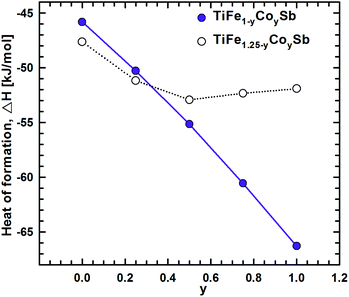 | ||
| Fig. 18 The composition dependence of the heat of formation for the solid solutions TiFe1−yCoySb and TiFe1.25−yCoySb. | ||
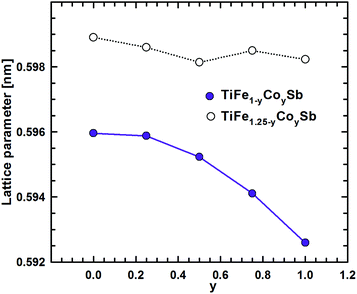 | ||
| Fig. 19 The composition dependence of the lattice parameter a for the solid solutions TiFe1−yCoySb and TiFe1.25−yCoySb. | ||
The electron localization functions (ELF) of TiFe1.25−yCoySb (Fig. 9) indicate that for TiFeCo0.25Sb the ELF distribution remains almost the same as in TiFe1.25Sb. A complete Fe/Co substitution with the formation of TiCoSb yields almost the same ELF distribution around Ti and Sb atoms and localization between Ti and the 3d transition metal at the 4c site. A partial substitution of Sb for Sn in TiCoSb0.75Sn0.25 significantly decreases the ELF localization between Co and Sn atoms, weakening the covalently bonded [Co(Sb/Sn)] sublattice, as being reflected in a less negative heat of formation and a higher lattice parameter in comparison with TiCoSb (Table 2).
The KKR-CPA calculations evidence that the density of states at the Fermi energy in TiFe1.33−yCoySb gradually decreases with increasing Co content as it shifts to the band gap (Table 3, Fig. 20), and is comparable to those obtained earlier for TiCoSb.45,47 This should lead to an increase of the resistivity and the Seebeck coefficient up to the compensation point of the semiconductor. Similarly it should lead to an increase of the thermoelectric power factor (PF), but at the same time the structure would become more ordered, which should increase the lattice thermal conductivity. The energy dependent DOS (Fig. 20) indicates that the localized maximum inside the band gap fades away with increasing Co content. It is interesting to note that according to Kaczmarska et al.47 the Seebeck coefficient at 300 K for TiCoSb ranges from −28 to −40 μV K−1, whereas Tobola et al.8 reports +270/−250 μV K−1. In fact, perfectly ordered TiCoSb should have the Fermi level at the middle of the gap giving zero Seebeck coefficient, as there are no sources of additional electrons or holes. An attempt at clarifying the nature of defects in TiCoSb48 showed that vacancies in any of the occupied crystallographic sites cause a DOS polarization and appearance of a magnetic moment, which is in contradiction to the experimental findings.45
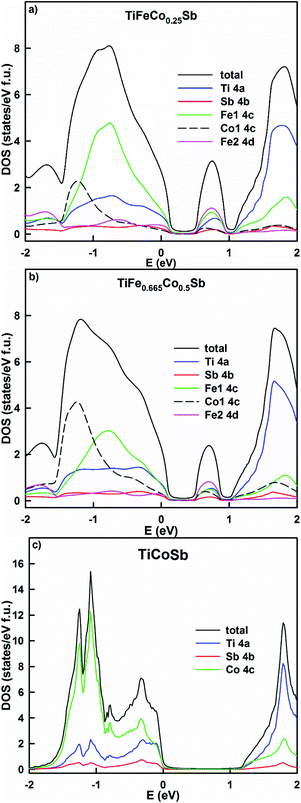 | ||
| Fig. 20 The distribution of the total and partial densities of states in TiFeCo0.25Sb (a), TiFe0.66Co0.5Sb (b) and TiCoSb (c). The Fermi level is at E = 0 eV. | ||
A partial substitution of Sb by Sn in TiCoSb0.75Sn0.25 shifts the Fermi level deeper into the valence band (Fig. 21a). In comparison with TiCoSb, the density of states increases, giving a lower resistivity and a lower Seebeck coefficient. A simultaneous substitution of Fe by Co and Sb by Sn in the alloys TiFe0.43Co0.68Sb0.88Sn0.12 and TiFe0.17Co0.88Sb0.88Sn0.12 (Fig. 21b and c) leads to the formation of a localized maximum inside the band gap in the first case and its shift to the valence band in the second case. The effective band gap is narrowed, but the density of states decreases in the alloy with the higher Co content, giving rise to a higher resistivity and Seebeck coefficient. In general, the overcompensation of the n-type semiconductor like TiCoSb with Sn should not increase the thermoelectric performance of the system due to the presence of carriers of both signs. Taking the DOS profiles into account, it is clear that the desired Sn content should be less than 0.1 in order to shift the Fermi level to the inflection point, where the Seebeck coefficient should be maximum. In all cases studied, no DOS polarization was observed, causing a paramagnetic state for the selected HH compositions. The paramagnetic behavior of TiCoSb0.75Sn0.25 is in agreement with the earlier results by Tobola et al.,45 where magnetic effects occur for z > 0.25 Sn. It is interesting to note a possible ferromagnetic behavior in CoTi1−xFexSb modeled by the KKR-CPA method, as well as a predicted spinodal alloy decomposition.49
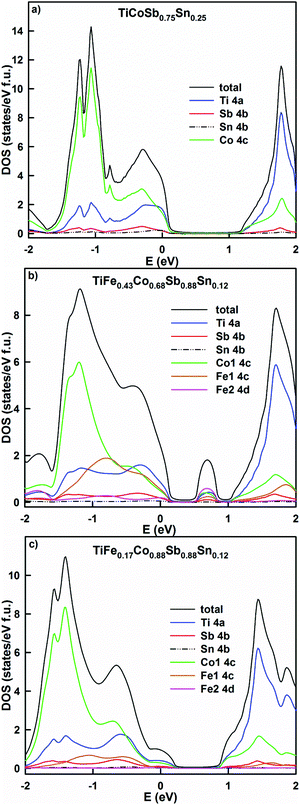 | ||
| Fig. 21 The distribution of the total and partial densities of states in TiCoSb0.75Sn0.25 (a), TiFe0.43Co0.68Sb0.88Sn0.12 (b) and TiFe0.17Co0.88Sb0.88Sn0.12 (c). The Fermi level is at E = 0 eV. | ||
3.6. TE properties for the HH phase [Ti1+xFe1.33−x]1−yTiyCoySb1−zSnz
In order to investigate the compositional dependence of TE properties for this HH-family, samples were prepared along four isopleths (Fig. 1): Ti1+xFe1.33−xSb, TiFe1.33Sb–TiCoSb, TiFe0.665Co0.5Sb–TiCoSb0.75Sn0.25 and TiFe0.33Co0.75Sb–TiCoSb0.75Sn0.25. In addition, the effects of different conditions for BM and annealing on the TE properties were studied for TiFe0.33Co0.75Sb. Fig. 22a and b present the temperature and compositional dependences of the transport properties of Ti1+xFe1.33−xSb for x = −0.133 (dR = 98.2%), x = 0.0 (for dR = 89.9 and 98.0%) and x = 0.108 (dR = 98.0%). The electrical resistivity of the Fe-rich sample (x = −0.133) shows semiconducting behavior, whereas for the two other samples (x = 0.108 and x = 0) a metallic behavior at low temperatures turns to a semiconducting one at about 550 and 650 K, respectively. All Seebeck temperature curves except the one for x = −0.133 reveal a pronounced maximum, from which the energy gap (Eg) can be calculated: | (2) |
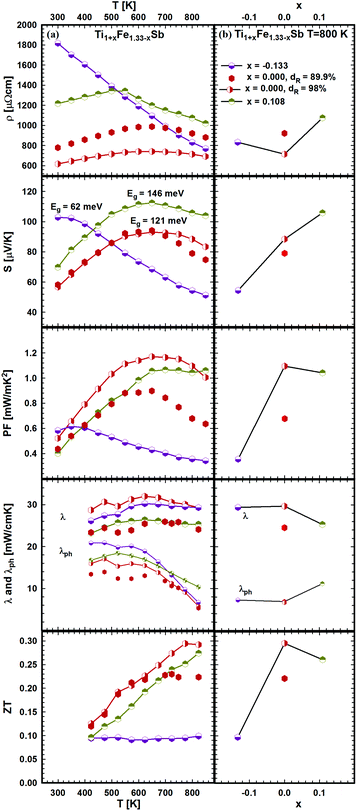 | ||
| Fig. 22 TE properties of Ti1+xFe1.33−xSb versus temperature (a – left panel) and composition (b – right panel). | ||
The results, summarized in Table 1, show that Eg changes distinctly from 146 meV (for x = 0.108) to 62 meV (for x = −0.133). Positive S(T) values indicate that the electronic transport is mostly due to holes as charge carriers. The total thermal conductivity increases with increasing Fe-content, whilst the phonon part shows an opposite behavior. The phonon thermal conductivity λph was taken from the difference λph = λ − λe (assuming the validity of the Wiedemann–Franz law, λe(T) ∼ L(T)T/ρ(T) with the Lorenz number L(T) derived from the measured Seebeck coefficient values and the Fermi-integrals as proposed by D. M. Rowe et al.50). Consequently the maximum value of ZT = 0.3 at 800 K appears for this series at x = 0. Considering the significant change of the transport properties in the series Ti1+xFe1.33−xSb, we suggest that the effect of Fe/Ti substitution on the electronic structure is very strong, resulting in a wide ZT range for this compound (0.1 ≤ ZT ≤ 0.3).
The effect of porosity on the mechanical properties of TiFe1.33Sb has been reported recently51 and was investigated for two samples with two different relative densities, dR = 89.9 and dR = 98.0% (see Fig. 22). As expected, the porosity has little effect on the thermopower, but it decreases both the electrical and thermal conductivities. As the effect on the electrical conductivity is stronger than on the thermal conductivity, the figure of merit is lower for the sample with higher porosity. Stadnyk et al.25 measured resistivity and thermopower for the composition TiFeSb in the temperature range from ∼75 to 375 K. The Seebeck coefficient at room temperature (∼30 μV K−1) is about 2–3 times lower than that obtained in this work for Ti1+xFe1.33−xSb (Fig. 22). On the other hand, the room temperature resistivity (∼6700 μΩ cm)25 is about 4–8 times higher. In Fig. 23a and b temperature and composition dependent physical properties of TiFe1.33(1−y)CoySb are displayed for y = 0.0, 0.25, 0.5 and 0.75, together with the data from the literature i.e. TiFe0.5Co0.5Sb and TiFe0.3Co0.7Sb20 and TiCoSb.19 The temperature dependent electrical resistivity evidences a change from a metallic (y = 0) to a semiconducting behavior for the cobalt rich compositions (y ≥ 0.5). All electrical resistivities collected throughout this work are lower than the values reported by Wu et al. The thermopower of these samples increases with increasing Co content. In parallel to the increasing electrical resistivities, the conductivity type changes from the hole to the electron dominated transport in TiCoSb. The thermopower values of this work are in the same range as those reported in the literature. Concomitantly with the electrical resistivity and thermopower, the maximum of the power factor shifts to higher temperatures with increasing Co content. However, the maximum power factor of TiFe0.33Co0.75Sb, PF = 1.33 mW mK−2, is lower than the value of 1.9 mW mK−2 reported for TiFe0.3Co0.7Sb.20 The total thermal conductivity for all investigated samples is also lower than the values reported by Wu et al.20 for the Fe/Co substituted compositions and for TiCoSb.19 The maximum ZT for the Fe/Co substituted compositions investigated is about 0.42 and is higher than that for the end-members TiFe1.33Sb (ZT800 K = 0.3) and TiCoSb (ZT800 K = 0.05 (ref. 19)). Only one significant discrepancy was observed between the ZT values of this investigation and the data reported in the literature for y = 0.5:20 there, TiFe0.5Co0.5Sb has a ZT800 K = 0.2, but TiFe0.665Co0.5Sb of this work has a ZT800 K = 0.39, showing a difference of almost by a factor of two. Most likely, this discrepancy is caused by the fact that the composition TiFe0.5Co0.5Sb investigated by Wu20 lies outside of the single-phase region; indeed, we found that TiFe0.5Co0.5Sb after annealing at 950 °C for 8 days contains about 20% of a secondary phase (τ2).
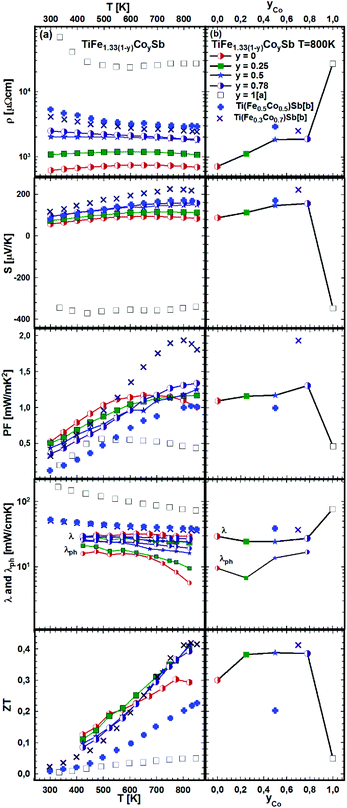 | ||
| Fig. 23 TE properties of TiFe1.33(1−y)CoySb versus temperature (a – left panel) and composition (b – right panel). Literature data: [a] ref. 19 and [b] ref. 20. | ||
It is known that a significant improvement of the TE performance can be achieved via nano-structuring. Our investigation of p- and n-type skutterudites52–54 shows that the figure of merit can be increased by almost 60% via HEBM of the samples. The effect of BM conditions (BM, HEBM and HEBM ann.) on the TE properties for the three samples with the same chemical composition TiFe0.29Co0.78Sb is summarized in Fig. 24a and b. All properties change to the better for the HEBM samples in comparison with BM alloys. The most prominent increase (about ∼35%) was observed for the Seebeck coefficient and consequently for the power factor (∼54%). It is worth mentioning that the thermal conductivity of HEBM samples is also increased by ∼50%, which results in a ZT-value close to that obtained for BM samples. Further annealing of HEBM samples at 950 °C for 9 days slightly increases the electrical resistivity but all other TE properties (thermopower, power factor and thermal conductivity) are decreased, resulting in a figure of merit, ZT = 0.44, which is an increase of 12% in comparison with the BM sample. We have to note that the effect of HEBM on TE properties for this HH composition is weaker and different from that observed for skutterudites;54 therefore, further optimization of the relevant parameters is needed.
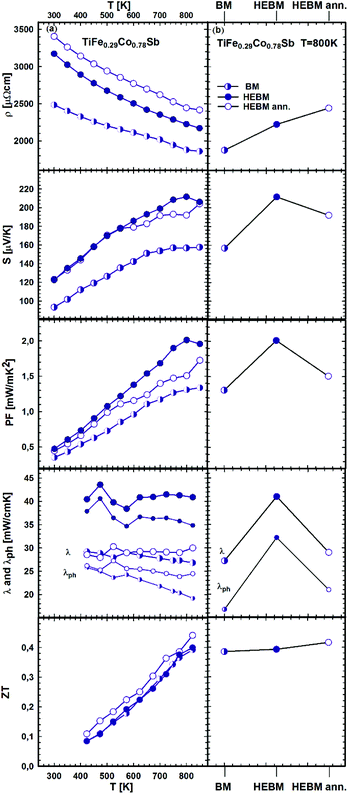 | ||
| Fig. 24 TE properties of TiFe0.29Co0.78Sb versus temperature (a – left panel) prepared under different conditions (b – right panel). | ||
As the effect of Sb/Sn substitution is known to be an efficient method for the optimization of the TE performance of HH p- and n-compositions,21 it was applied to the samples from the sections TiFe0.665Co0.5Sb-TiCoSb0.75Sn0.25 and TiFe0.33Co0.75Sb-TiCoSb0.75Sn0.25 as documented in Fig. 25a and b. The temperature dependent electrical resistivity shows that generally all samples are semiconductors; however, annealing the sample TiFe0.33Co0.75Sb0.875Sn0.125 at 950 °C for 9 days turns it to a metallic behavior at temperatures below 550 K. The compositional dependences of resistivity, Seebeck coefficient and thermal conductivity show rather different tendencies in these two series (Fig. 25b).
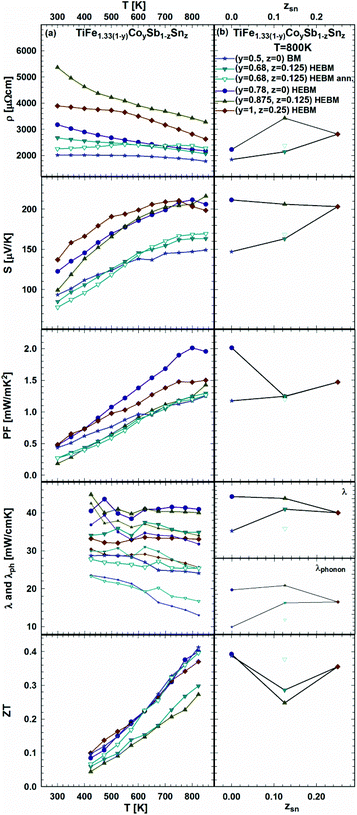 | ||
| Fig. 25 TE properties of TiFe1.33(1−y)CoySb1−zSnzversus temperature (a – left panel) and composition (b – right panel). | ||
Finally, the compositional dependences of ZT for both series are alike, i.e. giving the highest ZT = 0.4 at 825 K for the samples without Sn. Upon annealing, the HEBM sample TiFe0.33Co0.75Sb0.875Sn0.125 (open triangles in Fig. 25) shows a decrease of thermal conductivity similar to that shown in the previous series (see Fig. 24), resulting in an increase of ZT from 0.3 to 0.4 at 825 K.
4. Conclusion/summary
In order to investigate the phase relations in the ternary system Ti–Fe–Sb, SEM, EPMA and XPD were applied. The homogeneity region of the Heusler phase is significantly moved from stoichiometric TiFeSb to an Fe-rich composition with an extensive homogeneity region at 800 °C: Ti1+xFe1.33−xSb (−0.17 ≤ x ≤ 0.25). A DFT study revealed TiFe1.375Sb to be the most stable composition. In Ti1+xFe1.33−xSb for x < 0, the Ti atoms are substituted by Fe, and for x > 0 the Fe atoms (4d site) by Ti. In the isopleth TiFe1.33Sb–TiCoSb, Fe (4c site) is substituted by Co with decreasing Fe content at the 4d site. The DFT calculations of residual resistivity for the isopleths Ti1+xFe1.33−xSb, TiFe1.33Sb–TiCoSb, TiFe0.665Co0.5Sb–TiCoSb0.75Sn0.25 and TiFe0.33Co0.75Sb–TiCoSb0.75Sn0.25 are in good agreement with the experimental data but did not predict significant gains in thermoelectric performance.From dc magnetic susceptibility and 57Fe Mössbauer measurements, a paramagnetic behavior is observed for TiFe1.33Sb down to 4.2 K, with a Curie–Weiss temperature of −8 K and an effective moment of 1.11μB per Fe.
Ternary Ti1+xFe1.33−xSb exhibits a semi-conducting behavior for the Fe-rich composition (x = −0.133), but the conductivity type changes to metallic with increasing Ti content. The figure of merit (ZT800 K) in this solid solution changes from 0.1 to 0.3 at 800 K, and adopts the highest value for the composition TiFe1.33Sb. Further optimization of the TE performance was achieved via Fe/Co substitution resulting in a maximum value of ZT = 0.42 (at 825 K) for TiFe0.665Co0.5Sb. It was shown that dual Fe/Co and Sb/Sn substitutions do not drive an additional increase of ZT, whereas the optimization of the preparation route (by means of ball-milling techniques and heat treatments) increases the ZT-values by about 12%.
Conflicts of interest
There are no conflicts to declare.Acknowledgements
This work was supported by the Austrian Christian Doppler Association. A part of the study was funded by the Austrian Science Fund under project P24380.References
- J. He and T. M. Tritt, Advances in thermoelectric materials research: Looking back and moving forward, Science, 2017, 357(6358), eaak9997 CrossRef PubMed.
- L. Chen, X. Zeng, T. M. Tritt and S. J. Poon, Half-Heusler alloys for efficient thermoelectric power conversion, J. Electron. Mater., 2016, 45(11), 5554–5560 CrossRef CAS.
- Fitriani, R. Ovik, B. D. Long, M. C. Barma, M. Riaz, M. F. M. Sabri, S. M. Said and R. Saidur, A review on nanostructures of high-temperature thermoelectric materials for waste heat recovery, Renewable Sustainable Energy Rev., 2016, 64, 635–659 CrossRef CAS.
- L. Huang, Q. Zhang, B. Yuan, X. Lai, X. Yan and Z. Ren, Recent progress in half-Heusler thermoelectric materials, Mater. Res. Bull., 2016, 76, 107–112 CrossRef CAS.
- W. G. Zeier, J. Schmitt, G. Hautier, U. Aydemir, Z. M. Gibbs, C. Felser and G. J. Snyder, Engineering half-Heusler thermoelectric materials using Zintl chemistry, Nat. Rev. Mater., 2016, 1(6), 16032 CrossRef CAS.
- G. Schierning, R. Chavez, R. Schmechel, B. Balke, G. Rogl and P. Rogl, Concepts for medium-high to high temperature thermoelectric heat-to-electricity conversion: a review of selected materials and basic considerations of module design, Transl. Mater. Res., 2015, 2 CAS , 025001.
- W. Jeitschko, Transition metal stannides with MgAgAs and MnCu2Al type structure, Metall. Trans., 1970, 1, 3159–3162 CAS.
- J. Tobola and J. Pierre, Electronic phase diagram of the XTZ (X = Fe, Co, Ni; T = Ti, V, Zr, Nb, Mn; Z = Sn, Sb) semi-Heusler compounds, J. Alloys Compd., 2000, 296, 243–252 CrossRef CAS.
- S. Bhattacharya, A. L. Pope, R. T. Littleton, T. M. Tritt, V. Ponnambalam, Y. Xia and S. J. Poon, Effect of Sb doping on the thermoelectric properties of Ti-based half Heusler compounds, TiNiSn1−xSbx, Appl. Phys. Lett., 2000, 77, 2476–2478 CrossRef CAS.
- S. Sakurada and N. Shutoh, Effect of Ti substitution on the thermoelectric properties of (Zr,Hf)NiSn half Heusler compounds, Appl. Phys. Lett., 2005, 86 CrossRef CAS , 082105.
- G. Rogl, P. Sauerschnig, Z. Rykavets, V. V. Romaka, P. Heinrich, B. Hinterleitner, A. Grytsiv, E. Bauer and P. Rogl, (V,Nb)-doped Half Heusler alloys based on {Ti,Zr,Hf}NiSn with high ZT, Acta Mater., 2017, 131, 336–348 CrossRef CAS.
- M. Schwall and B. Balke, Phase separation as a key to a thermoelectric high efficiency, Phys. Chem. Chem. Phys., 2013, 15(6), 1868–1872 RSC.
- L. Chen, Y. Liu, J. He, T. M. Tritt and S. J. Poon, High thermoelectric figure of merit by resonant dopant in half-Heusler alloys, AIP Adv., 2017, 7 Search PubMed , 065208.
- M. Gürth, G. Rogl, V. V. Romaka, A. Grytsiv, E. Bauer and P. Rogl, Thermoelectric high ZT half-Heusler alloys Ti1−x-yZrxHfyNiSn, Acta Mater., 2016, 104, 210–222 CrossRef.
- C. Fu, S. Bai, Y. Liu, Y. Tang, L. Chen, X. Zhao and T. Zhu, Realizing high figure of merit in heavy-band p-type half-Heusler thermoelectric materials, Nat. Commun., 2015, 6 Search PubMed , 8144.
- C. Fu, H. Wu, Y. Liu, J. He, X. Zhao and T. Zhu, Enhancing the figure of merit of heavy-band thermoelectric materials through hierarchical phonon scattering, Adv. Sci., 2016, 3 CAS , 1600035.
- R. He, D. Kraemer, J. Mao, L. Zeng, Q. Jie, Y. Lan, C. Li, J. Shuai, H. S. Kim, Y. Liu, D. Broido, C.-W. Chu, G. Chen and Z. Ren, Achieving high power factor and output power density in p-type half-Heuslers Nb1−xTixFeSb, Proc. Natl. Acad. Sci. U. S. A., 2016, 113(48), 13576–13581 CrossRef CAS PubMed.
- A. Tavassoli, F. Failamani, A. Grytsiv, G. Rogl, P. Heinrich, H. Müller, E. Bauer, M. Zehetbauer and P. Rogl, On the half-Heusler compounds Nb1−x{Ti,Zr,Hf}xFeSb: phase relations, thermoelectric properties at low and high temperature and mechanical properties, Acta Mater., 2017, 135, 263–276 CrossRef CAS.
- T. Sekimoto, K. Kurosaki, H. Muta and S. Yamanaka, Thermoelectric properties of (Ti,Zr)CoSnxSb1−x half-Heusler compounds, IEEE, 2006, 128–131 CAS.
- T. Wu, W. Jiang, X. Li, Y. Zhou and L. Chen, Thermoelectric properties of p-type Fe-doped TiCoSb half-Heusler compounds, J. Appl. Phys., 2007, 102 Search PubMed , 103705.
- E. Rausch, B. Balke, S. Ouardi and C. Felser, Enhanced thermoelectric performance in the p-type half-Heusler (TiZrHf)CoSb0.8Sn0.2 system via phase separation, Phys. Chem. Chem. Phys., 2014, 16, 25258–25262 RSC.
- J. M. Mena, E. Rausch, S. Ouardi, T. Gruhn, G. H. Fecher, H. G. Schoberth, H. Emmerich and C. Felser, Miscibility gap in the phase diagrams of thermoelectric half-Heusler materials CoTi1−xYxSb (Y = Sc, V, Mn, Fe), J. Electron. Mater., 2016, 45, 1382–1388 CrossRef CAS.
- P. I. Krypyakevych and V. Y. Markiv, Crystal structures of ternary compounds in the systems Ti(V)-Fe(Co,Ni)-Sn(Sb), Dopov. Akad. Nauk Ukr. RSR, 1963, 1606–1608 Search PubMed . (in Ukrainian).
- E. I. Gladyshevskii, V. Y. Markiv, Y. B. Kuz'ma and E. E. Cherkashyn, Crystal structure of some triple intermetallic compounds with titanium, Titan I Ego Splavy, 1963, 10, 71–73 Search PubMed; E. I. Gladyshevskii, V. Y. Markiv, Y. B. Kuz'ma and E. E. Cherkashin, Crystal structure of some ternary intermetallic titanium compounds, Titanium Alloys, 1966, 10, 73–75 Search PubMed.
- Y. V. Stadnyk, R. V. Skolozdra and G. A. Melnyk, Study of TiFeSb-TiNiSb, TiFeSb-TiCoSb phases intersolubility and properties of solid solutions, J. Thermoelectr., 1998, 3, 48–53 Search PubMed.
- G. Melnyk and W. Tremel, The titanium–iron–antimony ternary system and the crystal and electronic structure of the interstitial compound Ti5FeSb2, J. Alloys Compd., 2003, 349, 164–171 CrossRef CAS.
- R. V. Skolozdra, G. A. Melnik and L. G. Akselrud, Crystal structure of Ti1.27FeSb, Ti1.18Fe0.57Sb, and TiFe0.3Sb compounds, Kristallografiya, 1998, 43(3), 418–420 CAS.
- P. J. Syztula and W. Bazela-Wrobel, Crystal structures of CoMnSb and FeTiSb, Zesz. Nauk. Uniw. Jagiellonsk., Pr. Fiz., 1984, 723, 48–54 Search PubMed.
- A. Tavassoli, A. Grytsiv, G. Rogl, P. Rogl, E. Bauer and M. Zehetbauer, Isothermal sections Ti-Fe-Sb at 800 °C and 950 °C; TE-properties of p-type TiFe1−xCoxSb, 34th Annual International Conference on Thermoelectrics, ICT 2015, Dresden Germany Search PubMed.
- A. Tavassoli, A. Grytsiv, G. Rogl, P. Broz, E. Bauer, G. Giester, M. Zehetbauer and P. Rogl, On the half Heusler system Ti1−xFe1.33+xSb - TiCoSb with Sb/Sn substitution; phase relations, crystal structure and thermoelectric properties, 20th International Conference on Solid Compounds of Transition Elements, SCTE 2016, Saragoza, Spain Search PubMed.
- N. Naghibolashrafi, S. Keshavarz, V. I. Hegde, A. Gupta, W. H. Butler, J. Romero, K. Munira, P. Leclair, D. Mazumdar, J. Ma, A. W. Ghosh and C. Wolverton, Synthesis and characterization of Fe-Ti-Sb intermetallic compounds: Discovery of a new Slater-Pauling phase, Phys. Rev. B, 2016, 93 CrossRef CAS , 104424.
- S. M. Azar, A. A. Mousa and J. M. Khalifeh, Structural, electronic and magnetic properties of Ti1+xFeSb Heusler alloys, Intermetallics, 2017, 85, 197–205 CrossRef CAS.
- S. Sharma and P. Kumar, Investigation of electronic, magnetic and transport properties of full-Heusler alloys Fe2TiX (X = As and Sb), Chin. J. Phys., 2017, 55, 1972–1980 CrossRef CAS.
- W. Wacha, An integrated software system for X-ray powder analysis, Diploma Thesis, Vienna University of Technology, Vienna, Austria, 1989. (In German) Search PubMed.
- J. Rodriguez-Carvajal, Powder diffraction, Satellite Meeting of the 15th Congress of IUCr, Toulouse, France, 1990, p. 127 Search PubMed.
- J. Rodriguez-Carvajal, Recent advances in magnetic structure determination by neutron powder diffraction, Phys. B, 1993, 192, 55–69 CrossRef CAS.
- ELK Program package; http://63.sourceforge.net/ Search PubMed.
- J. P. Perdew, K. Burke and M. Ernzerhof, Generalized gradient approximation made simple, Phys. Rev. Lett., 1996, 77(18), 3865–3568 CrossRef CAS PubMed.
- P. Vinet, J. H. Rose, J. Ferrante and J. R. Smith, Universal features of the equation of state of solids, J. Phys.: Condens. Matter, 1989, 1, 1941–1964 CrossRef CAS.
- K. Momma and F. Izumi, VESTA 3 for three-dimensional visualization of crystal, volumetric and morphology data, J. Appl. Crystallogr., 2011, 44, 1272–1276 CrossRef CAS.
- W. Kohn and N. Rostoker, Solution of the Schrödinger equation in periodic lattices with an application to metallic lithium, Phys. Rev., 1954, 94, 1111–1120 CrossRef CAS.
- H. Ebert, The Munich SPR-KKR package, version 6.3, H. Ebert, http://ebert.cup.uni-muenchen.de/68 Search PubMed.
- S. H. Vosko, L. Wilk and M. Nusair, Accurate spin-dependent electron liquid correlation energies for local spin density calculations: a critical analysis, Can. J. Phys., 1980, 58(8), 1200–1211 CrossRef CAS.
- J. Tobola, L. Jodin, P. Pecheur, H. Scherrer, G. Venturini, B. Malaman and S. Kaprzyk, Composition-induced metal-semiconductor-metal crossover in half-Heusler Fe1−xNixTiSb, Phys. Rev. B: Condens. Matter Mater. Phys., 2001, 64 CrossRef CAS , 155103.
- J. Tobola, J. Pierre, S. Kaprzyk, R. V. Skolozdra and M. A. Kouacou, Crossover from semiconductor to magnetic metal in semi-Heusler phases as a function of valence electron concentration, J. Phys.: Condens. Matter, 1998, 10, 1013–1032 CrossRef CAS.
- R. V. Skolozdra, J. Pierre, J. Tobola, L. P. Romaka and Y. V. Stadnyk, Multicomponent vacant Heusler phases and possibility of their application in thermoelectricity, J. Thermoelectr., 1998, 4, 44–56 Search PubMed.
- K. Kaczmarska, J. Pierre, J. Beille, J. Tobola, R. V. Skolozdra and G. A. Melnik, Physical properties of the weak itinerant ferromagnet CoVSb and related semi-Heusler compounds, J. Magn. Magn. Mater., 1998, 187, 210–220 CrossRef CAS.
- Z. Zhu, Y. Cheng and U. Schwingenschlögl, Vacancy induced half-metallicity in half-Heusler semiconductors, Phys. Rev. B: Condens. Matter Mater. Phys., 2011, 84, 113201 CrossRef.
- V. A. Dinh, K. Sato and H. Katayama-Yoshida, First principle study of spinodal decomposition thermodynamics in half-Heusler alloy CoTi1−xFexSb, J. Supercond. Novel Magn., 2010, 23, 75–78 CrossRef CAS.
- D. M. Rowe, Handbook of Thermoelectrics, CRC Press, Boca Raton, FL, 2006 Search PubMed.
- G. Rogl, A. Grytsiv, M. Gürth, A. Tavassoli, C. Ebner, A. Wünschek, S. Puchegger, V. Soprunyuk, W. Schranz, E. Bauer, H. Müller, M. Zehetbauer and P. Rogl, Mechanical properties of half-Heusler alloys, Acta Mater., 2016, 107, 178–195 CrossRef CAS.
- G. Rogl, A. Grytsiv, P. Rogl, E. Bauer and M. Zehetbauer, A new generation of p-type didymium skutterudites with high ZT, Intermetallics, 2011, 19, 546–555 CrossRef CAS.
- G. Rogl, M. Zehetbauer, M. Kerber, P. Rogl and E. Bauer, Impact of ball milling and high-pressure torsion on the microstructure and thermoelectric properties of p-and n-type Sb-based skutterudites, Mater. Sci. Forum, 2011, 667–669, 1089–1094 CAS.
- G. Rogl, A. Grytsiv, P. Rogl, E. Bauer, M. Hochenhofer, R. Anbalagan, R. C. Mallik and E. Schafler, Nanostructuring of p- and n-type skutterudites reaching figures of merit of approximately 1.3 and 1.6, respectively, Acta Mater., 2014, 76, 434–448 CrossRef CAS.
- B. R. K. Nanda and I. Dasgupta, Electronic structure and magnetism in half-Heusler compounds, J. Phys.: Condens. Matter, 2003, 15, 7307–7323 CrossRef CAS.
- S. E. Kulkova, S. V. Eremeev, T. Kakeshita, S. S. Kulkov and G. E. Rudenski, The electronic structure and magnetic properties of full- and half-Heusler alloys, Mater. Trans., 2006, 47(3), 599–606 CrossRef CAS.
- P. Villars, Material Phases Data System (MPDS), CH-6354 Vitznau, Switzerland (ed.) Springer Materials, Fe–Sb–Ti Isothermal Section of Ternary Phase Diagram; http://materials.springer.com/isp/phase-diagram/docs/c_0203024.
| This journal is © The Royal Society of Chemistry 2018 |

