 Open Access Article
Spatiotemporal coke formation over zeolite ZSM-5 during the methanol-to-olefins process as studied with operando UV-vis spectroscopy: a comparison between H-ZSM-5 and Mg-ZSM-5†
Joris
Goetze
 and
Bert M.
Weckhuysen
 *
*
Inorganic Chemistry and Catalysis, Debye Institute for Nanomaterials Science, Utrecht University, Universiteitsweg 99, 3584 CG Utrecht, The Netherlands. E-mail: B.M.Weckhuysen@uu.nl
First published on 26th February 2018
Abstract
In this work, during the methanol-to-olefins (MTO) reaction, the formation of hydrocarbon pool species as well as the accumulation of coke and coke precursor molecules were monitored with operando UV-vis spectroscopy. Using three UV-vis probes at different positions along the reactor bed simultaneously, the formation of active species and coke along the reactor bed was measured. Two catalyst materials have been compared with this operando approach: H-ZSM-5 with a Si/Al ratio of 50; and the same zeolite material that was modified using magnesium. It was revealed using spatiotemporal UV-vis spectroscopy that for both H-ZSM-5 and Mg-ZSM-5 a coke front is formed in the beginning of the reactor bed, and this coke front travels through the catalyst bed. Once the coke front reaches the end of the bed, deactivation of the catalyst material is observed. The magnesium modification resulted in extended lifetime of the catalyst, as well as higher selectivity towards olefins compared to H-ZSM-5. Operando UV-vis spectroscopy data revealed that the increase in lifetime of the catalyst was accompanied by a slower progression of the coke front through the catalyst bed, and less formation of aromatic species, especially in the parts of the catalyst bed behind the methanol conversion zone, i.e., behind the coke front. Additional experiments where MTO products, i.e., ethylene and propylene, were fed to the reactor, showed that the formation of aromatic species behind the methanol conversion zone on H-ZSM-5 are the result of aromatization of the products of methanol conversion, such as ethylene and propylene. On Mg-ZSM-5, however, ethylene and propylene were less reactive, resulting in less aromatics formation and a higher selectivity towards olefins. Based on these results, a distinction was made between primary coke, i.e., coke that forms due to the conversion of methanol into hydrocarbons, and secondary coke, i.e. coke that is formed when the MTO products, such as propylene and ethylene, undergo subsequent aromatization further in the reactor bed. The reason for the observed differences between H-ZSM-5 and Mg-ZSM-5 is that the Mg-modification results in a decrease in the number of Brønsted acid sites, as well as the creation of Lewis acid sites. The decrease in Brønsted acid sites limits the formation of secondary coke that is caused by olefin aromatization. This in turn leads to the increased lifetime and higher observed olefin selectivity of Mg-ZSM-5 relative to H-ZSM-5.
1. Introduction
In the methanol-to-hydrocarbons (MTH) process, hydrocarbons are produced from methanol using a zeolite or zeotype catalyst. Over the years, there has been much discussion on the exact mechanism of MTH processes. In the early days of MTH, direct mechanisms were proposed, but more recently, the hydrocarbon pool mechanism became the most widely accepted reaction mechanism for MTH over zeolite ZSM-5. In this mechanism, methanol reacts with a pool of hydrocarbon species that are either neutral or charged by the zeolite framework.1 Direct mechanisms are still studied for their role in the early stages of the MTH process, when the initial hydrocarbon pool is built.2–4 For ZSM-5-based MTH catalyst materials, the dual-cycle mechanism was proposed, which is a more specific version of the hydrocarbon pool mechanism. In this mechanism, two cycles that have different active species, i.e., the aromatic and the alkene cycle, both contribute to the overall product formation, depending on catalyst and conditions.5–9 In the aromatic cycle aromatic intermediates are alkylated by the methanol feed, and the main product due to dealkylation of these alkylated aromatics is ethylene. In the alkene cycle, however, olefinic intermediates are methylated into longer chains, and cracking of these longer alkenes results in product formation, mainly propylene and larger alkenes.During the MTH process, formation of coke results in the deactivation of the catalyst material, either by filling the pores of the catalyst, or by forming a layer of coke on the outside, thereby blocking access to the active sites of the catalyst.10 Studying the nature and evolution of the hydrocarbon pool and the formation of coke species is important in order to understand the MTH reaction over zeolite catalysts. In situ and operando spectroscopic techniques, such as nuclear magnetic resonance (NMR),1 Raman,11 infrared,12,13 and UV-vis spectroscopy13–19 have been used to study active intermediates as well as the formation of coke species inside the zeolite during the reaction. The MTH process is an autocatalytic process, meaning that the initial products that are formed in the beginning of the reaction act as catalytic centre for the reaction. Because of this, most studies are performed at a methanol conversion of 100%.10 It has been shown before that during MTH over ZSM-5 in a plug-flow reactor only a small part of the catalyst bed is needed to obtain a methanol conversion of 100%. This means that in the beginning of the reaction, the remaining part of the catalyst bed does not see methanol, but only reaction products. When the first part of the catalyst bed deactivates due to coke formation, the next part of the bed is used to convert methanol. This “coke front” progresses through the bed until the entire catalyst bed is deactivated.10,20–22 However, not all MTH catalysts exhibit the same deactivation behaviour along the reactor bed, and understanding these spatiotemporal processes is important for understanding deactivation of MTH catalysts.22
The products of the MTH process over ZSM-5-based catalysts are olefins and gasoline-like products, including small aromatic molecules and paraffins. Currently, however, efforts are more directed toward the production of lower olefins, more specifically propylene.23,24 Increasing lower olefin selectivity can be done using different approaches, one of which is choosing the pore structure of the zeolite catalyst. When small-pore zeolite frameworks with large cages, interconnected by small eight-ring windows, such as CHA, are used as catalyst, only aliphatic products are observed, since aromatics that are formed inside the zeolite framework are trapped and cannot exit through the eight-ring pores. Therefore, small-pore zeolites have a very high selectivity toward the formation of lower olefins, and in this case the process is called methanol-to-olefins (MTO). However, medium-pore zeolite frameworks with ten-ring pore systems, such as MFI, are generally more stable and more resistant against coking than small-pore zeolites. Therefore, other approaches than shape selectivity to increase lower olefin yields are also applied, including tuning reaction conditions, e.g., by converting methanol at low pressures and high temperatures over ZSM-5, olefins selectivity increases.5,25,26 Another approach that is often used is changing the properties of the catalyst materials. Tuning the acid strength and acid site density by varying Si/Al ratio is often used in order to influence lifetime and selectivity of the catalyst.24,27 Furthermore, many different post-synthetic modifications have been applied to influence catalyst lifetime and selectivity. Introducing alkaline earth metals, such as Ca and Mg, into the zeolite material has shown to have a large effect on increasing propylene selectivity and lifetime of the catalyst, although the exact origin of this effect is still debated.28–35
In this work, the formation of active species and the accumulation of coke species inside the zeolite catalyst during the MTO process were monitored using operando UV-vis spectroscopy, while the methanol conversion and product formation were monitored with online gas chromatography (GC). We have compared a regular H-ZSM-5 sample with Si/Al ratio of 50 with the same sample that was modified using Mg. Using three UV-vis probes at different positions along the reactor bed simultaneously, the formation of active species and coke along the bed as well as the progression of the coke front through the catalyst bed could be measured. We will discuss this spatially resolved spectral information in view of the distinct differences between these two zeolite samples, and by doing so gather new information on the hydrocarbon species involved in the formation of coke along the catalyst bed.
2. Experimental
2.1 Materials synthesis and characterization
Two ZSM-5 zeolites with MFI topology were obtained from BASF SE (Ludwigshafen, Germany). One sample was in its protonic form, with a theoretical Si/Al ratio of 50. The other sample was obtained via spray impregnation of the aforementioned sample with a magnesium nitrate solution, as described in the patent of Gaab et al.36To study the morphology of the zeolite materials, scanning electron microscopy (SEM) was performed on the samples using an FEI XL 30 SFEG microscope operating at 15 kV with magnifications up to 600 kV.
X-ray diffraction (XRD) patterns were obtained using a Bruker D8 Advance powder diffractometer system, equipped with a Lynxeye detector, using Co-Kα12 radiation (λ = 1.79026 Å). XRD patterns were recorded from 5–60° 2θ with a step size of 0.1° 2θ.
To determine the Si/Al ratio and the amount of magnesium in the zeolites, the samples were digested in an aqueous mixture of 1% HF and 1.25% H2SO4. Subsequently, elemental analysis was done by inductively coupled plasma optical emission spectrometry (ICP-OES), on a PerkinElmer Optima 4300 DV instrument.
Ar physisorption measurements were performed to assess the zeolite porosity using a Micromeritics TriStar 3000 at a temperature of −196 °C. Before the measurement, the samples were dried under vacuum at 400 °C for 20 h. The micropore area and volume were determined using the t-plot method.
Temperature programmed desorption of NH3 (NH3-TPD) was performed to assess the amount of acid sites. NH3-TPD was performed on a Micromeritics Autochem II 2920 equipped with a TCD detector. Before the adsorption of NH3 at 200 °C, ∼100 mg of zeolite was heated to 600 °C in N2 flow for 1 h. After NH3 adsorption, the sample was flushed with N2 for 1 h at 200 °C to remove physisorbed NH3. Subsequently, temperature programmed desorption of the adsorbed NH3 was performed at a rate of 5 °C min−1 to 600 °C.
Adsorption of CO followed by FT-IR spectroscopy was performed to obtain more information on the nature of acid sites. A self-supporting catalyst wafer was heated under vacuum to 450 °C to remove adsorbed water. Subsequently, the vacuum cell was cooled down to −196 °C using liquid N2. The CO pressure was increased stepwise to ∼1 mbar. FT-IR spectra were recorded using a PerkinElmer 2000 spectrometer in transmission mode.
The methanol used for catalytic testing was obtained from Acros, HPLC grade (99.99% pure).
2.2 Operando UV-vis spectroscopy along the reactor bed
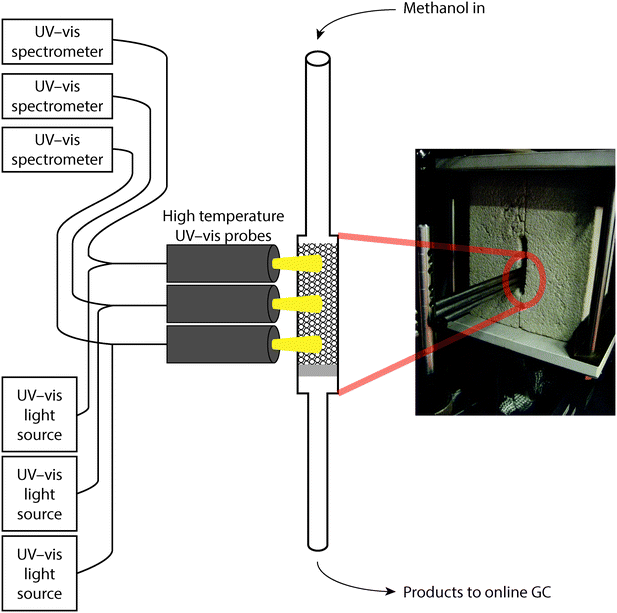
Combined operando UV-vis spectroscopy and online activity measurements were performed in a quartz, rectangular fixed-bed reactor (ID 6 mm × 3 mm), with a weight hourly space velocity (WHSV) of 5 g g−1 h−1 at a reaction temperature of 500 °C. In all experiments, 200 mg of catalyst was used, with a particle size of 0.2–0.4 mm, resulting in a bed height of ca. 18 mm. A He flow with a methanol saturation of ca. 25% was obtained by flowing He as carrier gas through a saturator containing methanol at ca. 37 °C. Operando UV-vis spectra were obtained at three places along the reactor bed (at ca. 3, 9, and 15 mm) simultaneously, using three AvaSpec 2048L spectrometers, each connected to a high-temperature UV-vis optical fibre probe, which was used to collect spectra in reflection mode. Online analysis of the reactant and reaction products was performed using an Interscience Compact GC, equipped with an Rtx-wax and Rtx-1 column in series and an Rtx-1, Rt-TCEP and Al2O3/Na2SO4 column in series, both connected to an FID detector. A schematic of the setup is shown in Fig. 1; and further details on the operando set-up have been reported in earlier publications from our group.16,17,37Methanol conversion was calculated as follows:
The selectivity toward products was based on carbon atoms and calculated using:
3. Results
3.1 Materials characterization
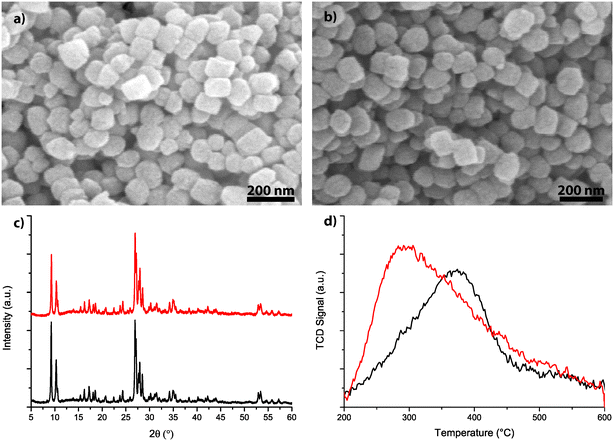
The morphology of the two zeolite-based catalyst materials, i.e., H-ZSM-5 and Mg-ZSM-5, was studied using scanning electron microscopy (SEM) and the results are shown in Fig. 2a and b. The zeolite crystals under study have a diameter of 100–200 nm and the morphology and crystal size do not change upon Mg treatment. ICP-OES analysis was used to determine the Si/Al ratio, as well as the amount of Mg in the samples. The results are summarized in Table 1.| Sample | Si/Al | Mg (wt%) | Mg/Al | # acid sites (mmol gcat−1) | S BET (cm2 g−1) | S micro (cm2 g−1) | V micro (cm3 g−1) |
|---|---|---|---|---|---|---|---|
| H-ZSM-50 | 54 | 0 | — | 0.24 | 385 | 307 | 0.140 |
| Mg-ZSM-50 | 55 | 3.6 | 5.4 | 0.34 | 281 | 239 | 0.109 |
The zeolite materials were also analysed using X-ray diffraction (XRD). Fig. 2c shows the XRD patterns for the two different materials. From these XRD measurements, it is visible that the catalyst materials are pure zeolite ZSM-5 (MFI topology), and Mg-modification does not induce any noticeable changes in the crystallinity of the samples. This indicates that Mg is most likely not in framework positions.
The amount of acid sites of both zeolite materials was determined using temperature-programmed desorption (TPD) of NH3, the normalized desorption curves are shown in Fig. 2d. The fresh zeolite H-ZSM-5 sample shows a desorption peak with a maximum around 340–380 °C, which can be assigned to Brønsted acid sites. Upon magnesium modification, the area under the curve increases, indicating an overall increase in acid sites. At the same time, the maximum of the peak shifts to below 300 °C, indicating that the strength of acid sites decreases upon the Mg treatment. The total amount of acid sites is obtained by integrating the area under the desorption curves, and is presented in Table 1 for H-ZSM-5 and Mg-ZSM-5.
The porosity of the zeolite material was investigated using Ar physisorption. The BET surface area (SBET), as well as the micropore area and volume (Smicro and Vmicro) are reported in Table 1. All reported variables become lower after Mg modification, but from SEM and XRD there is no sign that the zeolite framework itself has changed. This indicates that Mg species are present both inside and outside the zeolite pores, thereby reducing the surface area and pore volume of the zeolite. If the Mg would be present only as counterions balancing the negative charge on the zeolite framework, a Mg/Al of 0.5 would be expected. However, the Mg/Al ratio is more than ten times higher, indicating that the presence of other Mg species, such as magnesium oxides or magnesium hydroxides is expected.
To investigate the nature of the acid sites, adsorption of CO at low temperature followed by FT-IR spectroscopy was applied. The OH-stretch region was used to assess the amount and strength of Brønsted acid sites, whereas the CO-stretch region was used to assess both Lewis and Brønsted acidity. The shift of the OH-peak upon adsorption of CO was taken as a measure for the strength of the Brønsted acid sites. For the unmodified zeolite H-ZSM-5, the FT-IR spectra are shown in Fig. 3. Three distinct peaks are visible in the OH-region of the FT-IR spectrum. Above 3700 cm−1, there is a sharp peak that can be attributed to isolated Si–OH groups, at the external surface of the catalyst. A second peak, at 3619 cm−1 is due to Brønsted OH-groups. A third broad peak around 3500 cm−1 is due to silanol nests.38,39 Upon adsorption of CO, the peak at 3619 cm−1 is shifted to 3295 cm−1. This peak shift of 324 cm−1 upon CO adsorption is a measurement of Brønsted acid strength.39 The FT-IR spectra for Mg-ZSM-5 are presented in Fig. 4. The peak due to Brønsted acid sites at 3622 cm−1 is smaller compared to H-ZSM-5, indicating that at least some of the Mg is located at the Brønsted acid sites, altering the nature of the acid sites. However, there is still some Brønsted acidity left in the modified zeolites, even though there is an excess of Mg present in the samples. This indicates that either not all Brønsted sites are affected by the Mg-treatment, or that new Brønsted acid sites are created. However, the peak shift upon CO adsorption, used to measure the strength of the Brønsted acid sites, is 323 cm−1 for Mg-ZSM-5, almost identical to H-ZSM-5. This makes it most likely that not all Brønsted acid sites are affected by the Mg modification, rather than that new Brønsted acid sites are created. Another effect of the Mg-treatment is that the broad band due to silanol nests is removed, suggesting that part of the Mg is present in defect locations of the zeolite framework.
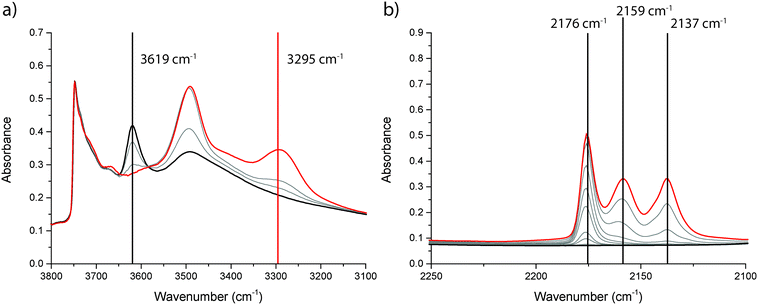 | ||
| Fig. 3 FT-IR spectra before (black) and after (red) admission of CO to zeolite H-ZSM-5 at −196 °C; (a) the OH-stretch region and (b) the CO-stretch region. | ||
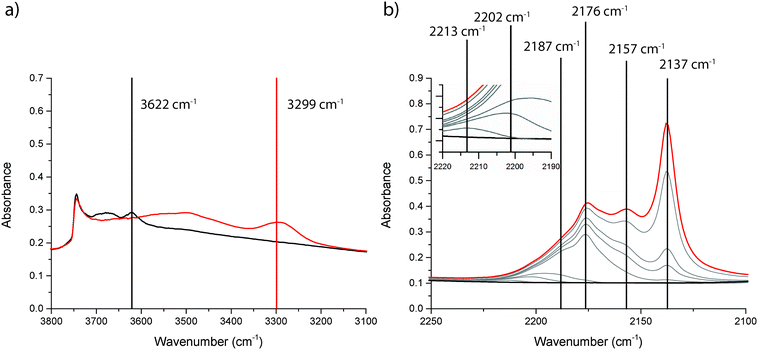 | ||
| Fig. 4 FT-IR spectra before (black) and after (red) admission of CO to zeolite Mg-ZSM-5 at −196 °C; (a) the OH-stretch region and (b) the CO-stretch region. | ||
The CO-stretch region gives information about how the C–O bond is perturbed upon adsorption of CO (gas phase absorbance at 2143 cm−1), and therefore it can be used to assess the presence of both Brønsted and Lewis acid sites.38,39 A shift of the CO band towards higher wavenumbers means that CO is adsorbed on an acid site. Absorption bands that occur >2180 cm−1 indicate the presence of Lewis sites, whereas bands between 2180 and 2140 cm−1 occur when CO is adsorbed to a Brønsted acid site. Physisorbed CO gives rise to a band at 2137 cm−1. For both Brønsted and Lewis acid sites, the magnitude of the shift relative to the band position of physisorbed CO indicates the strength of the acid site. For zeolite H-ZSM-5 (Fig. 3), three FT-IR peaks are observed in the CO region, i.e., at 2176 cm−1, 2159 cm−1, and 2137 cm−1. These bands can be attributed to Brønsted acid sites, silanol groups, and physisorbed CO, respectively. No bands above 2180 cm−1 were observed, which is expected for zeolite H-ZSM-5 without the presence of extra-framework Al species. After the Mg-treatment, the same bands, caused by Brønsted acid sites, silanol groups, and physisorbed CO are visible. However, as evident from Fig. 4, there are more FT-IR bands present in the CO-region. Lewis acid sites of different strength are created, which give rise to absorbance peaks at 2213 cm−1, 2202 cm−1 and 2187 cm−1. These Lewis acid sites can be due to several different Mg species inside the zeolite pores, e.g., Mg2+ or MgOx species or a combination of Mg and a zeolite acid site.28
3.2 Catalytic performance
The catalytic performances of zeolites H-ZSM-5 and Mg-ZSM-5 were examined and compared in the operando UV-vis setup, as described in Fig. 1. The MTO reaction was performed at 500 °C using a WHSV of 5 g g−1 h−1, and both methanol conversion and product formation were monitored using online GC-analysis. At the same time, the formation of hydrocarbon species was followed at three positions along the catalyst bed. In this way, formation of both active species and coke (precursor) species along the reactor bed could be observed in a spatiotemporal manner, and this formation and evolution of hydrocarbon species could be linked to the catalytic performance that was measured simultaneously. The activity data is shown in Fig. 5, and catalyst lifetime and selectivity toward the main products are reported in Table 2. The selectivities in Table 2 are averaged over the time until deactivation of the catalyst, i.e., until methanol conversion <80%. In the GC analysis, C1–C5 hydrocarbons were separated and detected, whereas C6+ hydrocarbons were detected but not separated well. Therefore, selectivity towards C6+ and coke was calculated using 100% – selectivityC1–C5. From the activity data, it is clear that the Mg-treatment increases the catalyst lifetime and that Mg-treatment also increases the selectivity towards propylene, C4- and C5-olefins while decreasing the selectivity towards ethylene and paraffins. The decrease in ethylene selectivity together with an increase in selectivity toward C3–C5 olefins, as well as a decrease in paraffin selectivity indicate that the Mg modification has an influence on the MTO mechanism. More specifically, these changes in selectivity indicate that the alkene cycle becomes more important relative to the aromatic cycle.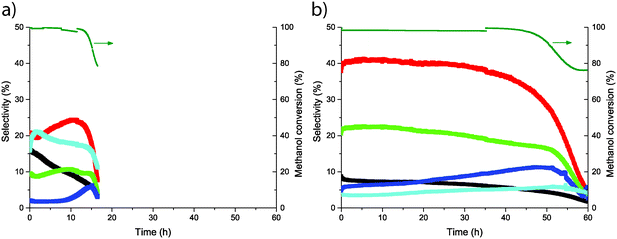 | ||
| Fig. 5 Catalyst activity and selectivity toward ethylene (black), propylene (red), C4 olefins (green), C5 olefins (dark blue), and paraffins (light blue) for (a) H-ZSM-5, and (b) Mg-ZSM-5. | ||
| Sample | Selectivity (%) | Catalyst lifetime (h) | |||||
|---|---|---|---|---|---|---|---|
| Ethylene | Propylene | C4 olefins | C5 olefins | Paraffins | C6+ + coke | ||
| H-ZSM-5 | 10 | 22 | 10 | 3 | 18 | 37 | 16.2 |
| Mg-ZSM-5 | 6 | 37 | 20 | 8 | 5 | 24 | 54.7 |
3.3 Operando UV-vis spectroscopy
![[thin space (1/6-em)]](https://www.rsc.org/images/entities/char_2009.gif) 000 cm−1, a region where poly-aromatic species absorb light, was used. However, if the absorbance at another wavenumber is used, the development of the coke front is very similar, because apart from the formation of a few distinct absorption bands in the beginning of the reaction which will be described in the next section, the main change in operando UV-vis spectra is an increase in absorbance over the complete spectral range. The catalytic performance during the operando UV-vis experiments was described in the previous section and is presented in Table 2. The methanol conversion and formation of coke, i.e., the UV-vis absorbance at 10
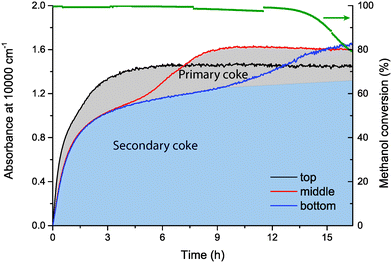
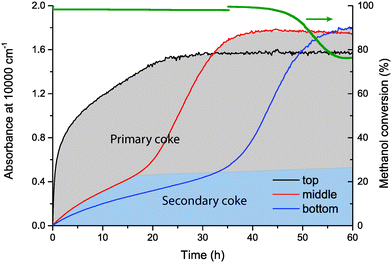
000 cm−1, a region where poly-aromatic species absorb light, was used. However, if the absorbance at another wavenumber is used, the development of the coke front is very similar, because apart from the formation of a few distinct absorption bands in the beginning of the reaction which will be described in the next section, the main change in operando UV-vis spectra is an increase in absorbance over the complete spectral range. The catalytic performance during the operando UV-vis experiments was described in the previous section and is presented in Table 2. The methanol conversion and formation of coke, i.e., the UV-vis absorbance at 10![[thin space (1/6-em)]](https://www.rsc.org/images/entities/char_2009.gif) 000 cm−1, at the three positions along the reactor vs. time-on-stream are shown in Fig. 6 and 7 for H-ZSM-5 and Mg-ZSM-5, respectively.
000 cm−1, at the three positions along the reactor vs. time-on-stream are shown in Fig. 6 and 7 for H-ZSM-5 and Mg-ZSM-5, respectively.
For H-ZSM-5, there is rapid coke formation along the entire catalyst bed. After ca. 2 h, coke formation in the middle and bottom of the reactor slows down, whereas the absorbance at the top keeps increasing until the maximum absorbance of ca. 1.4 is reached. After that, the UV-vis absorbance in the middle of the bed quickly increases until its maximum. Subsequently, after the maximum absorbance is reached in the middle of the catalyst bed, the absorbance at the bottom of the catalyst bed increases to its maximum. At this moment, catalyst deactivation is observed in the product analysis. The successive increase in absorbance from the top to the bottom of the reactor can be seen as the progression of the coke front through the reactor. However, in the beginning of the reaction, there is rapid coke formation in the middle and bottom of the reactor, although the methanol conversion zone is still at the top of the catalyst bed. This effect has been observed and discussed before by other research groups, and this coke formation is caused by secondary reactions of species that are formed in the methanol conversion zone.20,21 Because this coke is formed from secondary reactions rather than from the conversion of methanol into olefins, we define this coke as “Secondary coke”. The blue area under the absorbance graph of the middle and bottom of the reactor in Fig. 6 indicates the formation of secondary coke. The coke front, i.e. the coke that is formed in the methanol conversion zone, originates directly from the conversion of methanol into olefins. We define this coke as “Primary coke”, and when the absorbance due to primary coke reaches its maximum in a certain part of the catalyst bed, that part of the bed is deactivated. Consequently, it is observed that when the primary coke has reached a maximum in the bottom part of the reactor, deactivation is observed in the activity data. When the UV-vis absorbance at the three positions along the reactor bed is plotted vs. time at different wavenumbers, i.e., at 30![[thin space (1/6-em)]](https://www.rsc.org/images/entities/char_2009.gif) 000 and 40
000 and 40![[thin space (1/6-em)]](https://www.rsc.org/images/entities/char_2009.gif) 000 cm−1, a similar pattern along the bed is observed (ESI,† Fig. S1 and S2).
000 cm−1, a similar pattern along the bed is observed (ESI,† Fig. S1 and S2).
For Mg-ZSM-5, the initial increase in UV-vis absorbance in the middle and bottom of the catalyst bed, i.e., the formation of secondary coke, is much slower than for H-ZSM-5. For the primary coke, a similar pattern as for H-ZSM-5 is observed, the absorbance increases first in the top of the reactor, until the maximum absorbance is reached. Subsequently, primary coke formation starts in the middle of the catalyst bed, and after that, in the bottom of the bed. Once the primary coke has reached its maximum in the bottom of the bed, similarly to H-ZSM-5, catalyst deactivation is observed. The slower formation of secondary coke indicates that less coke is formed because of secondary reactions of products formed in the methanol conversion zone. Because of the fact that less secondary is coke formed, Mg-ZSM-5 deactivates slower than H-ZSM-5, which causes the much longer lifetime of the catalyst before deactivation. The reason for the slower formation of secondary coke in Mg-ZSM-5 will be discussed in section 3.3.3.
Secondary coke is (poly)aromatic in nature, which can be seen by the lower absorbance due to secondary coke at 30![[thin space (1/6-em)]](https://www.rsc.org/images/entities/char_2009.gif) 000 and 40
000 and 40![[thin space (1/6-em)]](https://www.rsc.org/images/entities/char_2009.gif) 000 cm−1 (Fig. S1 and S2 of the ESI†), the spectral region where aliphatic species absorb light, compared to the absorbance at 10
000 cm−1 (Fig. S1 and S2 of the ESI†), the spectral region where aliphatic species absorb light, compared to the absorbance at 10![[thin space (1/6-em)]](https://www.rsc.org/images/entities/char_2009.gif) 000 cm−1, where (poly)aromatic species absorb light. The absorbance caused by primary coke, however, is similar at 10
000 cm−1, where (poly)aromatic species absorb light. The absorbance caused by primary coke, however, is similar at 10![[thin space (1/6-em)]](https://www.rsc.org/images/entities/char_2009.gif) 000, 30
000, 30![[thin space (1/6-em)]](https://www.rsc.org/images/entities/char_2009.gif) 000, and 40
000, and 40![[thin space (1/6-em)]](https://www.rsc.org/images/entities/char_2009.gif) 000 cm−1, indicating that primary coke is less dominated by aromatics and consists of both aliphatic and aromatic species.
000 cm−1, indicating that primary coke is less dominated by aromatics and consists of both aliphatic and aromatic species.
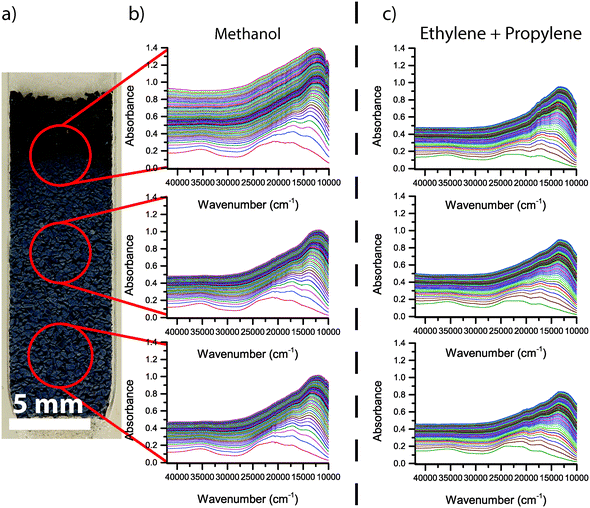
The photograph of the H-ZSM-5 catalyst bed and the corresponding operando UV-vis spectra for the first 2 h of reaction are shown in Fig. 8. In the top of the reactor, a black zone is clearly visible, while the rest of the reactor bed appears grey/blue after 2 h of reaction. The corresponding UV-vis spectra show the highest absorbance at the top of the reactor, causing the catalyst to appear black at the top, whereas the UV-vis spectra of the other parts of the reactor show a lower absorbance. The blue colour is caused by a higher absorbance below 25![[thin space (1/6-em)]](https://www.rsc.org/images/entities/char_2009.gif) 000 cm−1 than above 25
000 cm−1 than above 25![[thin space (1/6-em)]](https://www.rsc.org/images/entities/char_2009.gif) 000 cm−1. In the spectra taken along the reactor bed during the first 2 h of reaction, a number of UV-vis absorption bands are seen. Band assignments were done according to earlier work from our group.17 In the first few UV-vis spectra (in the first minutes of the reaction) a band at around 35
000 cm−1. In the spectra taken along the reactor bed during the first 2 h of reaction, a number of UV-vis absorption bands are seen. Band assignments were done according to earlier work from our group.17 In the first few UV-vis spectra (in the first minutes of the reaction) a band at around 35![[thin space (1/6-em)]](https://www.rsc.org/images/entities/char_2009.gif) 000 cm−1 is formed, as well as a band at around 24
000 cm−1 is formed, as well as a band at around 24![[thin space (1/6-em)]](https://www.rsc.org/images/entities/char_2009.gif) 000 cm−1. Subsequently, absorption bands at 21
000 cm−1. Subsequently, absorption bands at 21![[thin space (1/6-em)]](https://www.rsc.org/images/entities/char_2009.gif) 000, 17
000, 17![[thin space (1/6-em)]](https://www.rsc.org/images/entities/char_2009.gif) 500, and 13
500, and 13![[thin space (1/6-em)]](https://www.rsc.org/images/entities/char_2009.gif) 000 cm−1 are formed. The UV-vis absorption bands at wavenumbers below 25
000 cm−1 are formed. The UV-vis absorption bands at wavenumbers below 25![[thin space (1/6-em)]](https://www.rsc.org/images/entities/char_2009.gif) 000 cm−1 overlap and form a large, convoluted band. From previous operando UV-vis spectroscopy work on the MTO process, it is known that the spectral region below 25
000 cm−1 overlap and form a large, convoluted band. From previous operando UV-vis spectroscopy work on the MTO process, it is known that the spectral region below 25![[thin space (1/6-em)]](https://www.rsc.org/images/entities/char_2009.gif) 000 cm−1 is dominated by neutral and charged aromatic species.17,40 It has been shown before that the wavenumber at which aromatics absorb light decreases with increasing size of the aromatic molecule.41–43 The formation of the large convoluted band below 25
000 cm−1 is dominated by neutral and charged aromatic species.17,40 It has been shown before that the wavenumber at which aromatics absorb light decreases with increasing size of the aromatic molecule.41–43 The formation of the large convoluted band below 25![[thin space (1/6-em)]](https://www.rsc.org/images/entities/char_2009.gif) 000 cm−1 can therefore be interpreted as the formation of neutral and charged aromatic species of increasing size with increasing time-on-stream. After the initial period where absorbance of these UV-vis bands increases quickly, the absorbance over the complete range of wavenumbers increases, indicating the formation of extended coke species, probably at the outside of the zeolite crystal. With increasing time-on-stream, this general darkening over the complete spectral range becomes dominant, and the spectral features become broader. The absorbance after 2 h is higher at the top of the reactor than at the other two positions, but the shape of general shape of the spectrum is very similar.
000 cm−1 can therefore be interpreted as the formation of neutral and charged aromatic species of increasing size with increasing time-on-stream. After the initial period where absorbance of these UV-vis bands increases quickly, the absorbance over the complete range of wavenumbers increases, indicating the formation of extended coke species, probably at the outside of the zeolite crystal. With increasing time-on-stream, this general darkening over the complete spectral range becomes dominant, and the spectral features become broader. The absorbance after 2 h is higher at the top of the reactor than at the other two positions, but the shape of general shape of the spectrum is very similar.
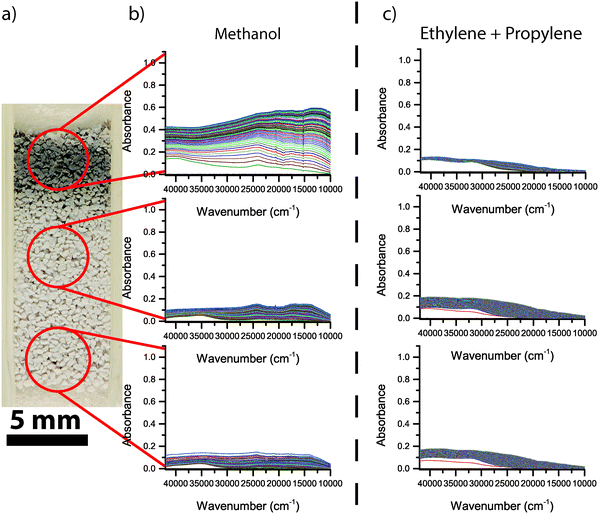
The photograph of the Mg-ZSM-5 catalyst bed and corresponding UV-vis spectra for the first 2 h of reaction are shown in Fig. 9. Similar to H-ZSM-5, the Mg-ZSM-5 bed is darker at the top than at the other two positions along the bed. However, the colour is clearly different from H-ZSM-5. The top of the catalyst bed has become grey, whereas the rest of the bed has remained white. The corresponding UV-vis spectra of Mg-ZSM-5 also differ from the spectra of H-ZSM-5. At the top of the Mg-ZSM-5 bed, an absorption band around 40![[thin space (1/6-em)]](https://www.rsc.org/images/entities/char_2009.gif) 000 cm−1 is formed in the beginning of the reaction. The band around 35
000 cm−1 is formed in the beginning of the reaction. The band around 35![[thin space (1/6-em)]](https://www.rsc.org/images/entities/char_2009.gif) 000 cm−1 is present as a shoulder, but less intense than in the case of H-ZSM-5. Subsequently, formation of absorption bands around 24
000 cm−1 is present as a shoulder, but less intense than in the case of H-ZSM-5. Subsequently, formation of absorption bands around 24![[thin space (1/6-em)]](https://www.rsc.org/images/entities/char_2009.gif) 000, 17
000, 17![[thin space (1/6-em)]](https://www.rsc.org/images/entities/char_2009.gif) 500 and 13
500 and 13![[thin space (1/6-em)]](https://www.rsc.org/images/entities/char_2009.gif) 000 cm−1 is also observed, but the bands are much less intense than in the case of H-ZSM-5. Similar to H-ZSM-5, an increase in absorbance in the complete range of wavenumbers is observed, but the increase is much slower. In contrast to H-ZSM-5, the absorbance below 25
000 cm−1 is also observed, but the bands are much less intense than in the case of H-ZSM-5. Similar to H-ZSM-5, an increase in absorbance in the complete range of wavenumbers is observed, but the increase is much slower. In contrast to H-ZSM-5, the absorbance below 25![[thin space (1/6-em)]](https://www.rsc.org/images/entities/char_2009.gif) 000 cm−1 is not much higher than above 25
000 cm−1 is not much higher than above 25![[thin space (1/6-em)]](https://www.rsc.org/images/entities/char_2009.gif) 000 cm−1, causing the zeolite to appear grey instead of blue. In the middle and bottom of the bed, spectral features are observed at similar wavenumbers compared to the top of the reactor. However, the absorbance is much lower than at the top of the catalyst bed, explaining why the catalyst in the middle and bottom of the reactor still appears white after 2 h of reaction.
000 cm−1, causing the zeolite to appear grey instead of blue. In the middle and bottom of the bed, spectral features are observed at similar wavenumbers compared to the top of the reactor. However, the absorbance is much lower than at the top of the catalyst bed, explaining why the catalyst in the middle and bottom of the reactor still appears white after 2 h of reaction.
| Sample | Conversion (%) | ||
|---|---|---|---|
| Ethylene | Propylene | Ethylene + propylene | |
| H-ZSM-50 | 5 | 53 | 31 |
| Mg-ZSM-50 | 0 | 8 | 7 |
In Fig. 8c, the operando UV-vis spectra of H-ZSM-5 taken during the first 2 h of feeding a mixture of ethylene and propylene are shown. The spectra, i.e., band positions as well as intensities, are very similar to the UV-vis spectra during the MTO process, but without the coke front at the top of the reactor. This indicates that the secondary coke that accumulates inside the zeolite during the MTO process is indeed caused by secondary reactions of MTO products, such as ethylene and propylene, rather than directly by the conversion of methanol. The operando UV-vis spectra during the first 2 h of conversion of a mixture of ethylene and propylene over Mg-ZSM-5, which are shown in Fig. 9c, are also comparable to the spectra during the first 2 h of the MTO process. Absorption bands around 40![[thin space (1/6-em)]](https://www.rsc.org/images/entities/char_2009.gif) 000 cm−1 and 33
000 cm−1 and 33![[thin space (1/6-em)]](https://www.rsc.org/images/entities/char_2009.gif) 000 cm−1 are formed, similar to the formation of these bands in the middle and bottom of the catalyst bed during methanol conversion. However, the small UV-vis bands below 25
000 cm−1 are formed, similar to the formation of these bands in the middle and bottom of the catalyst bed during methanol conversion. However, the small UV-vis bands below 25![[thin space (1/6-em)]](https://www.rsc.org/images/entities/char_2009.gif) 000 cm−1 visible during the MTO process, an indication for the formation of aromatic species, are not present during the conversion of ethylene and propylene over Mg-ZSM-5. The increase in UV-vis absorbance during ethylene and propylene conversion over Mg-ZSM-5 proceeds slowly compared to H-ZSM-5, at a similar rate compared to the middle and bottom of the Mg-ZSM-5 catalyst bed during methanol conversion. The coke front, which is visible during the conversion of methanol, is not present during the conversion of ethylene and propylene over Mg-ZSM-5.
000 cm−1 visible during the MTO process, an indication for the formation of aromatic species, are not present during the conversion of ethylene and propylene over Mg-ZSM-5. The increase in UV-vis absorbance during ethylene and propylene conversion over Mg-ZSM-5 proceeds slowly compared to H-ZSM-5, at a similar rate compared to the middle and bottom of the Mg-ZSM-5 catalyst bed during methanol conversion. The coke front, which is visible during the conversion of methanol, is not present during the conversion of ethylene and propylene over Mg-ZSM-5.
For both H-ZSM-5 and Mg-ZSM-5, the UV-vis spectra during ethylene and propylene conversion are similar to the UV-vis spectra of the secondary coke formation during the MTO process, whereas the coke front that was observed during the MTO process is not visible during ethylene and propylene conversion. This indicates that the primary coke formation during the MTO process is indeed caused by methanol conversion, and the formation of secondary coke is caused by the secondary reactions of MTO products, such as ethylene and propylene. The slower secondary coke formation on Mg-ZSM-5 compared to H-ZSM-5 during the MTO process corresponds to slower coke formation during the conversion of ethylene and propylene.
4. Discussion
4.1 Spatiotemporal effects along the reactor bed
During the MTO process, hydrocarbons are retained on the zeolite catalyst material; active species that are part of the hydrocarbon pool, and coke (precursor) molecules that lead to deactivation of the catalyst. As observed before by several research groups, deactivation of the catalyst as well as accumulation of hydrocarbon species proceeds along the catalyst bed during the MTO reaction.20,21 Because 100% methanol conversion is already achieved in a small part at the beginning of the catalyst bed, the rest of the catalyst bed is not subjected to methanol in the beginning of the reaction, but rather to MTO reaction products. The results presented above show that the maximum amount of coke on the catalyst corresponds with an absorbance of ca. 1.6 at 10![[thin space (1/6-em)]](https://www.rsc.org/images/entities/char_2009.gif) 000 cm−1, and that the catalyst is deactivated when this maximum absorbance is reached. When the first part of the catalyst bed is deactivated, methanol is converted in the next part of the bed, until that part of the bed is deactivated as well. In this way, a deactivating coke front that travels through the catalyst bed is observed. Only when the last part of the catalyst bed becomes deactivated, deactivation is apparent in the activity data as well, and methanol is not 100% converted anymore. This general pattern is observed for both H-ZSM-5 and Mg-ZSM-5.
000 cm−1, and that the catalyst is deactivated when this maximum absorbance is reached. When the first part of the catalyst bed is deactivated, methanol is converted in the next part of the bed, until that part of the bed is deactivated as well. In this way, a deactivating coke front that travels through the catalyst bed is observed. Only when the last part of the catalyst bed becomes deactivated, deactivation is apparent in the activity data as well, and methanol is not 100% converted anymore. This general pattern is observed for both H-ZSM-5 and Mg-ZSM-5.
However, there are also large differences between the two samples. First of all, the time before deactivation is observed in the activity data, i.e., the time until the coke front reaches the end of the catalyst bed, is 16.2 h for H-ZSM-5, compared to 54.7 h for Mg-ZSM-5, an increase in catalyst lifetime by a factor of 3.4. Furthermore, behind the coke front, much more secondary coke is formed on H-ZSM-5 compared to Mg-ZSM-5. When 100% conversion of methanol is achieved already in the first part of the catalyst bed, it means that the rest of the bed is subjected to MTO products, such as ethylene and propylene. Feeding these MTO products as reactant over the catalyst showed that they were much more reactive on H-ZSM-5 than on Mg-ZSM-5. During the conversion of MTO products, i.e., ethylene and propylene, over H-ZSM-5, aromatic hydrocarbons were formed and retained on the catalyst. The nature and amount of these retained hydrocarbons, i.e., UV-vis band positions and absorbance, were very similar to the spectral features of the secondary coke that was formed behind the coke front during methanol conversion, as can be seen in Fig. 8. Contrarily, on Mg-ZSM-5, MTO products, i.e., ethylene and propylene, were much less reactive than on H-ZSM-5. Conversion of these MTO products over Mg-ZSM-5 resulted in much less retained hydrocarbons compared to H-ZSM-5, similar to the low amounts of secondary coke formed during methanol conversion over Mg-ZSM-5, as can be seen in Fig. 9. The lower amount of secondary coke formed in Mg-ZSM-5 during MTO is the reason for the slower progression of the coke front and longer catalyst lifetime compared to H-ZSM-5.
4.2 Effect of magnesium modification
The results discussed above show that the magnesium modification of zeolite ZSM-5 causes a change in acidic properties of the zeolite material, i.e., a decrease in the amount of Brønsted acid sites and silanol nests, and the generation of Lewis acid sites. Another effect of the magnesium modification is the decrease of surface area and pore volume. The decrease of the amount of Brønsted acid sites and pore volume upon modification of zeolite ZSM-5 with magnesium or other alkaline earth metals has been reported by numerous groups.28,29,44 It has been shown previously that at reaction conditions similar to the conditions used in this study, H-ZSM-5 can be used as an olefin aromatization catalyst.45–47 It was noted that for effective aromatization, strong acid sites were required, and that decreasing the amount of strong acid sites led to decreased aromatic formation during olefin conversion.47,48 For the MTO reaction, we showed that the aromatization of MTO products, i.e., propylene and ethylene, was mainly responsible for the aromatics formation on H-ZSM-5 in the parts of the catalyst bed after the methanol conversion zone. Other researchers have also shown that secondary reactions of MTO products formed in the first layer of the catalyst bed lead to the formation of aromatic species.49 Modification with magnesium lead to a decrease in amount of strong acid sites, lowering the formation of aromatics from olefins, and therefore increasing olefin selectivity and catalyst lifetime. For zeolite SSZ-13, it has been shown before that selective removal of paired Al sites using bivalent ion Cu2+ ions led to an increased catalyst lifetime.50 It is possible that a decrease in paired Al sites also plays a role in the increased lifetime of these Mg-ZSM-5 catalysts. Another factor contributing to decreased aromatics formation on Mg-ZSM-5 can be the decreased micropore volume, making the pores too small for aromatics to be formed inside the zeolite pores. For these reasons, during the conversion of methanol, the Mg-modification resulted in an increased olefin selectivity, as well as slower formation of secondary coke, and therefore an increased catalyst lifetime. It is also possible that the Lewis acid sites that are created by the alkaline earth modification play a role in the changed deactivation behaviour of Mg-ZSM-5. However, at this point, the exact role of the Lewis acid sites remains unclear.Because of the decreased olefin aromatization in the Mg-ZSM-5 sample, low aromatic formation was observed during MTO, and from the low amount of aromatics present it can be concluded that methanol conversion proceeds mainly via the alkene cycle, i.e. via methylation of alkene intermediates rather than methylation of aromatic intermediates. More aromatics formation was observed during the MTO process on regular H-ZSM-5, so it is possible that the MTO process over H-ZSM-5 proceeds via the aromatic cycle. However, it is also possible that the methanol conversion over H-ZSM-5 proceeds mainly via the alkene cycle as well, and that aromatics formation is caused mainly by the conversion of MTO products, i.e., olefins, into aromatics.
5. Conclusions
During the methanol-to-olefins (MTO) process over zeolites H-ZSM-5 and Mg-ZSM-5, operando UV-vis spectroscopy was performed at three positions along the reactor bed. For both zeolite materials, a coke front was observed, which progressed through the catalyst bed. Once this coke front reached the end of the catalyst bed, catalyst deactivation was observed. We have defined this coke, that is the result of the conversion of methanol into olefins, as primary coke. Apart from this primary coke that is formed in the methanol conversion zone, in the parts of the reactor bed behind the methanol conversion zone, coke formation caused by secondary reactions of MTO products was also observed. This coke was defined as secondary coke. Additional experiments, in which typical MTO products, i.e., ethylene and propylene, were used as reactants, showed that this secondary coke is the result from aromatization of olefins, which are produced in earlier parts of the catalyst bed during MTO. On H-ZSM-5, secondary coke formation occurs much faster and much more pronounced than on Mg-ZSM-5. The reason for this is that olefin aromatization is reduced on Mg-ZSM-5, because of the altered acidic properties of the zeolite material; the amount of strong Brønsted acid sites is reduced by the magnesium modification. The fact that olefin aromatization is less pronounced on Mg-ZSM-5 results in a higher observed selectivity toward lower olefins for Mg-ZSM-5 compared to H-ZSM-5. Furthermore, since the secondary coke formation is slower, Mg-ZSM-5 has a 3.4 times longer lifetime than H-ZSM-5.Conflicts of interest
There are no conflicts to declare.Acknowledgements
This research received funding from the Netherlands Organisation for Scientific Research (NWO) in the framework of the TASC Technology Area “Syngas, a Switch to Flexible New Feedstock for the Chemical Industry (TA-Syngas)”. The authors would like to thank Ramon Oord and Anne-Eva Nieuwelink for assistance with the operando experiments. Lennart Weber is acknowledged for performing the Ar physisorption measurements.References
- J. F. Haw, W. Song, D. M. Marcus and J. B. Nicholas, Acc. Chem. Res., 2003, 36, 317–326 CrossRef CAS PubMed.
- A. D. Chowdhury, K. Houben, G. T. Whiting, M. Mokhtar, A. M. Asiri, S. A. Al-Thabaiti, S. N. Basahel, M. Baldus and B. M. Weckhuysen, Angew. Chem., Int. Ed., 2016, 55, 15840–15845 CrossRef CAS PubMed.
- Y. Liu, S. Müller, D. Berger, J. Jelic, K. Reuter, M. Tonigold, M. Sanchez-Sanchez and J. A. Lercher, Angew. Chem., Int. Ed., 2016, 55, 5723–5726 CrossRef CAS PubMed.
- X. Wu, S. Xu, W. Zhang, J. Huang, J. Li, B. Yu, Y. Wei and Z. Liu, Angew. Chem., Int. Ed., 2017, 56, 9039–9043 CrossRef CAS PubMed.
- U. Olsbye, S. Svelle, M. Bjørgen, P. Beato, T. V. W. Janssens, F. Joensen, S. Bordiga and K. P. Lillerud, Angew. Chem., Int. Ed., 2012, 51, 5810–5831 CrossRef CAS PubMed.
- M. Bjørgen, S. Svelle, F. Joensen, J. Nerlov, S. Kolboe, F. Bonino, L. Palumbo, S. Bordiga and U. Olsbye, J. Catal., 2007, 249, 195–207 CrossRef.
- S. Wang, Y. Chen, Z. Wei, Z. Qin, H. Ma, M. Dong, J. Li, W. Fan and J. Wang, J. Phys. Chem. C, 2015, 119, 28482–28498 CAS.
- S. Ilias and A. Bhan, ACS Catal., 2013, 3, 18–31 CrossRef CAS.
- V. Van Speybroeck, K. De Wispelaere, J. Van der Mynsbrugge, M. Vandichel, K. Hemelsoet and M. Waroquier, Chem. Soc. Rev., 2014, 43, 7326–7357 RSC.
- U. Olsbye, S. Svelle, K. P. Lillerud, Z. H. Wei, Y. Y. Chen, J. F. Li, J. G. Wang and W. Fan, Chem. Soc. Rev., 2015, 44, 7155–7176 RSC.
- P. Beato, E. Schachtl, K. Barbera, F. Bonino and S. Bordiga, Catal. Today, 2013, 205, 128–133 CrossRef CAS.
- L. Palumbo, F. Bonino, P. Beato, M. Bjørgen, A. Zecchina and S. Bordiga, J. Phys. Chem. C, 2008, 112, 9710–9716 CAS.
- Q. Qian, C. Vogt, M. Mokhtar, A. M. Asiri, S. A. Al-Thabaiti, S. N. Basahel, J. Ruiz-Martínez and B. M. Weckhuysen, ChemCatChem, 2014, 6, 3396–3408 CrossRef CAS.
- Y. Jiang, J. Huang, V. R. Reddy Marthala, Y. S. Ooi, J. Weitkamp and M. Hunger, Microporous Mesoporous Mater., 2007, 105, 132–139 CrossRef CAS.
- D. Mores, E. Stavitski, M. H. F. Kox, J. Kornatowski, U. Olsbye and B. M. Weckhuysen, Chem. – Eur. J., 2008, 14, 11320–11327 CrossRef CAS PubMed.
- E. Borodina, F. Meirer, I. Lezcano-González, M. Mokhtar, A. M. Asiri, S. A. Al-Thabaiti, S. N. Basahel, J. Ruiz-Martínez and B. M. Weckhuysen, ACS Catal., 2015, 5, 992–1003 CrossRef CAS.
- J. Goetze, F. Meirer, I. Yarulina, J. Gascon, F. Kapteijn, J. Ruiz-Martínez and B. M. Weckhuysen, ACS Catal., 2017, 7, 4033–4046 CrossRef CAS PubMed.
- E. Borodina, H. Sharbini Harun, F. Meirer Kamaluddin, M. Mokhtar, A. M. Asiri, S. A. Al-Thabaiti, S. N. Basahel, J. Ruiz-Martinez and B. M. Weckhuysen, ACS Catal., 2017, 5, 5268–5281 CrossRef PubMed.
- K. De Wispelaere, C. S. Wondergem, B. Ensing, K. Hemelsoet, E. J. Meijer, B. M. Weckhuysen, V. Van Speybroeck and J. Ruiz-Martínez, ACS Catal., 2016, 6, 1991–2002 CrossRef CAS.
- J. F. Haw and D. M. Marcus, Top. Catal., 2005, 34, 41–48 CrossRef CAS.
- H. Schulz, Catal. Today, 2010, 154, 183–194 CrossRef CAS.
- D. Rojo-Gama, S. Etemadi, E. Kirby, K. P. Lillerud, P. Beato, S. Svelle and U. Olsbye, Faraday Discuss., 2017, 197, 421–446 RSC.
- J. Q. Chen, A. Bozzano, B. Glover, T. Fuglerud and S. Kvisle, Catal. Today, 2005, 106, 103–107 CrossRef CAS.
- F. L. Bleken, S. Chavan, U. Olsbye, M. Boltz, F. Ocampo and B. Louis, Appl. Catal., A, 2012, 447–448, 178–185 CrossRef CAS.
- S. Ilias and A. Bhan, J. Catal., 2012, 290, 186–192 CrossRef CAS.
- S. Ilias, R. Khare, A. Malek and A. Bhan, J. Catal., 2013, 303, 135–140 CrossRef CAS.
- F. L. Bleken, M. Bjørgen, L. Palumbo, S. Bordiga, S. Svelle, K.-P. Lillerud and U. Olsbye, Top. Catal., 2009, 52, 218–228 CrossRef CAS.
- I. Yarulina, S. Bailleul, A. Pustovarenko, J. R. Martinez, K. De Wispelaere, J. Hajek, B. M. Weckhuysen, K. Houben, M. Baldus, V. Van Speybroeck, F. Kapteijn and J. Gascon, ChemCatChem, 2016, 8, 3057–3063 CrossRef CAS.
- I. A. Bakare, O. Muraza, M. Yoshioka, Z. H. Yamani and T. Yokoi, Catal. Sci. Technol., 2016, 6, 7852–7859 CAS.
- H. Okado, H. Shoji, T. Sano, S. Ikai, H. Hagiwara and H. Takaya, Appl. Catal., 1988, 41, 121–135 CrossRef CAS.
- D. Goto, Y. Harada, Y. Furumoto, A. Takahashi, T. Fujitani, Y. Oumi, M. Sadakane and T. Sano, Appl. Catal., A, 2010, 383, 89–95 CrossRef CAS.
- C. Chen, Q. Zhang, Z. Meng, C. Li and H. Shan, Appl. Petrochem. Res., 2015, 5, 277–284 CrossRef CAS.
- S. Zhang, B. Zhang, Z. Gao and Y. Han, Ind. Eng. Chem. Res., 2010, 49, 2103–2106 CrossRef CAS.
- S. Zhang, B. Zhang, Z. Gao and Y. Han, React. Kinet., Mech. Catal., 2010, 99, 447–453 CAS.
- Y. Wang, S. Chen, Y. Gao, Y. Cao, Q. Zhang, W. Chang and J. B. Benziger, ACS Catal., 2017, 5572–5584 CrossRef CAS.
- M. Gaab, U. Müller, M. Kostur, K. Spannhof, K. Bay and A.-N. Parvulescu, US20140135556A1, 2014.
- T. A. Nijhuis, S. J. Tinnemans, T. Visser and B. M. Weckhuysen, Phys. Chem. Chem. Phys., 2003, 5, 4361–4365 RSC.
- A. Zecchina, S. Bordiga, G. Spoto, D. Scarano, G. Petrini, G. Leofanti, M. Padovan and C. O. Areàn, J. Chem. Soc., Faraday Trans., 1992, 88, 2959–2969 RSC.
- H. Knözinger and S. Huber, J. Chem. Soc., Faraday Trans., 1998, 94, 2047–2059 RSC.
- L. R. Aramburo, L. Karwacki, P. Cubillas, S. Asahina, D. A. M. de Winter, M. R. Drury, I. L. C. Buurmans, E. Stavitski, D. Mores, M. Daturi, P. Bazin, P. Dumas, F. Thibault-Starzyk, J. A. Post, M. W. Anderson, O. Terasaki and B. M. Weckhuysen, Chem. – Eur. J., 2011, 17, 13773–13781 CrossRef CAS PubMed.
- M. D. Watson, A. Fechtenkötter and K. Müllen, Chem. Rev., 2001, 101, 1267–1300 CrossRef CAS PubMed.
- K. Hemelsoet, Q. Qian, T. De Meyer, K. De Wispelaere, B. De Sterck, B. M. Weckhuysen, M. Waroquier and V. Van Speybroeck, Chem. – Eur. J., 2013, 19, 16595–16606 CrossRef CAS PubMed.
- V. Van Speybroeck, K. Hemelsoet, K. De Wispelaere, Q. Qian, J. Van der Mynsbrugge, B. De Sterck, B. M. Weckhuysen and M. Waroquier, ChemCatChem, 2013, 5, 173–184 CrossRef CAS.
- G.-Y. Cai, G.-Q. Chen, Q.-X. Wang, Q. Xin, X.-Z. Wang, Z.-Z. Wang, X.-Y. Li and J. Liang, Stud. Surf. Sci. Catal., 1985, 24, 319–327 CrossRef CAS.
- S. L. Fegade, B. M. Tande, H. Cho, W. S. Seames, I. Sakodynskaya, D. S. Muggli and E. I. Kozliak, Chem. Eng. Commun., 2013, 200, 1039–1056 CrossRef CAS.
- Y. Song, X. Zhu and L. Xu, Catal. Commun., 2006, 7, 218–223 CrossRef CAS.
- Y. Song, X. Zhu, S. Xie, Q. Wang and L. Xu, Catal. Lett., 2004, 97, 31–36 CrossRef CAS.
- X. Li, S. Liu, X. Zhu, Y. Wang, S. Xie, W. Xin, L. Zhang and L. Xu, Catal. Lett., 2011, 141, 1498–1505 CrossRef CAS.
- S. Müller, Y. Liu, M. Vishnuvarthan, X. Sun, A. C. van Veen, G. L. Haller, M. Sanchez-Sanchez and J. A. Lercher, J. Catal., 2015, 325, 48–59 CrossRef.
- M. A. Deimund, L. Harrison, J. D. Lunn, Y. Liu, A. Malek, R. Shayib and M. E. Davis, ACS Catal., 2016, 6, 542–550 CrossRef CAS.
Footnote |
| † Electronic supplementary information (ESI) available. See DOI: 10.1039/c7cy02459b |
| This journal is © The Royal Society of Chemistry 2018 |

