The selective hydrogenation of furfural over supported palladium nanoparticle catalysts prepared by sol-immobilisation: effect of catalyst support and reaction conditions†
Reem
Albilali
 *a,
Mark
Douthwaite
 b,
Qian
He
b and
Stuart H.
Taylor
 *b
*b
aDepartment of Chemistry, College of Science, Imam Abdulrahman Bin Faisal University, P.O. Box 1982, Dammam 31441, Saudi Arabia. E-mail: ralblali@iau.edu.sa
bCardiff Catalysis Institute, School of Chemistry, Cardiff University, Main Building, Park Place, Cardiff, CF10 3AT, UK. E-mail: taylorsh@cardiff.ac.uk
First published on 15th November 2017
Abstract
The selective hydrogenation of bio-derived furfural was investigated under mild conditions using a series of supported palladium catalysts prepared by a sol-immobilisation technique. Catalysts using alumina and titania supports were more selective towards tetrahydrofurfuryl alcohol. The catalytic activity of 1.19% Pd/TiO2 was evaluated under different reaction conditions and higher selectivity towards tetrahydrofurfuryl alcohol was observed when using 2-propanol as a solvent, and the yield of tetrahydrofurfuryl alcohol decreased as reaction temperature increased. The performance of the Pd catalyst was enhanced by the addition of Pt and a 95% yield of tetrahydrofurfuryl alcohol was achieved. The catalysts were characterised using a range of techniques, and the synergistic effect of adding Pt to Pd was due to an electronic promotional effect.
1. Introduction
The social, political and environmental issues surrounding the manufacture of 1st generation biofuels have somewhat limited their global application.1 As a consequence, interest in the synthesis of liquid fuels and fine chemicals from lignocellulosic feedstocks has increased, due to their high natural abundance and sustainability.2,3 However, the valorisation of such feedstocks is currently economically limited due to the extensive processing steps required. As such, interest in the development of technologies to facilitate the conversion of lignocellulosic feedstocks to high-value compounds has increased significantly in recent years.4 Furfural (FF) is produced from the hydrolysis and dehydration of lignocellulosic feedstocks.2 It has very few direct applications, but is considered to harbour a lot of potential as a highly desirable platform chemical.5The selective hydrogenation of FF over heterogeneous catalysts has been investigated in significant detail in recent years, the progress of which has been documented in some current reviews.6,7 The products of this hydrogenation reaction have a variety of different industrial applications. Furfuryl alcohol (FA), which is produced from the chemoselective hydrogenation of the formyl group, is used as a monomer for the formation of furanic resins,8 in addition to its potential as a fuel.9 Furthermore, the total hydrogenation of FF gives tetrahydrofurfuryl alcohol (THFA), which is considered to be an environmentally benign green solvent due to its biodegradable nature.10 The hydrodeoxygenation of FF produces 2-methylfuran (MF), which also has potential to be utilised as a fuel additive.11 In addition to the above, the hydrogenation of FF can also lead to the formation of numerous other products via ring-opening, decarbonylation and rearrangement pathways.12 Accordingly, tuning the reaction selectivity towards a specific product is challenging but can be achieved through catalyst design.
It is clear from studies of FF hydrogenation that the selection of the catalytic metal, support, reaction conditions and solvent can drastically influence the product distribution. Polar solvents have been found to significantly promote the rate of these hydrogenation reactions, but can also lead to the formation of acetyl and/or ester adducts.13 It has been shown that the formation of these by-products can be suppressed through the utilization of some non-polar solvents, but solvents of this nature also significantly reduce the reaction rate. Further drastic changes in the selectivity profile can also be observed; water facilitates the rearrangement of FF to cyclopentanone14,15 and the ring opening of furfuryl alcohol (FA) to produce diols.16 Dichloroethane was found to promote the hydrodeoxygenation (HDO) of FF to methylfuran (MF).17
The hydrogen pressure in the system can also significantly affect the product distribution. Luo et al.18 recently showed that increasing the hydrogen pressure in the presence of a 10% Pt/C catalyst increased the selectivity to furfuryl alcohol, and that low pressures favoured hydrogenolysis reactions to produce furan. This is consistent with a previous DFT study by Vlachos and co-workers19 who showed that the product distribution is typically dependent on the energy and conformation of adsorbed FF, which in turn is driven by the concentration of hydrogen adsorbed to the surface.
Additional work has investigated the effect of different support and metal combinations. A study by Sitthisa et al.20 showed that Cu, Pd and Ni supported independently on SiO2 each favoured different reaction pathways for the hydrogenation of FF in a continuous flow system. A considerable number of recent studies have focussed on developing supported metal catalysts with mono- and bimetallic combinations of transition metals and, through optimisation of the materials and reaction conditions, extremely high yields of FA are obtainable.21–24 Particle size is also known to have a profound effect on chemoselectivity, with an example being the hydrogenation of α,β-unsaturated aldehydes,25–27 an effect which is likely to be due to an alteration of the substrates' mode of adsorption.28
Whilst a substantial amount of literature reports highly effective systems for the selective hydrogenation and transfer hydrogenation of FF to FA, a much smaller quantity of publications focus on the total hydrogenation of FF to THFA. Table 1 contains some catalytic systems which are reported for the total hydrogenation of FF to FA.
| Catalyst | Solvent | Moles of FF [mmol] | Temp [°C] | H2 pressure [bar] | Catalyst mass [g] | Time [h] | THFA yield [%] | Primary author |
|---|---|---|---|---|---|---|---|---|
| RuO2 | MeOH | 270.61 | 120 | 40 | 2 | 1 | 76 | Merat29 |
| Ni–Pd/SiO2 | H2O | 5 | 40 | 80 | 0.1 | 2 | 96 | Nakagawa30 |
| RANEY® Ni–Al(OH)3 | 2-Propanol | 1.04 | 110 | 30 | 0.05 | 1.25 | >99 | Rodiansono31 |
| Pd–Ir/SiO2 | H2O | 5 | 2 | 80 | 0.15 | 6 | 94 | Nakagawa32 |
| CuNi/MgAlOx | Ethanol | 5 | 150 | 40 | 0.05 | 3 | 95 | Gao33 |
| Pd/C | 2-Propanol | 4.5 | 25 | 5 | 0.096 | 5 | 45 | Rogers34 |
| Ni/C | 2-Propanol | 0.31 | 120 | 30 | 0.03 | 2 | 100 | Su35 |
| Ru–C/TiO2 | 1-Butanol | 1 | 80 | 40 | 0.03 | 5 | 100 | Zhang36 |
Although there are numerous examples of catalytic systems which report exceptionally high yields of THFA from FF, in most cases either a high reaction temperature, high H2 pressure or both are required to achieve them. As such, it would clearly be advantageous to develop a system which could produce similar yields of THFA but under milder reaction conditions.
The preparation of supported metal catalysts by the sol-immobilisation method can have a dramatic effect on the physicochemical properties of the supported metal nanoparticles.37 This technique utilizes a stabilising agent such as polyvinyl alcohol (PVA) or polyvinylpyrrolidone (PVP) to control the growth of the nanoparticles which subsequently leads to the formation of colloidal metal nanoparticles of a well-defined particle size.38 Once the colloids are formed, the metal is subsequently reduced, typically using a reducing agent such as NaBH4. The support material is subsequently added and the pH of the solution is often adjusted to ensure full immobilisation of the metal. The adsorption of the stabilised nanoparticles is typically dependent on the nature of the stabiliser and the isoelectric point, surface functionality and surface area of the support.39,40 It is the defined and often tunable metal particle sizes that make this technique so desirable.
To the best of our knowledge, studies investigating the activity of supported metal catalysts prepared via the sol-immobilization method for the liquid phase hydrogenation of FF are limited. Only a study conducted by Rogers et al.34 highlighted the potential of using Pd/TiO2 catalysts prepared by a sol-immobilization method for the selective hydrogenation of FF, determining that the size of the Pd nanoclusters and the nature of the reaction sites have a significant influence on the reaction selectivity. In this study, we investigate the effect of reaction conditions and support materials on the performance of supported Pd nanoparticles for the selective hydrogenation of FF. All the catalysts were prepared by the sol-immobilisation method to produce catalysts with small and narrow particle size distributions and tested under very mild conditions for the liquid phase hydrogenation of FF. We also present results showing how the catalytic performance of Pd nanoparticles can be enhanced by the addition of Pt to produce supported bimetallic catalysts.
2. Experimental
2.1 Materials (source and purity)
The reagents used were potassium tetrachloropalladate(II) (99.99%, Alfa Aesar), sodium borohydride (98%, Sigma-Aldrich), polyvinyl alcohol (99%, Sigma-Aldrich), furfuryl alcohol (98%, Sigma-Aldrich), furfural (99%, Sigma-Aldrich), γ-valerolactone (99%, Sigma-Aldrich), magnesium oxide (99.9%, BDH), iron(II, III) oxide (99.99%, Sigma-Aldrich), titania P25 (99.9%, Degussa) and activated charcoal (DARCO G-60, ACROS). All experiments were carried out using 2-propanol (99.5%, Fisher Scientific) as a solvent, unless otherwise stated.2.2 Catalyst preparation
The experimental method for the preparation of the mono- and bimetallic catalysts by sol-immobilisation is as follows: desired quantities of K2PdCl4 (0.0183 mol) and/or H2PtCl6 (0.0184 mol) were added to H2O (800 mL g−1 of catalyst prepared) and stirred. To this solution, polyvinyl alcohol (metal/PVA = 0.65 weight ratio, weight average molecular weight Mw = 9000–10![[thin space (1/6-em)]](https://www.rsc.org/images/entities/char_2009.gif) 000 g mol−1, 80% hydrolysed) was added. Subsequently, NaBH4 (NaBH4/metal (mol/mol) = 5) was then introduced. After 30 minutes of sol generation, the colloid was immobilised by adding the support (0.99 g) and the solution was acidified to pH 2 (0.1 M, H2SO4) under vigorous stirring. After 1 hour, the slurry was filtered, and the catalyst was washed thoroughly with distilled water and dried at 110 °C for 16 h.
000 g mol−1, 80% hydrolysed) was added. Subsequently, NaBH4 (NaBH4/metal (mol/mol) = 5) was then introduced. After 30 minutes of sol generation, the colloid was immobilised by adding the support (0.99 g) and the solution was acidified to pH 2 (0.1 M, H2SO4) under vigorous stirring. After 1 hour, the slurry was filtered, and the catalyst was washed thoroughly with distilled water and dried at 110 °C for 16 h.
The experimental method for the preparation of the monometallic Pd/TiO2 catalyst by an impregnation method is as follows: K2PdCl4 (0.00915 mol) was dissolved in 1.6 mL of deionised water and stirred slowly at 80 °C until the salt dissolved completely. The support (0.495 g, commercial P25 TiO2) was subsequently added to the solution under vigorous stirring at 80 °C until a thick paste was formed. The paste was dried at 110 °C for 16 h and the subsequent material was finely ground and calcined at 400 °C under static air for 3 hours with a ramp rate of 20 °C min−1.
2.3 Catalyst testing
Furfural hydrogenation was performed between 30 °C and 60 °C in a Colaver glass reactor. The reactor was charged with FF solution (15 mL; 0.3 M in 2-propanol) and the desired amount of catalyst, typically FF/metal molar ratio = 500, was added to the solution. The reactor was sealed and purged three times with H2 (3 bar) whilst stirring (800 rpm), before finally being charged with H2 (1–3 bar). A continuous reaction pressure was maintained throughout the reaction in order to replenish any H2 consumed. The reaction was conducted for 120 minutes, unless otherwise stated.Catalyst reusability was investigated after the hydrogenation reaction of FF. The catalyst was separated using a simple filtration method and washed with 50 mL of solvent 2-propanol. The separated catalyst was dried at room temperature for 24 hours before being reused. The recycling experiments were continued using the same catalyst and same experimental protocol for five cycles.
2.4 Quantification of products
The reaction effluent was analysed using a GC (Agilent 7890B) fixed with a CP-Wax 52 CB column (25 m × 0.53 mm × 2.0 μm) and a FID. n-Octane was used as an external standard for product quantification. A combination of GC and GC-MS was used to determine the chemical identity of the products, and comparison with authentic standards was carried out to ensure correct identification. The reactant conversion, product selectivity and product yield were calculated on a mole basis using the following formulae:| % Conversion of FF = [(Initial moles of FF − Final moles of FF)/Initial moles of FF] × 100 |
| % Selectivity = (Moles of product formed/Total moles of products identified) × 100 |
| % Yield = [Moles of product formed/Moles of FF(Start)] × 100 |
Attempts were made to calculate the Pd dispersion of the catalysts and determine the initial reaction rate of each catalyst directly from the number of Pd sites detected by CO chemisorption. However, it has been reported previously that the presence of a stabiliser can significantly reduce the quantity of CO that can adsorb to the surface of catalysts prepared by the sol-immobilisation method.41 As such, in this study, the initial rate measurements were estimated by dividing the moles of substrate converted by the mass of metal in the reaction per unit time (h) after 30 minutes.
2.5 Catalyst characterisation
Powder X-ray diffraction (XRD) patterns were collected using a PANalytical X'pert Pro diffractometer with a Ni-filtered CuKα radiation source operating at 40 kV and 40 mA. The diffraction patterns were recorded over the 2θ range 10–80°, and phases were identified by matching them to entries in the International Centre for Diffraction Data (ICDD) database.X-ray photoelectron spectra (XPS) were recorded on a Kratos Axis Ultra DLD spectrometer using a monochromatic Al Kα X-ray source (100 W). Spectra were recorded at analyser pass energies of either 160 eV (survey scans) or 40 eV (detailed scans). Binding energies were referenced to the C(1s) binding energy of adventitious carbon contamination at 284.7 eV, and data were quantified using CasaXPS™ v2.3.15 software, using sensitivity factors supplied by the manufacturer.
Transmission electron microscopy (TEM) was carried out using a JEOL JEM-2100 with a LaB6 filament operating at 200 kV. Powdered catalyst samples were dry dispersed onto lacey carbon-coated 400 mesh copper grids. The mean particle size distributions (based on 300 particles) were subsequently measured using Image J software.
Scanning transmission electron microscopy (STEM) was carried out using an aberration-corrected JEOL JEM ARM 200CF microscope operating at 200 kV. Powdered catalyst samples were dry dispersed onto lacey carbon-coated 300 mesh copper grids. X-ray energy-dispersive (XEDS) spectra were acquired from individual metal nanoparticles by rastering the beam over the entire metal particle, while using a JEOL Centurio 0.9 sr silicon drift detector.
Scanning electron microscopy (SEM) was conducted on a Hitachi TM3030PLUS microscope equipped with a Quantax70 energy-dispersive X-ray spectroscope (EDX, Microanalysis System, Oxford Instruments).
Microwave plasma-atomic emission spectroscopy (MP-AES) was carried out using an Agilent 4100 instrument to determine the metal loading. A known mass of catalyst was added to a dilute aqua regia solution (50 mL of 10% aqueous solution) and left to digest for 16 h. The digested solution was subsequently filtered using PTFE filters (Acrodisc PVDF 0.45 μl) to eradicate any remaining residual support material from the solution. Samples were introduced into a stream of nitrogen plasma via a single pass spray chamber at a pressure of 120 kPa in the absence of any air injection. The instrument was calibrated with 2.5 ppm, 5 ppm and 10 ppm solutions of the metal which were prepared from analytical standard solutions (Agilent, 1000 ppm). Samples were tested three times, and the average of the three results was used to calculate elemental compositions.
Inductively coupled plasma-mass spectrometry (ICP-MS) analysis was performed in order to quantify any metal leaching during the test reactions to determine catalyst performance. The analysis was performed using an Agilent ICP-MS 7900 instrument. Quantitative analysis of the post-reaction effluents was performed in duplicate, and metal concentration was determined following calibration with certified standards.
3. Results and discussion
3.1 Effect of the support on the catalytic performance and reaction mechanism
In order to expand on the recent work by Rogers et al.,34 a series of monometallic Pd catalysts were prepared using a similar colloidal method. Different support materials were utilised in order to investigate how the support affects the activity and selectivity of the Pd nanoparticles. Each reaction was conducted under mild conditions (3 bar hydrogen, 30 °C) in 2-propanol solvent. The results from the initial catalytic screening experiments are displayed in Table 2. The products expected from the hydrogenation of FF using these catalysts are presented in Fig. 1.| Catalyst | Metala loading [%] | Reaction time [min] | Conversion [%] | Selectivity [%] | Initial rate [mol g−1 h−1] | |||||
|---|---|---|---|---|---|---|---|---|---|---|
| FA | THFA | 2-MF | GVL | THFF | Unknown | |||||
| a Pd weight loading determined by MP-AES. | ||||||||||
| Pd/TiO2 | 1.19 | 30 | 36.4 | 41.9 | 20.2 | 0.0 | 14.3 | 23.6 | 0.0 | 2.75 |
| 90 | 98.6 | 4.1 | 33.9 | 0.0 | 12.7 | 26.2 | 23.1 | |||
| 180 | 100.0 | 0.0 | 42.0 | 0.0 | 14.0 | 25.4 | 18.5 | |||
| Pd/C | 1.47 | 30 | 85.2 | 35.3 | 4.2 | 6.1 | 10.6 | 4.5 | 39.2 | 5.21 |
| 90 | 100.0 | 6.2 | 9.3 | 22.5 | 10.5 | 4.6 | 47.0 | |||
| 180 | 100.0 | 0.5 | 9.7 | 15.9 | 8.7 | 4.0 | 61.2 | |||
| Pd/MgO | 1.34 | 30 | 43.0 | 8.5 | 2.3 | 0.0 | 0.0 | 89.1 | 0.0 | 2.89 |
| 90 | 99.2 | 3.1 | 7.2 | 0.0 | 0.0 | 89.7 | 0.0 | |||
| 180 | 100.0 | 0.1 | 9.7 | 0.0 | 0.0 | 80.0 | 10.2 | |||
| Pd/Al2O3 | 1.51 | 30 | 53.5 | 14.4 | 5.8 | 0.0 | 0.0 | 6.6 | 73.3 | 3.19 |
| 90 | 100.0 | 3.0 | 33.3 | 0.0 | 11.0 | 43.1 | 9.5 | |||
| 180 | 100.0 | 0.1 | 36.4 | 0.0 | 11.5 | 42.4 | 9.6 | |||
| Pd/Fe2O3 | 1.57 | 30 | 7.2 | 32.5 | 13.3 | 0.0 | 0.0 | 53.4 | 0.8 | 0.41 |
| 90 | 33.2 | 10.2 | 8.1 | 0.0 | 1.4 | 30.1 | 50.2 | |||
| 180 | 64.2 | 6.4 | 8.5 | 0.0 | 1.3 | 25.2 | 58.6 | |||
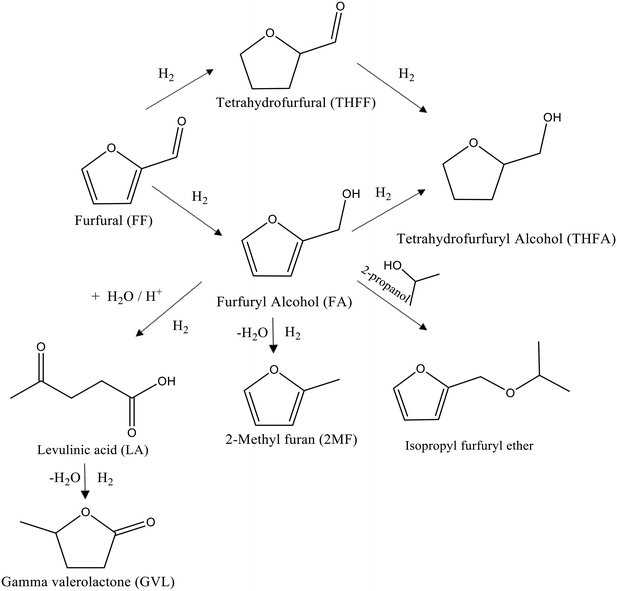 | ||
| Fig. 1 Schematic representation of the possible reaction pathways for the liquid phase hydrogenation of FF under mild conditions in the presence of supported Pd nanoparticles. | ||
It is evident that all the catalysts are active for this reaction and that the support material significantly influences the performance of Pd nanoparticles. The Pd supported on TiO2, C, MgO and Al2O3 achieved full conversion after 180 min, while only 64.2% conversion was observed with Pd/Fe3O4. The initial rates revealed that the Pd/C catalyst exhibited the highest activity among the catalysts tested. An initial rate of 5.21 mol g−1 h−1 was calculated for this catalyst, which was approximately 85% greater than the initial rate observed for Pd supported on TiO2, MgO and Al2O3. Despite the high activity associated with the Pd/C catalyst, the observed product distribution was undesirable, as many unknown products were formed. Previous work has shown that some catalytic systems lead to the formation of ring opening products such as 1,2-pentanediol.16 The formation of many of these ring opening products can be discounted here, as none of them were observed in the post-reaction effluent. Another potential explanation is the participation of the 2-propanol solvent in competitive reactions, leading to the formation of the corresponding ether or acetyl adduct. Merlo and co-workers22 reported that the formation of the corresponding isopropyl ether is possible during the catalysed liquid phase hydrogenation of FF in the presence of 2-propanol, but we did not observe such products. Interestingly, Pd/C appears to facilitate hydrogenolysis of FF to MF, and some of the unknown products may be either intermediates or additional products formed during this pathway. Nevertheless, the conclusion is that the Pd/C catalyst did not show the required control over selectivity.
The other supports tested were more selective to a smaller range of products, and they did not produce significant quantities of unknown products. The Al2O3 and TiO2 supports led to the formation of γ-valerolactone (GVL). It is possible that Brønsted acidic sites in the catalyst promote the ring opening of FA to levulinic acid (LA), which can subsequently be reduced and cyclise to give GVL.
Interestingly, chemoselective hydrogenation is observed with the Fe3O4- and MgO-based catalysts, as they appear to efficiently hydrogenate the unsaturated functional groups in the furan ring. Consequently, high quantities of tetrahydrofurfural (THFF) are observed in the reactions using these catalysts.
Comparison of selectivity at relatively low conversions for catalysts with different supports can also be made from the data in Table 2. For all catalysts, the selectivity after 30 minutes reaction time favours the formation of FA over all other products (THFA, 2MF, GVL, and THFF), suggesting that C![[double bond, length as m-dash]](https://www.rsc.org/images/entities/char_e001.gif) O hydrogenation is favoured over the hydrogenation of the unsaturated groups within the furan ring. As FA is consumed, an increase in the quantity of THFA in the system is observed. Whilst the majority of FA consumed between 30 and 120 minutes is likely to be a result of sequential hydrogenation to THFA, the increase in the yield of THFA does not account for all the FA consumed during this time. This suggests that there are additional competitive reaction pathways proceeding from FA. As discussed previously, Brønsted acidity can promote the formation of GVL from FA which may account for perhaps some of the GVL observed in the system. Another interesting observation that can be made is that THFF appears to be relatively stable in the system; only small quantities of THFF are consumed from 120 to 180 minutes. This implies that the C
O hydrogenation is favoured over the hydrogenation of the unsaturated groups within the furan ring. As FA is consumed, an increase in the quantity of THFA in the system is observed. Whilst the majority of FA consumed between 30 and 120 minutes is likely to be a result of sequential hydrogenation to THFA, the increase in the yield of THFA does not account for all the FA consumed during this time. This suggests that there are additional competitive reaction pathways proceeding from FA. As discussed previously, Brønsted acidity can promote the formation of GVL from FA which may account for perhaps some of the GVL observed in the system. Another interesting observation that can be made is that THFF appears to be relatively stable in the system; only small quantities of THFF are consumed from 120 to 180 minutes. This implies that the C![[double bond, length as m-dash]](https://www.rsc.org/images/entities/char_e001.gif) O moiety in THFF is more difficult to hydrogenate than the furan ring in FA to form THFA. A possible explanation for this is that the C
O moiety in THFF is more difficult to hydrogenate than the furan ring in FA to form THFA. A possible explanation for this is that the C![[double bond, length as m-dash]](https://www.rsc.org/images/entities/char_e001.gif) O in THFF forms a hydrogen bond with the polar O–H moiety in the 2-propanol solvent, while the conjugated π-bond in the furan ring of FA cannot interact with the solvent in the same manner. It's possible that this solvent–substrate interaction would reduce the affinity of the C
O in THFF forms a hydrogen bond with the polar O–H moiety in the 2-propanol solvent, while the conjugated π-bond in the furan ring of FA cannot interact with the solvent in the same manner. It's possible that this solvent–substrate interaction would reduce the affinity of the C![[double bond, length as m-dash]](https://www.rsc.org/images/entities/char_e001.gif) O moiety to adsorb onto the surface of the catalyst which would ultimately reduce the rate of C
O moiety to adsorb onto the surface of the catalyst which would ultimately reduce the rate of C![[double bond, length as m-dash]](https://www.rsc.org/images/entities/char_e001.gif) O hydrogenation. Hu et al.42 observed a similar observation for the catalytic liquid phase hydrogenation of furfural in methyl formate. It was suggested that the high quantity of THFF observed in their system was a result of the ability of the C
O hydrogenation. Hu et al.42 observed a similar observation for the catalytic liquid phase hydrogenation of furfural in methyl formate. It was suggested that the high quantity of THFF observed in their system was a result of the ability of the C![[double bond, length as m-dash]](https://www.rsc.org/images/entities/char_e001.gif) O moiety in furfural to form hydrogen bonds with methyl formate, ultimately making the carbonyl group more difficult to hydrogenate than the furan ring in furfural.
O moiety in furfural to form hydrogen bonds with methyl formate, ultimately making the carbonyl group more difficult to hydrogenate than the furan ring in furfural.
The comparison of the selectivity towards THFA (the desired product) at an initial time of 30 minutes shows that the Pd/TiO2 catalyst has a higher selectivity towards THFA (20.2%) compared with 4.2%, 2.3%, 5.8% and 13.3% for Pd/C, Pd/MgO, Pd/Al2O3 and Pd/Fe2O3, respectively (Table 2). Furthermore, it is clear that the yield of THFA produced increases significantly with reaction time in the presence of Pd/TiO2 and Pd/Al2O3. This increase in the yield of THFA is associated with a decrease in the selectivity towards FA. No FA was detected after 180 minutes of this reaction, in which the selectivity towards THFA reached a maximum of 42% and 36.4% with the Pd/TiO2 and Pd/Al2O3 catalysts, respectively. As such, we can conclude that FA is an intermediate in the conversion of FF to THFA. Furthermore, the yield of THFA is influenced by the type of support used. Fig. 2 shows that the maximum yield of 42% was observed for Pd/TiO2. Given that THFA is the desired product in this study, further reaction optimisation and investigation were focussed on the Pd/TiO2 catalyst.
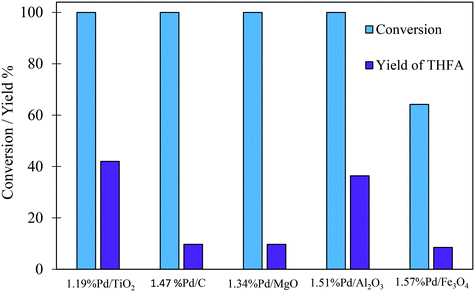 | ||
| Fig. 2 Effect of support on the yield of THFA produced in the liquid phase hydrogenation of FF. Reaction conditions: 0.3 M FF (15 ml), substrate/metal molar ratio = 500, 3 bar H2, 30 °C, 180 min. | ||
The powder X-ray diffraction patterns for catalysts on different supports are displayed in Fig. S1.† The data implies that the Pd metal is well dispersed on all supports, as no diffraction from Pd phases is observable. MP-AES was used to determine the Pd metal loadings associated with each of the catalysts, the results of which are shown in Table 2 and indicate that significant loadings of Pd are present. The range of Pd loadings on different supports varied slightly, but in each case the Pd metal loading fell within the range 1.19 to 1.57 wt%. Thus, we can conclude that the successful immobilisation of Pd onto each support material was achieved.
In order to determine whether reducing the metal loading influences the activity of the Pd nanoparticles, an additional Pd/TiO2 catalyst was prepared with a lower Pd loading and was subsequently tested under the same reaction conditions. The comparison of these two Pd/TiO2 catalysts is displayed in Table S1.† MP-AES confirmed that an appropriate reduction in the Pd loading was achieved as the Pd loading in this catalyst was measured to be 0.57%. Transmission electron microscopy (TEM) was subsequently utilised to assess whether reducing the metal loading has an influence on the Pd particle size distribution. TEM images and the corresponding particle size distributions of the two Pd/TiO2 catalysts with different Pd loadings are displayed in Fig. 3. It can be noted that the palladium particles were well dispersed on the titania support for both catalysts. A small decrease in the mean particle size was observed when decreasing the palladium loading, as the mean particle size reported for the 1.19% Pd/TiO2 and 0.57% Pd/TiO2 catalysts was 3.32 nm and 2.97 nm, respectively. The evaluation of catalytic performance for these catalysts (Table S1†) reveals that the conversion after 30 min decreased from 36.4% to 28.2% when the Pd loading was reduced from 1.19% to 0.57%. This decrease in conversion corresponds to a 15% decrease in the initial reaction rate, decreasing from 2.75 to 2.32 mol g−1 h−1. Assessment of the corresponding product distributions after 30 minutes (conversions of 28.2% and 36.4%) shows that there was no significant change in the quantity of FA observed, with values of 38.4% and 41.9% for the reaction catalysed by the 0.57% Pd/TiO2 and 1.19% Pd/TiO2 catalysts, respectively. In contrast, the yield of THFA decreases significantly from 20% to 11% when reducing the Pd loading from 1.19% to 0.57%. This decrease in the yield of THFA observed upon reducing the Pd loading is associated with a 17% increase in the yield of THFF observed, as the selectivity increased from 23.6% to 40.7% when the Pd loading was reduced. This is consistent with a previous observation that the hydrogenation of the C![[double bond, length as m-dash]](https://www.rsc.org/images/entities/char_e001.gif) O species may be more difficult when the furan ring is saturated; accordingly, the catalyst with low metal loading shows higher quantities of THFF. Increasing the metal loading can enhance the hydrogenation of C
O species may be more difficult when the furan ring is saturated; accordingly, the catalyst with low metal loading shows higher quantities of THFF. Increasing the metal loading can enhance the hydrogenation of C![[double bond, length as m-dash]](https://www.rsc.org/images/entities/char_e001.gif) O over Pd nanoparticles, which is more difficult to hydrogenate using the 0.57% Pd/TiO2 catalyst, resulting in higher selectivity towards THFA at higher Pd loading.
O over Pd nanoparticles, which is more difficult to hydrogenate using the 0.57% Pd/TiO2 catalyst, resulting in higher selectivity towards THFA at higher Pd loading.
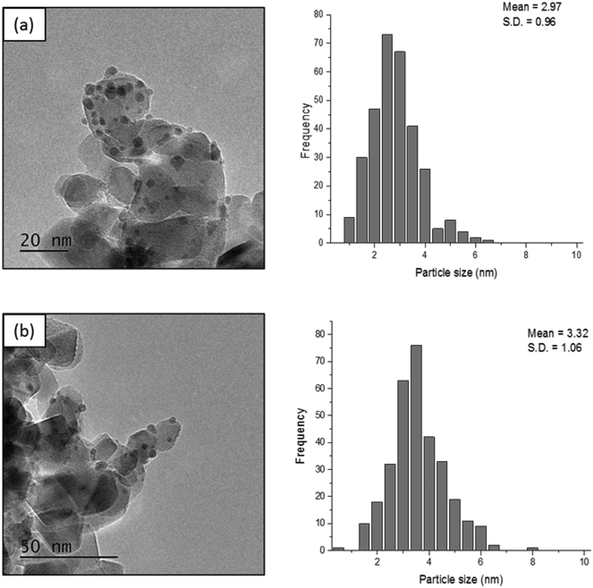 | ||
| Fig. 3 TEM images and the corresponding particle size distributions for (a) 0.57% Pd/TiO2 and (b) 1.19% Pd/TiO2. | ||
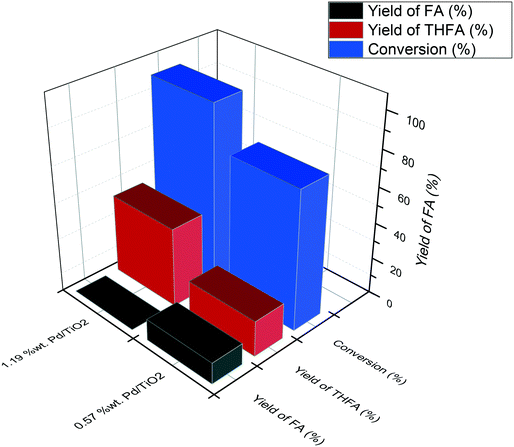
Fig. 4 shows the yields of THFA and FA produced after a reaction time of 120 minutes. In the presence of 1.19% Pd/TiO2, no FA was observed and the yield of THFA reached 43%, while only 20% yield of THFA was observed for the 0.57% Pd/TiO2 catalyst with a substantial quantity of FA still present in the post-reaction effluent (12%). These results reveal that the rate of sequential hydrogenation of FA to THFA decreases by reducing the Pd loading, which is consistent with the decrease of the initial rate of overall hydrogenation.
There are numerous examples of similar catalytic systems which facilitate the transfer hydrogenation of furfural in the presence of 2-propanol.43–46 In each of these examples however, significantly higher reaction temperatures (110 to 200 °C) were required in order to facilitate the transfer hydrogenation. Nevertheless, it was important to eradicate the possibility that these reactions took place within this catalytic system. For this reason, additional reactions were conducted under N2 using the same reaction conditions and catalyst, the results of which are displayed in Table S2.† In the absence of H2, no furfural conversion was observed suggesting that the reductions taking place require H2. Furthermore, no acetone was observed in the post-reaction solutions for the reactions in the presence of both H2 and N2, providing further evidence that the isopropanol does not provide hydrogen in the reaction. An additional reaction was subsequently conducted under N2 in the presence of the TiO2 support material in order to eradicate any possibility that this material facilitated a transfer hydrogenation reaction. As with the reaction conducted in the presence of Pd/TiO2, no conversion of FF or production of acetone was observed.
SEM-EDX analysis was carried out to provide more information about the morphology of these two catalysts, the results of which are displayed in Fig. S2.† Both catalysts exhibit similar morphologies. The Pd loadings calculated using EDX for 0.57% Pd/TiO2 and 1.19% Pd/TiO2 are 0.59% and 1.10%, respectively, which are consistent with the Pd loadings reported from MP-AES. The metal elemental mapping images for both catalysts are shown in Fig. S3.Error! Bookmark not defined. It can be noted that Pd was less densely distributed in 0.57% Pd/TiO2 compared with the 1.19% catalyst, and this is most likely expected as there is only a slight change in Pd particle size from 2.97 nm to 3.32 nm for 0.57% Pd/TiO2 and 1.19 Pd/TiO2, respectively. As such, it can be concluded that the density of Pd in the catalyst is predominantly related to the Pd content. Considering that the applied FF/Pd molar ratio of 500![[thin space (1/6-em)]](https://www.rsc.org/images/entities/char_2009.gif) :
:![[thin space (1/6-em)]](https://www.rsc.org/images/entities/char_2009.gif) 1 remained equal during catalyst testing, and there is no significant change in the mean particle size obtained from the TEM images for both catalysts, hence we can conclude that the main factor which enhances the catalytic activity of the 1.19% Pd/TiO2 catalyst is its greater number of surface Pd sites available.
1 remained equal during catalyst testing, and there is no significant change in the mean particle size obtained from the TEM images for both catalysts, hence we can conclude that the main factor which enhances the catalytic activity of the 1.19% Pd/TiO2 catalyst is its greater number of surface Pd sites available.
X-ray photoelectron spectroscopy (XPS) was conducted to obtain further information regarding the oxidation state of Pd and elemental distribution on the surface of each TiO2-supported catalyst. The corresponding spectroscopic data is presented in Fig. 5 and Table S3.Error! Bookmark not defined. Two dominant peaks with binding energies of 335.3 and 336.6 eV are observed in the spectra of each catalyst and correspond to the Pd(3d5/2) spin–orbit coupled peaks of palladium. It is clear that Pd is present in both its metallic state (Pd0) and oxidised state (Pd2+) in all the catalyst samples. As shown in Fig. 5, the Pd(3d5/2) peak can be fitted to two dominant peaks, with binding energies of 335.3 and 336.6 eV. The peak at 335.3 eV can be assigned to the metallic state of palladium, while the other peak at 336.6 eV can be assigned to Pd2+ in PdO.47,48 The Pd0/Pd2+ ratio does not appear to correlate with differences in catalyst performance. The XPS spectrum of the used 1.19% Pd/TiO2 displayed in Fig. 6 shows that only Pd0 is present in the used catalyst, which indicates that PdO supported on TiO2 readily reduces in the presence of H2 at ambient temperature.49
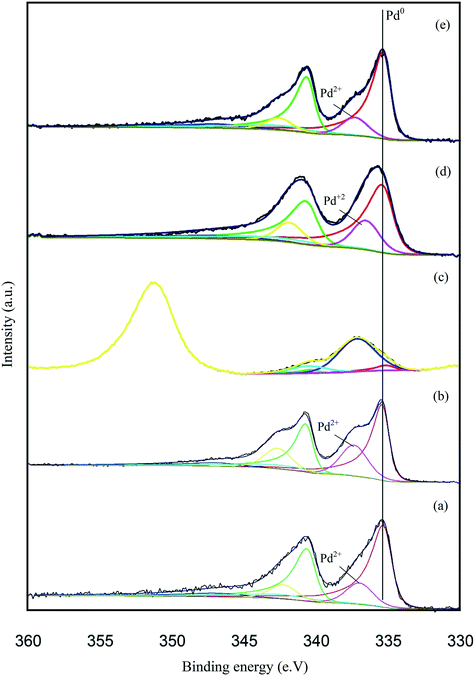 | ||
| Fig. 5 Pd 3d core-level XPS spectra of the supported Pd catalysts: (a) 1.19% Pd/TiO2, (b) 1.47% Pd/C, (c) 1.34% Pd/MgO, (d) 1.51% Pd/Al2O3 and (e) 1.57% Fe3O4. | ||
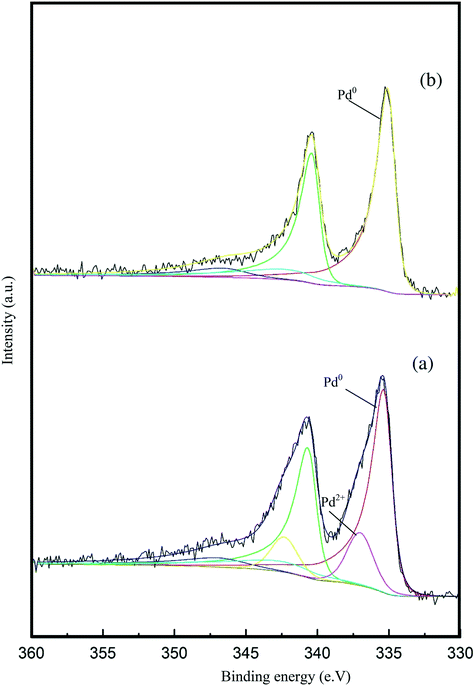 | ||
| Fig. 6 Pd 3d core-level XPS spectra of the 1.19% Pd/TiO2 catalyst: (a) fresh sample and (b) used sample after the liquid phase dehydrogenation of FF. | ||
To evaluate the leaching of Pd from each catalyst prepared using different supports, ICP-MS analysis was conducted on the post-reaction effluent of each reaction (Table S4†). Pd metal was detected in the post-reaction effluents with each of the catalysts, but the concentration of Pd was low. In each case, less than 0.1% of Pd was leached from each of the catalysts, which indicates that the binding of the metal nanoparticles to the different surfaces was a stable process under our reaction conditions.
As the 1.19% Pd/TiO2 catalyst was found to provide the highest yields of THFA, an additional investigation was conducted in order to emphasise the benefit of using sol-immobilisation as a means of preparing supported Pd catalysts. For this, an additional Pd/TiO2 catalyst (Pd loading calculated to be 1.10 wt%) was prepared using a conventional impregnation method and tested for the hydrogenation of furfural under the same reaction conditions, the results of which are displayed in Fig. S4.† It was determined that the catalyst prepared by the sol-immobilisation method displayed an initial activity approximately 80% higher than that of the catalyst prepared by the conventional impregnation method. Interestingly, an 18% reduction in selectivity to THFA was also observed with the catalyst prepared by the impregnation method. It is known that the sol-immobilisation method typically yields supported metal catalysts with a significantly smaller metal particle size with a narrower particle size distribution than identical catalysts prepared by impregnation methods.50,51 As such, the significant difference in the activity of these catalysts can be attributed to a particle size effect.
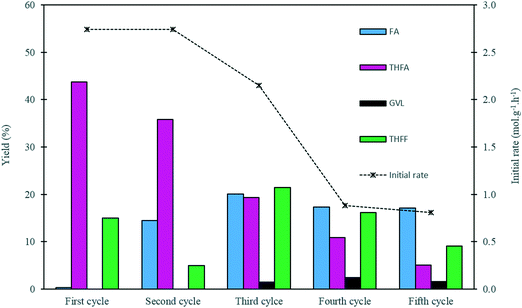
In order to evaluate the stability of the 1.19% Pd/TiO2 catalyst prepared by the sol-immobilisation method, a series of recycling experiments were conducted. The results from this study are displayed in Fig. 7 and Table S5.† The catalyst preserved its catalytic activity for 2 cycles, as the initial rate of 2.74 mol g−1 h−1 remained constant during the first two runs. A slight decrease in the yield of THFA was observed in the second cycle, as the yield of THFA decreased from 43% to 36%. This decrease in the THFA yield is associated with a 14% increase in the yield of FA, which indicates that the rate of the sequential hydrogenation of FA to THFA in the second run was reduced. In the third cycle, the catalytic activity in terms of the initial rate decreased by 20% from its original value with a 56% decrease in the yield of THFA compared with the THFA yield from the first cycle. A further drop in the activity was observed during the fourth and fifth runs, as the initial rate decreased by approximately 70% with values of 0.88 and 0.81 mol g−1 h−1 for the fourth and fifth cycles, respectively, with a continuous decrease in the yield of THFA observed upon subsequent reactions. This decrease in activity may be attributed to a number of possibilities, including leaching of Pd, a change in Pd particle size, and deactivation of some active sites on the surface of the catalyst. Leaching of Pd seems unlikely considering the low Pd leaching measured previously. Nevertheless, Pd leaching was measured after each run. The concentration of Pd in solution after each use was negligible, and was found to lie in the range 0.048–0.066 ppm. This corresponds to a maximum leaching of 0.1% of available Pd in each use, and hence loss of active metal through leaching was not considered to be an important factor in the loss of activity on reuse.
The particle size distribution obtained from TEM images for the used 1.19% Pd/TiO2 catalyst after five cycles of use is shown in Fig. S5.† There was a slight increase in the mean particle size, with a value of 3.82 nm for the catalyst after five cycles, compared to 3.32 nm for the fresh catalyst. The slight increase of particle size will result in some loss of metal surface area, however the more drastic decrease of activity is greater than would be expected for the minor loss of metal surface area. Hence, we conclude that the loss of activity also has a contribution attributed to the deactivation of some active sites on the surface of the catalyst. Rogers et al.34 concluded that deactivation of 1% Pd/TiO2 prepared using sol-immobilization and used for the liquid phase hydrogenation of FF under mild conditions (5 bar hydrogen, 25 °C) was due to the formation of palladium carbide, which affected hydrogen dissociation and influenced the adsorption of C![[double bond, length as m-dash]](https://www.rsc.org/images/entities/char_e001.gif) O and C
O and C![[double bond, length as m-dash]](https://www.rsc.org/images/entities/char_e001.gif) C functionalities.
C functionalities.
3.2 Effect of reaction conditions on catalyst performance
The reaction solvent usually has an impact on the catalytic activity in a liquid-phase reaction. A comparison of 2-propanol, 2-butanol, toluene and 1,2-dichloroethane as solvents was conducted to investigate the influence on the catalytic performance for FF hydrogenation. The experiments were carried out using a 1.19% Pd/TiO2 catalyst under 3 bar H2, FF/Pd molar ratio = 500 and a temperature of 30 °C, the results of which are represented in Fig. 8. It can be observed that variation of the solvent can influence both the product distribution and reaction rate. Among the solvents tested, 2-butanol was found to facilitate the highest rate of FF hydrogenation with a conversion of 49% after 30 minutes, compared with 36%, 32% and 13% when using 2-propanol, 1,2-dichloroethane and toluene, respectively. Despite the high rate of FF hydrogenation observed with 2-butanol, the selectivity towards THFA and FA decreased by 40% and 45%, respectively, when compared to the reaction conducted in 2-propanol. This decrease in the THFA and FA selectivities was associated with a 30% increase in the selectivity towards THFF in the presence of 2-butanol, which indicates that the hydrogenation of unsaturated bonds within the furan ring is more favourable than the hydrogenation of C![[double bond, length as m-dash]](https://www.rsc.org/images/entities/char_e001.gif) O on FF in 2-butanol. In contrast, the conversion decreased significantly by 62% when the reaction was conducted in toluene instead of 2-propanol. Hu et al.42 reported that a shielding effect resulting from an interaction between the conjugated π system in both furfural and toluene can be a factor which negatively affected the rate of hydrogenation of both the furan ring and carbonyl group in furfural when the reaction was conducted in toluene. An additional explanation was proposed by Merlo et al.22 who also observed a significant reduction in catalytic activity when comparing the rate of reaction in polar and non-polar solvents. It was noted that a significant reduction in catalytic activity was observed for a supported Pd catalyst when the reaction was conducted in the presence of toluene instead of isopropanol, where the dielectric constant (ε) of each equal 2.0 and 18.3, respectively.
O on FF in 2-butanol. In contrast, the conversion decreased significantly by 62% when the reaction was conducted in toluene instead of 2-propanol. Hu et al.42 reported that a shielding effect resulting from an interaction between the conjugated π system in both furfural and toluene can be a factor which negatively affected the rate of hydrogenation of both the furan ring and carbonyl group in furfural when the reaction was conducted in toluene. An additional explanation was proposed by Merlo et al.22 who also observed a significant reduction in catalytic activity when comparing the rate of reaction in polar and non-polar solvents. It was noted that a significant reduction in catalytic activity was observed for a supported Pd catalyst when the reaction was conducted in the presence of toluene instead of isopropanol, where the dielectric constant (ε) of each equal 2.0 and 18.3, respectively.
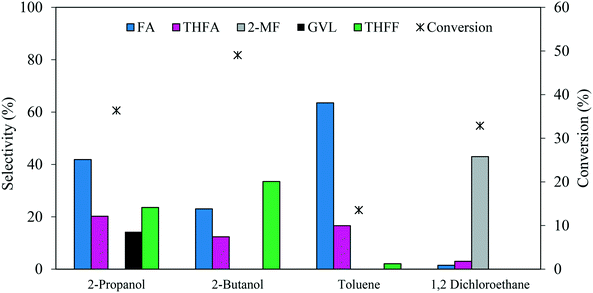 | ||
| Fig. 8 Effect of solvent on the catalysed hydrogenation of FF over 1.19% Pd/TiO2. Reaction conditions: 0.3 M FF (15 ml), substrate/metal molar ratio = 500, 3 bar H2, 30 °C, reaction time = 30 min. | ||
Interestingly, a significant change in the product distribution was observed when the reaction was conducted in 1,2-dichloroethane. Large quantities of 2-MF and much lower quantities of FA and THFA were formed, suggesting that 1,2-dichloroethane favours hydrodeoxygenation (HDO) of FF over hydrogenation. The promotional effect of 1,2-dichloroethane on the HDO of FF has already been reported for reactions conducted in the presence of Ru–Pd/TiO2 bimetallic catalysts.17,52
Further experiments were conducted in order to evaluate the influence of the reaction temperature on the product distribution. The experiments were carried out using 1.19% Pd/TiO2 catalysts (conditions: 3 bar H2, solvent 2-propanol). The results from these experiments are displayed in Table 3. It is evident that the initial rate increases as the temperature increases. However, the final conversion after 120 minutes decreased as the temperature was raised from 50 to 60 °C. This decrease in catalytic activity could be due to formation of additional products which inhibit the catalytic performance, indeed the higher temperature resulted in an increased amount of unknown products, which are most likely of the type discussed earlier. Examination of the corresponding product distributions supports this theory, as less THFA and THFF and more FA were observed as the reaction temperature was increased. If we assume that the majority of the THFA is produced by the sequential hydrogenation of FA and THFF, it is likely that this reduction in THFA selectivity is also a result of this product inhibition. Another possible cause for this drop in performance may be a result of the high temperatures facilitating the hydrogenolysis of FF. This would likely result in the presence of residual C1 species on the surface of the catalyst and would supplement the work of Rogers et al.,34 who recently identified that the formation of a Pd carbide species is responsible for catalyst deactivation, reducing the efficiency of FF adsorption on the surface of the Pd cluster.
| Temperature [°C] | Reaction time [min] | Conversion [%] | Selectivity [%] | Initial rate [mol g−1 h−1] | ||||
|---|---|---|---|---|---|---|---|---|
| FA | THFA | GVL | THFF | Unknown | ||||
| 30 | 30 | 36.3 | 41.8 | 20.2 | 14.3 | 23.6 | 0.0 | 2.75 |
| 120 | 100.0 | 0.3 | 43.7 | 15.0 | 29.9 | 11.0 | ||
| 50 | 30 | 44.7 | 31.5 | 12.1 | 9.1 | 13.8 | 33.4 | 3.39 |
| 120 | 100.00 | 10.7 | 27.8 | 14.2 | 10.9 | 36.4 | ||
| 60 | 30 | 56.4 | 19.9 | 3.5 | 3.1 | 7.9 | 65.5 | 4.27 |
| 120 | 73.3 | 38.1 | 11.0 | 8.1 | 12.5 | 30.3 | ||
The catalytic performance of 1.19% Pd/TiO2 was evaluated at varying H2 pressure from 1 to 3 bar at 30 °C. The results are summarised in Table 4. It is evident that the hydrogen pressure has a significant impact on the catalytic activity as the initial rate decreased markedly when the H2 pressure was reduced from 3 to 1 bar. This decrease in the catalytic activity was also accompanied by a decrease in the yield of THFA and FA observed. These results can be attributed to a decrease in the availability of hydrogen in the system, which is a result of a decrease in dissolved H2 as the reaction pressure decreases. Interestingly, at 3 bar hydrogen, we reached 100% conversion of FF with 44% selectivity to THFA after only 120 minutes reaction time. A significant increase in the yield of unknown products was also observed as the H2 pressure was reduced, which could indicate that the reaction pathways, which typically lead to the formation of these unknowns, compete with the hydrogenation reaction pathways. Given that previous work has shown that the hydrogenolysis of FF to furan typically increases at the expense of the hydrogenation products as the H2 pressure decreases,18,19 it is possible that this undesirable reaction leads to the formation of some of the unknown products in the system. If this is to be the case, we must assume that any furan produced from the hydrogenolysis of FF subsequently partakes in another reaction, as no furan is observed in these reactions. Assuming that the Pd carbide formation is a result of the hydrogenolysis of FF as suggested previously, it can be postulated that the formation of this species may also contribute to the drop in catalytic activity observed at lower H2 pressures.
| Hydrogen pressure [bar] | Reaction time [min] | Conversion [%] | Selectivity [%] | Initial rate [mol g−1 h−1] | |||||
|---|---|---|---|---|---|---|---|---|---|
| FA | THFA | 2-MF | GVL | THFF | Unknown | ||||
| 1.00 | 30.00 | 21.56 | 43.38 | 11.22 | 0.00 | 5.57 | 22.00 | 17.83 | 1.63 |
| 120.00 | 62.60 | 21.88 | 18.26 | 0.00 | 10.31 | 19.54 | 30.01 | ||
| 2.00 | 30.00 | 22.98 | 50.77 | 12.21 | 0.00 | 8.71 | 18.09 | 10.21 | 1.74 |
| 120.00 | 96.09 | 9.89 | 27.94 | 0.00 | 16.12 | 15.11 | 30.93 | ||
| 3.00 | 30.00 | 36.36 | 41.87 | 20.21 | 0.00 | 14.31 | 23.57 | 0.04 | 2.75 |
| 120.00 | 100.00 | 0.28 | 43.74 | 0.00 | 15.04 | 29.99 | 10.95 | ||
3.3 Bimetallic Pd–Pt/TiO2 catalyst
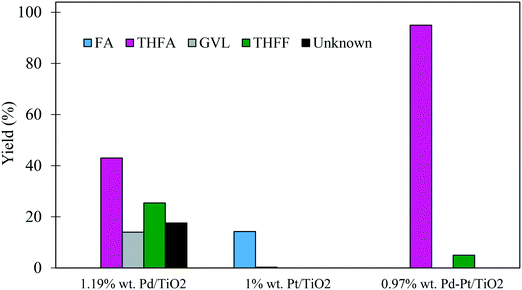
In some cases, the addition of a second metal or a promoter can improve the catalytic activity and/or the selectivity to the desired compound. Recent work has highlighted the potential of using supported PdPt bimetallic catalysts in hydrogenation reactions.53 For this reason, an equimolar bimetallic 0.97% PdPt/TiO2 catalyst was prepared by the same preparation method and tested for the hydrogenation of FF under our standard conditions (3 bar H2, 30 °C). The catalytic performance of the synthesised bimetallic 0.97% PdPt/TiO2 was compared with those of the monometallic 1.19% Pd/TiO2 and 1% Pt/TiO2 catalysts as shown in Table 5. The results reveal that the bimetallic 0.97% PdPt/TiO2 catalyst was far more active than both the 1.19% Pd/TiO2 and 1% Pt/TiO2 monometallic catalysts, as the initial rate calculated after 30 minutes increased to 11.03 mol g−1 h−1 compared with 2.75 and 0.66 mol g−1 h−1 for 1.19% Pd/TiO2 and 1% Pt/TiO2, respectively. Taking into account that the Pt/TiO2 catalyst was significantly less active than the Pd/TiO2 catalyst, it is clear that there is a synergistic interaction between Pd and Pt in the system. Furthermore, the comparison of the product distribution after 240 min for the three catalysts (Fig. 9) shows that a 95% yield of THFA can be achieved when utilizing the bimetallic 0.97% PdPt/TiO2, while only 43% and 0.3% were achieved for the 1.19% Pd/TiO2 and 1% Pt/TiO2 catalysts, respectively.| Catalyst | Metal contenta [wt%] | Reaction time [min] | Conversion [%] | Selectivity [%] | Initial rate [mol g−1 h−1] | ||||||
|---|---|---|---|---|---|---|---|---|---|---|---|
| Pd | Pt | FA | THFA | 2-MF | GVL | THFF | Unknown | ||||
| a Metal content was determined by MP-AES. | |||||||||||
| Pd/TiO2 | 1.19 | — | 30 | 36.4 | 41.9 | 20.2 | 0.0 | 14.3 | 23.6 | 0.00 | 2.75 |
| 120 | 100.0 | 0.3 | 43.7 | 0.0 | 15.0 | 30.0 | 10.95 | ||||
| 240 | 100.0 | 0.0 | 42.0 | 0.0 | 14.0 | 25.4 | 18.52 | ||||
| Pt/TiO2 | — | 1 | 30 | 7.0 | 100.0 | 0.0 | 0.0 | 0.0 | 0.0 | 0.00 | 0.66 |
| 120 | 13.2 | 98.2 | 1.8 | 0.0 | 0.0 | 0.0 | 0.00 | ||||
| 240 | 14.5 | 98.1 | 2.3 | 0.0 | 0.0 | 0.0 | 0.00 | ||||
| Pd–Pt/TiO2 | 0.47 | 0.49 | 30 | 52.9 | 65.7 | 14.7 | 0.0 | 0.0 | 0.0 | 19.62 | 11.03 |
| 120 | 96.8 | 71.3 | 27.3 | 0.0 | 0.0 | 1.5 | 0.00 | ||||
| 240 | 100.0 | 0.0 | 95.0 | 0.0 | 0.0 | 5.0 | 0.00 | ||||
The initial activity of these catalysts is also reflected in the corresponding product distribution. The poorly active Pt/TiO2 displayed exceptionally high selectivity to FA with only trace quantities of the sequential hydrogenation product (THFA) observed. Clearly, Pt favoured the hydrogenation of the formyl species over the hydrogenation of the furan ring, as no THFF was observed in the presence of this monometallic catalyst. Furthermore, the selectivity to THFF observed with the bimetallic system is also significantly lower than that observed with Pd/TiO2. This may also suggest that the 0.97% Pd–Pt/TiO2 catalyst was able to hydrogenate THFF to THFA more effectively, which resulted in an increase in the yield of THFA, reaching 95% after 240 minutes. Another possibility is that Pt in the bimetallic PdPt/TiO2 catalyst affects the chemoselectivity of the catalyst and, as a result, a larger quantity of FA is produced from FF. Considering the mild reaction conditions used in this system, the exceptionally high yield of THFA highlights the potential of using bimetallic PdPt/TiO2 catalysts for the valorisation of FF.
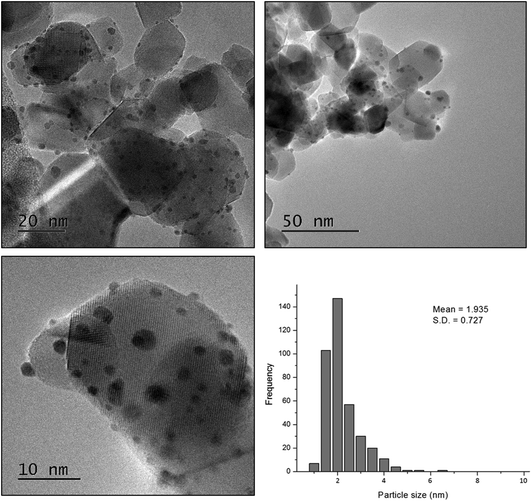
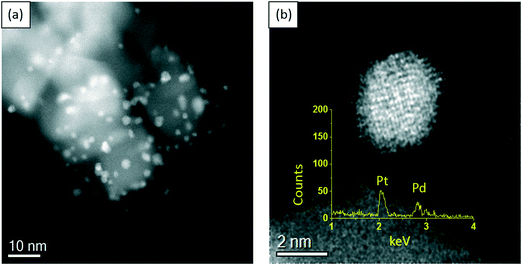
In order to gain more insight into the structure–activity relationship of the bimetallic 0.97% PdPt/TiO2 catalyst, characterization by TEM and XPS was conducted. Fig. 10 represents TEM images of the PdPt/TiO2 catalyst and the corresponding particle size distribution. Interestingly, a mean particle size of 1.94 nm was observed for the 0.97 PdPt/TiO2 catalyst, which is notably smaller than 3.32 nm reported for the 1.19% Pd/TiO2 catalyst. As shown in Fig. 11, the PdPt/TiO2 catalyst was characterized by aberration-corrected scanning transmission electron microscopy (AC-STEM). The nanoalloy formation between Pd and Pt within individual particles was confirmed using X-ray energy-dispersive spectra obtained from individual particles. No segregation or core–shell formation was detected using Z-contrast high angle annular dark field (HAADF) imaging. The formation of random Pd–Pt nanoalloys was consistent with our previous report.54 Hence, it can be inferred that the improved activity of the bimetallic catalyst is influenced by an increased dispersion of the active metal species and a combination of electronic promotional effects, as there is a synergistic combination of Pd and Pt.
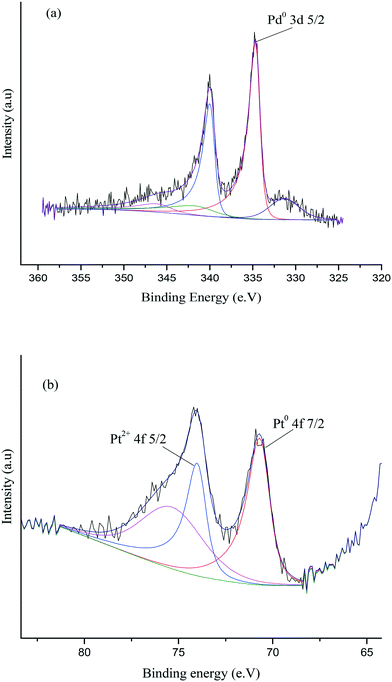
XPS was subsequently utilised in order to further assess the surface nature of the Pd–Pt nanoparticles and oxidation states of Pd and Pt in the catalyst. Fig. 12 shows the XPS spectra for the 0.97% Pd–Pt/TiO2 catalyst and confirms the existence of metallic Pd and metallic Pt on the surface layers. As shown in Fig. 12, the Pd(3d5/2) peak can be fitted to a single peak, with a binding energy of 334.6 eV which can be assigned to the metallic state of palladium, whilst there was no evidence for a Pd2+ peak, which is expected at 336.9 eV. In addition, the Pt(4f) signal can be fitted to two peaks, at 70.6 eV and 73.95 eV. These two peaks are attributed to Pt0 and Pt2+ species, respectively.55,56 The elemental composition obtained from the XPS data is shown in Table S6.† The single metallic oxidation state of Pd in the bimetallic catalyst is in clear contrast to the combination of Pd0 and Pd2+ in the monometallic TiO2-supported catalyst and indicates that there is an electronic modification of the surface Pd through interaction with Pt. We believe that this interaction is important for promoting the activity of FF hydrogenation and indicates that a wealth of bimetallic nanoparticles available for catalyst preparation is now worthy of much further study.
Conclusions
In this study, we have highlighted the potential of using sol-immobilisation as a method for preparing supported Pd-based catalysts for the liquid phase hydrogenation of FF. We have determined that the support material, reaction conditions and solvent system can have a significant effect on both the activity and product selectivity of Pd nanoparticles. Of the supports tested, TiO2 provided the highest selectivity to THFA. Further tests conducted with this catalyst revealed how vital the reaction conditions are to control the reaction selectivity. Subsequent testing conducted in the presence of a PdPt/TiO2 catalyst revealed that a yield of THFA in excess of 95% could be achieved. It was suggested that this increase in performance was a result of an electronic promotional effect from the synergistic combination of Pd and Pt.Conflicts of interest
There are no conflicts to declare.Acknowledgements
We would like to thank Professor Christopher J. Kiely from Lehigh University and the Cardiff Catalysis Institute, Cardiff University, for kind support with the aberration-corrected STEM characterization. R. AlBilali gratefully acknowledges Imam Abdulrahman Bin Faisal University for financial support and the Cardiff Catalysis Institute, School of Chemistry for access to the facilities. The authors would like to thank Dr Greg Shaw for useful discussion and experimental assistance, Dr Thomas Davies for TEM collection, and Dr David Morgan for collection of XPS data.References
- M. M. Gui, K. T. Lee and S. Bhatia, Energy, 2008, 33, 1646–1653 CrossRef CAS.
- J. P. Lange, Biofuels, Bioprod. Biorefin., 2007, 1, 39–48 CrossRef CAS.
- G. Berndes and J. Hansson, Energy Policy, 2007, 35, 5965–5979 CrossRef.
- R. A. Sheldon, Green Chem., 2014, 16, 950–963 RSC.
- J. P. Lange, E. van der Heide, J. van Buijtenen and R. Price, ChemSusChem, 2012, 5, 150–166 CrossRef CAS PubMed.
- R. Mariscal, P. Maireles-Torres, M. Ojeda, I. Sadaba and M. L. Granados, Energy Environ. Sci., 2016, 9, 1144–1189 CAS.
- X. D. Li, P. Jia and T. F. Wang, ACS Catal., 2016, 6, 7621–7640 CrossRef CAS.
- M. Choura, N. M. Belgacem and A. Gandini, Macromolecules, 1996, 29, 3839–3850 CrossRef CAS.
- S. G. Kulkarni and V. S. Bagalkote, J. Energ. Mater., 2010, 28, 173–188 CrossRef CAS.
- N. S. Biradar, A. M. Hengne, S. N. Birajdar, P. S. Niphadkar, P. N. Joshi and C. V. Rode, ACS Sustainable Chem. Eng., 2014, 2, 272–281 CrossRef CAS.
- S. Srivastava, G. C. Jadeja and J. Parikh, Mol. Catal., 2017, 426, 244–256 CrossRef CAS.
- M. G. Dohade and P. L. Dhepe, Green Chem., 2017, 19, 1144–1154 RSC.
- A. O'Driscoll, J. J. Leahy and T. Curtin, Catal. Today, 2017, 279, 194–201 CrossRef.
- R. Q. Fang, H. L. Liu, R. Luque and Y. W. Li, Green Chem., 2015, 17, 4183–4188 RSC.
- M. Hronec, K. Fulajtarova and T. Liptaj, Appl. Catal., A, 2012, 437, 104–111 CrossRef.
- R. F. Ma, X. P. Wu, T. Tong, Z. J. Shao, Y. Q. Wang, X. H. Liu, Q. N. Xia and X. Q. Gong, ACS Catal., 2017, 7, 333–337 CrossRef CAS.
- S. Iqbal, X. Liu, O. F. Aldosari, P. J. Miedziak, J. K. Edwards, G. L. Brett, A. Akram, G. M. King, T. E. Davies, D. J. Morgan, D. K. Knight and G. J. Hutchings, Catal. Sci. Technol., 2014, 4, 2280–2286 CAS.
- J. Luo, M. Monai, H. Yun, L. Arroyo-Ramirez, C. Wang, C. B. Murray, P. Fornasiero and R. J. Gorte, Catal. Lett., 2016, 146, 711–717 CrossRef CAS.
- S. G. Wang, V. Vorotnikov and D. G. Vlachos, ACS Catal., 2015, 5, 104–112 CrossRef CAS.
- S. Sitthisa and D. E. Resasco, Catal. Lett., 2011, 141, 784–791 CrossRef CAS.
- Q. Q. Yuan, D. M. Zhang, L. van Haandel, F. Y. Ye, T. Xue, E. J. M. Hensen and Y. J. Guan, J. Mol. Catal. A: Chem., 2015, 406, 58–64 CrossRef CAS.
- A. B. Merlo, V. Vetere, J. F. Ruggera and M. L. Casella, Catal. Commun., 2009, 10, 1665–1669 CrossRef CAS.
- K. Fulajtarova, T. Sotak, M. Hronec, I. Vavra, E. Dobrocka and M. Omastova, Appl. Catal., A, 2015, 502, 78–85 CrossRef CAS.
- S. B. Liu, Y. Amada, M. Tamura, Y. Nakagawa and K. Tomishige, Green Chem., 2014, 16, 617–626 RSC.
- M. J. Taylor, L. J. Durndell, M. A. Isaacs, C. M. A. Parlett, K. Wilson, A. F. Lee and G. Kyriakou, Appl. Catal., B, 2016, 180, 580–585 CrossRef CAS.
- F. Jiang, J. Cai, B. Liu, Y. B. Xu and X. H. Liu, RSC Adv., 2016, 6, 75541–75551 RSC.
- S. Ganji, S. Mutyala, C. Krishna, P. Neeli, K. Seetha, R. Rao and D. R. Burri, RSC Adv., 2013, 3, 11533–11538 RSC.
- P. Gallezot and D. Richard, Catal. Rev.: Sci. Eng., 1998, 40, 81–126 CAS.
- N. Merat, C. Godawa and A. Gaset, J. Chem. Technol. Biotechnol., 1990, 48, 145–159 CrossRef CAS.
- Y. Nakagawa and K. Tomishige, Catal. Commun., 2010, 12, 154–156 CrossRef CAS.
- Rodiansono, S. Khairi, T. Hara, N. Ichikuni and S. Shimazu, Catal. Sci. Technol., 2012, 2, 2139–2145 CAS.
- Y. Nakagawa, K. Takada, M. Tamura and K. Tomishige, ACS Catal., 2014, 4, 2718–2726 CrossRef CAS.
- J. Wu, G. Gao, J. L. Li, P. Sun, X. D. Long and F. W. Li, Appl. Catal., B, 2017, 203, 227–236 CrossRef CAS.
- S. M. Rogers, C. R. A. Catlow, C. E. Chan-Thaw, A. Chutia, N. Jian, R. E. Palmer, M. Perdjon, A. Thetford, N. Dimitratos, A. Villa and P. P. Wells, ACS Catal., 2017, 7, 2266–2274 CrossRef CAS.
- Y. P. Su, C. Chen, X. G. Zhu, Y. Zhang, W. B. Gong, H. M. Zhang, H. J. Zhao and G. Z. Wang, Dalton Trans., 2017, 46, 6358–6365 RSC.
- Z. R. Zhang, J. L. Song, Z. W. Jiang, Q. L. Meng, P. Zhang and B. X. Han, ChemCatChem, 2017, 9, 2448–2452 CrossRef CAS.
- L. Prati and A. Villa, Acc. Chem. Res., 2014, 47, 855–863 CrossRef CAS PubMed.
- P. Paalanen, B. M. Weckhuysen and M. Sankar, Catal. Sci. Technol., 2013, 3, 2869–2880 CAS.
- A. Villa, D. Wang, G. M. Veith, F. Vindigni and L. Prati, Catal. Sci. Technol., 2013, 3, 3036–3041 CAS.
- F. Porta, L. Prati, M. Rossi, S. Coluccia and G. Martra, Catal. Today, 2000, 61, 165–172 CrossRef CAS.
- J. K. Chinthaginjala, A. Villa, D. S. Su, B. L. Mojet and L. Lefferts, Catal. Today, 2012, 183, 119–123 CrossRef CAS.
- X. Hu, S. Kadarwati, Y. Song and C. Z. Li, RSC Adv., 2016, 6, 4647–4656 RSC.
- X. Chang, A. F. Liu, B. Cai, J. Y. Luo, H. Pan and Y. B. Huang, ChemSusChem, 2016, 9, 3330–3337 CrossRef CAS PubMed.
- P. Panagiotopoulou, N. Martin and D. G. Vlachos, J. Mol. Catal. A: Chem., 2014, 392, 223–228 CrossRef CAS.
- P. Panagiotopoulou and D. G. Vlachos, Appl. Catal., A, 2014, 480, 17–24 CrossRef CAS.
- M. M. Villaverde, T. F. Garetto and A. J. Marchi, Catal. Commun., 2015, 58, 6–10 CrossRef CAS.
- A. N. Geraldes, D. F. da Silva, E. S. Pino, J. C. M. da Silva, R. F. B. de Souza, P. Hammer, E. V. Spinace, A. O. Neto, M. Linardi and M. C. dos Santos, Electrochim. Acta, 2013, 111, 455–465 CrossRef CAS.
- G. Z. Chen, S. J. Wu, H. L. Liu, H. F. Jiang and Y. W. Li, Green Chem., 2013, 15, 230–235 RSC.
- H. Q. Zhu, Z. F. Qin, W. J. Shan, W. J. Shen and J. G. Wang, J. Catal., 2004, 225, 267–277 CrossRef CAS.
- J. A. Lopez-Sanchez, N. Dimitratos, P. Miedziak, E. Ntainjua, J. K. Edwards, D. Morgan, A. F. Carley, R. Tiruvalam, C. J. Kiely and G. J. Hutchings, Phys. Chem. Chem. Phys., 2008, 10, 1921–1930 RSC.
- N. Dimitratos, J. A. Lopez-Sanchez, D. Morgan, A. F. Carley, R. Tiruvalam, C. J. Kiely, D. Bethell and G. J. Hutchings, Phys. Chem. Chem. Phys., 2009, 11, 5142–5153 RSC.
- O. F. Aldosari, S. Iqbal, P. J. Miedziak, G. L. Brett, D. R. Jones, X. Liu, J. K. Edwards, D. J. Morgan, D. K. Knight and G. J. Hutchings, Catal. Sci. Technol., 2016, 6, 234–242 Search PubMed.
- N. Gyorffy and Z. Paal, J. Mol. Catal. A: Chem., 2008, 295, 24–28 CrossRef CAS.
- Q. He, P. J. Miedziak, L. Kesavan, N. Dimitratos, M. Sankar, J. A. Lopez-Sanchez, M. M. Forde, J. K. Edwards, D. W. Knight, S. H. Taylor, C. J. Kiely and G. J. Hutchings, Faraday Discuss., 2013, 162, 365–378 RSC.
- A. Esfandiar, S. Ghasemi, A. Irajizad, O. Akhavan and M. R. Gholami, Int. J. Hydrogen Energy, 2012, 37, 15423–15432 CrossRef CAS.
- H. M. Qin, X. S. Qian, T. Meng, Y. Lin and Z. Ma, Catalysts, 2015, 5, 606–633 CrossRef CAS.
Footnote |
| † Electronic supplementary information (ESI) available. See DOI: 10.1039/c7cy02110k |
| This journal is © The Royal Society of Chemistry 2018 |

