 Open Access Article
Creative Commons Attribution 3.0 Unported Licence
Probing the dynamics of photogenerated holes in doped hematite photoanodes for solar water splitting using transient absorption spectroscopy†
Guang Xian
Pei
,
Jochem H. J.
Wijten
and
Bert M.
Weckhuysen
 *
*
Inorganic Chemistry and Catalysis, Debye Institute for Nanomaterials Science, Utrecht University, Universiteitsweg 99, 3584 CG Utrecht, The Netherlands. E-mail: b.m.weckhuysen@uu.nl
First published on 5th April 2018
Abstract
Hematite (α-Fe2O3) has been extensively studied as a promising candidate for photoelectrochemical water splitting; however its overall efficiency is still relatively low. Doping is believed to be efficient in enhancing the photoactivity, while direct evidence for the promoted charge carrier dynamics is very limited. Herein, transient absorption spectroscopy was used to directly investigate the yield and decay dynamics of the photogenerated holes in Sn and/or Ti doped α-Fe2O3. Sn or Ti doping was observed to have different origins to the enhanced water oxidation photocurrent: Sn doping retarded the electron–hole recombination, while Ti doping mainly increased the photogenerated charge carrier density. Our results also demonstrated that co-doping may combine both advantages to enhance the overall photoactivity of α-Fe2O3.
Introduction
Hydrogen production from solar-driven water splitting has been regarded as one of the most promising routes to address the increasing energy and environmental issues our society is facing. Since the pioneering work by Fujishima and Honda1 on light-driven water splitting over TiO2, there has been considerable progress in developing both new architectures and materials.2,3 Hematite (α-Fe2O3) currently stands out due to its favourable band gap, abundance, nontoxicity, and chemical stability. Its band gap of 1.9–2.2 eV allows the utilization of a significant portion (40%) of the solar spectrum. Although hematite polymorphs have been reported to have low activity for photoactivated hydrogen evolution,4,5 the band gap position of hematite is always used for photocatalytic oxygen evolution reaction and to produce hydrogen at the counter electrode. It has been predicted that a solar-to-hydrogen efficiency of 16.8% could be achieved over hematite.6 However, the reported photoelectrochemical (PEC) activities of hematite are notoriously below this theoretical value.2,3 This is limited by several key factors, including poor carrier mobility and a short hole diffusion length (∼2–4 nm),7 which induce photogenerated holes to recombine with photogenerated electrons before they reach the surface.Element doping (i.e., addition of Ti, Si, Pt, Sn, P and Zr)8–18 has been recognized as an efficient and widely used method to enhance the PEC activities of hematite photoanodes. For example, the dopant of Pt may have different states to play multiple roles in enhancing the PEC activity,10 and non-metallic P doping can enhance the electron mobility, thus improving the PEC activity.16 Among various explored candidates, Sn and Ti are two of the most widely studied dopants that greatly improve the photocurrent. Sn doped hematite can form local pairs of Fe2+–Sn4+ and act as donor centers, causing improved electroconductivity.19 Ti doping has particularly witnessed intensive investigations in recent years;20,21 soft X-ray absorption spectroscopy measurements indicated that Ti incorporated into hematite as Ti4+ while without forming significant concentration of Fe2+.21 Although both physical and PEC properties were extensively investigated, the intrinsic mechanism for both dopants enhancing the photoactivity is under debate. It is proposed and confirmed by various theoretical studies that dopants enhanced the photoactivity by increasing the conductivity.22,23 However, direct evidence is still lacking for how doping affects the dynamics of photogenerated charge carriers.
Transient absorption spectroscopy (TAS) can directly monitor the dynamics of photogenerated charge carriers.24 During the past few years, the dynamics of photogenerated charge carriers in hematite with and without surface modification were intensively studied by Durrant's group,25–33 mainly on a time scale of μs–s, which demonstrated that photocurrents were related to photogenerated long-lived holes,27 and surface modification formed a hetero-conjunction at the surface of hematite films,28–30 thus instead of recombining with photogenerated electrons, surface modification promoted the transfer of holes onto the surface to oxidize water. An ultrafast (fs–ns) TAS study was also undertaken by the same group to explore the effect of applied bias on the ultrafast electron–hole recombination.32 Lian and co-workers found that hematite with different morphologies, which were prepared using different methods, made little difference to their transient absorption spectra on the fs–μs time scale.34 Despite these efforts to understand the charge carrier dynamics in hematite photoanodes, detailed clarification of the role of dopants played in the dynamics of photogenerated charge carriers is limited. This is the topic of this research work.
Experimental
Materials preparation
Hematite films were prepared on fluorine-doped tin oxide (FTO) glass substrates using a modified chemical bath method reported previously.35,36 Typically, a mixture of 0.1 M ferric chloride (FeCl3·6H2O, 97%, Sigma-Aldrich) and 0.15 M urea (CH4N2O, 99%, Acros) was transferred into a glass beaker, in which the substrates of FTO (1 × 3 cm), cleaned and sonicated with acetone, ethanol, 1 M HCl and deionized water, were placed vertically with the conductive sides facing the wall of the beaker. Then, it was sealed and heated at 100 °C for 4 h. After these treatments, a uniform layer of iron oxyhydroxide (FeOOH) nanoarrays was formed on the FTO substrates. The FeOOH nanoarrays were thoroughly rinsed with deionized water and dried with compressed nitrogen, followed by sintering at 500 °C for 3 h and annealing at 750 °C for additional 10 min, the pristine α-Fe2O3 was prepared.Surface doping with Sn was prepared by the same procedure, except that the FeOOH nanoarrays were soaked in a 0.1 M tin tetrachloride (SnCl4·5H2O, 98%, Alfa Aesar) ethanol solution for 10 min before the sintering procedure. Surface doping with Ti was performed by soaking the FeOOH nanoarrays in a 0.1 M titanium oxide acetylacetone ((C5H8O2)2TiO2, Aldrich) isopropanol solution for 10 min prior to the sintering procedure. Surface doping with both Sn and Ti was performed by first soaking the FeOOH nanoarrays in a 0.1 M SnCl4 ethanol solution for 5 min, followed by drying under compressed nitrogen, it was soaked in the 0.1 M (C5H8O2)2TiO2 isopropanol solution for another 5 min. After drying under compressed nitrogen, all the samples were sintered and annealed under the same conditions as pristine α-Fe2O3. The samples were denoted as Fe2O3–Sn, Fe2O3–Ti and Fe2O3–SnTi, respectively.
Structure characterization
The optical properties of the samples were measured on a Varian Cary 50 UV-vis spectrometer. X-ray diffraction (XRD) patterns were recorded on a Bruker D2 Phaser (2nd Gen) instrument with a Co Kα radiation source (λ = 0.1790 nm). The scanning rate was 0.04° per step over an angle (2θ) range from 20 to 85°. The surface morphologies of the samples were examined by scanning electron microscopy (SEM) on a FEI Helios nanolab 600 Dual Beam microscopy (Philips) instrument operating at an acceleration voltage of 2 kV and a current of 0.1 nA measuring secondary electrons. FIB cuts for cross sectional images were made by covering an area of 5 × 2 μm2 of the substrate with 500 nm of Pt by sputtering at 30 kV and 0.08 nA. Then a cut of 7 × 5 μm2 and 5 μm deep is made using an ion beam at 30 kV and 2.5 nA. Finally, the cross section is cleaned with an ion beam at 30 kV, 0.23 nA in an area of 6 × 0.5 μm2 and 5 μm deep near the edge. An image is then taken from the sample at a 52° tilt, 15 kV and 0.8 nA using secondary electrons.Photoelectrochemical test
The photoelectrochemical performance was evaluated in 1 M NaOH (≥99%, Emsure) aqueous solution (pH 13.6) with a three-electrode system under AM 1.5G simulated sunlight. The hematite photoanode was set as the working electrode, and a Pt coil and Ag/AgCl/3 M KCl were used as the counter and reference electrodes, respectively. Potentials were controlled using a potentiostat at a scan rate of 10 mV s−1. The potentials referred to the Ag/AgCl/3 M KCl electrode can be converted to the reversed hydrogen electrode (RHE) scale according to .
.
The applied bias photo-to-current efficiency (ABPE) was calculated according to the equation: ABPE = [jph (mA cm−2) × (1.23 − V) (V vs. RHE) × ηF] × 100%/ 100 (mW cm−2), where jph is the photocurrent density obtained under the applied bias of V referred to the RHE under simulated sunlight (100 mW cm−2).
Transient absorption spectroscopy
The transient absorption measurements of the charge carrier dynamics on the ns–μs time scale were carried out using an EOS multichannel pump–probe transient absorption spectrometer (Ultrafast Systems LLC, Fig. S1, ESI†). A third harmonic of a Nd:YAG laser (355 nm, <1 ns pulse duration, 1 kHz) was used as the excitation source. An excitation energy of 1 μJ per pulse was used with the pump beam spot at the sample ca. 0.05 × 0.1 cm2, which corresponds to a laser intensity of ca. 200 μJ cm−2 pulse−1 for every measurement, except for the excitation intensity study. The probe pulse was generated using a LEUKOS super continuum light source operating at 2 kHz, with a spectral resolution of 1.5 nm.For in situ measurements, the samples were placed in a quartz cuvette with a thickness of 10 mm for the pump and probe beams, and filled with 0.1 M NaOH (pH 12.8) as the electrolyte, Pt coil as the counter electrode, and Ag/AgCl/3 M KCl as the reference electrode. A potentiostat was used to control the potentials. For each measurement, the collection of the transient absorption spectra was started after the photocurrent stabilized for about 10 min.
The decayed percentage of the photogenerated charge carriers was calculated according to the following equation:
Results and discussion
We have investigated the charge carrier dynamics in hematite before and after Sn and/or Ti doping. Doping of the hematite photoanode with either element has been shown to improve the photocurrent for water oxidation. Ultrafast transient absorption spectroscopy (TAS) was used to analyse doping affected charge carrier dynamics, but the role of dopants remains elusive maybe due to the ultrafast time scale (fs–ps).8,9,37 Herein, by using TAS on a time scale of ns–μs, we have managed to explore and compare the different origins of the improvement due to Sn and/or Ti doping.The hematite films used in our study were prepared using a modified chemical bath method.35,36 Briefly, iron oxyhydroxides (FeOOH) were first formed on fluorine-doped tin oxide (FTO) glass substrates, followed by sintering at 500 °C and annealing at 750 °C to produce hematite films. The Sn and/or Ti doped hematite films were prepared by soaking the FeOOH films in the solution containing a Sn or Ti precursor before the sintering procedures. These films showed similar optical properties (Fig. S2a, ESI†), the absorption edges were around 580 nm, corresponding to the band gap of hematite. The crystal structure demonstrated that the films were hematite (Fig. S2b, ESI†), without any additional diffraction peaks detected after Sn and/or Ti modification. The thickness of the films is about 300 nm according to the cross-sectional view of the SEM image (Fig. 1b). Consistent with most of the reported observations,8,9,11,12 with increasing applied bias, either Sn or Ti doping resulted in significant enhancement of the water oxidation photocurrent by more than one-fold (Fig. S3a, ESI†), though compared with pristine hematite the nanostructure of the doped samples should be changed using the surface doping method.16 We note that, Sn and Ti co-doped hematite further increased the photocurrent compared with either Sn or Ti doping. The applied bias photo-to-current efficiency (ABPE) demonstrated that, compared with pristine hematite, doping improved the ABPE and this improvement was much more obvious for co-doped hematite (Fig. S3b, ESI†), indicating that co-doping is much more efficient in enhancing the photoactivity.
To explore the impact of doping on the photogenerated charge carrier dynamics, transient absorption spectra of hematite films on the ns–μs time scale were probed after 355 nm laser excitation. Fig. 2 shows the transient absorption spectra of hematite films without and with Sn and/or Ti doping. Across the probed wavelength range, all the samples demonstrated a feature absorption band around 575 nm, which is ascribed to the trapped photoholes in hematite.25,34 The spectral time evolution of pure hematite was very fast (Fig. 2a), after 1 μs the featured absorption band could hardly be detected. Sn doping contributed little to the intensity of the featured absorption band at 575 nm (Fig. 2b); however, the decreasing rate slowed down, and the spectral intensities between 10 ns and 1 μs were obviously much higher than those of pristine hematite. In terms of Ti doping (Fig. 2c), the intensity of the featured absorption was increased compared with pristine and Sn doped hematite. Although the decreasing rate was fast within the monitored time range, the intensity was still higher compared with pristine hematite. The transient absorption spectra of co-doped hematite displayed higher intensity and a slow decreasing rate (Fig. 2d), thus combining the advantages of both Sn and Ti doping. The origin of this difference will be further discussed in the following section.
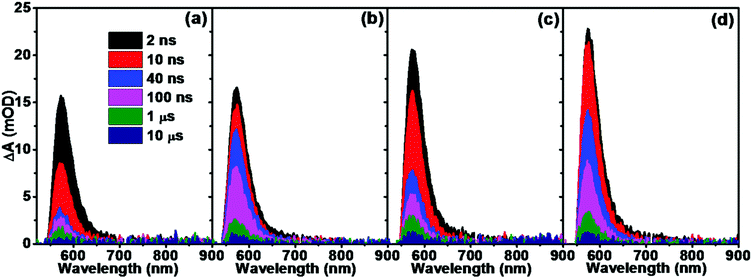 | ||
| Fig. 2 Transient absorption spectra of (a) Fe2O3, (b) Fe2O3–Sn, (c) Fe2O3–Ti and (d) Fe2O3–SnTi following excitation at 355 nm (1 μJ per pulse, 1 kHz). | ||
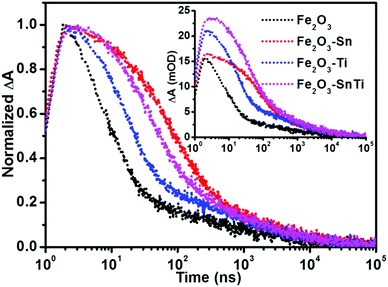
The corresponding kinetic decays were monitored at 575 nm. Before normalization (inset of Fig. 3), which means that all the experimental conditions were the same except for the dopants, Ti doping increased the initial intensity compared with pristine hematite, and Sn and Ti co-doped hematite displayed the highest initial intensity, corresponding to their improved photocurrent (Fig. S3a, ESI†). Sn doping demonstrated the similar initial intensity to pristine hematite, while its kinetic decay was much slower than both pristine and Ti doped hematite. After normalization (Fig. 3), a fast power-law decay for pristine hematite was observed, analogous to the results reported by Durrant's group,25,28 which is ascribed to the bimolecular recombination of photogenerated electrons and holes. It is proposed that the rapid electron–hole recombination in pristine hematite led to its low photoefficiency,13,25,26,38 consistent with the low photocurrent for water oxidation. Ti doping disturbed the fast power-law decay by slowing down the decay process, indicating that the electron–hole recombination was inhibited. It is striking that Sn doping is much more efficient in retarding the recombination of photogenerated electrons and holes than Ti doping, as the kinetic decay was much slower than that of Ti doped hematite. It has been verified by theoretical predictions that doping enhanced the photoactivity by improving the conductivity.22,23 Our transient absorption spectroscopy measurements demonstrated that dopants affected the charge carrier dynamics differently, though both dopants improved the photocurrent at a similar level (Fig. S3a, ESI†).
We further monitored the impact of excitation intensity on the charge carrier dynamics of both pristine and co-doped hematite. As shown in Fig. 4, the initial intensity for both pristine and co-doped hematite increased with increasing excitation intensity, all of which decayed within the monitored time window. The normalized kinetic decays can almost be overlapped (inset of Fig. 4a and b), similar normalized transient absorption spectra were also observed following different excitation intensities (Fig. S4, ESI†), indicating that the kinetic decays occurred in the similar way despite different excitation intensities. It is believed that the high excitation intensity corresponds to more separated charge carriers, thus the recombination occurs faster than that of low excitation intensity,27,34 this was, however, not so significant in this work. After excitation at 1.5 μJ per pulse, the decayed holes at 10 μs were 97.9% and 93.1% (Table S1, ESI†) in pristine and co-doped hematite, respectively. The values were slightly lower following low excitation intensity at 0.5 μJ per pulse, 92.8% and 92.6% for pristine and co-doped hematite, while still no more than 10% percent left, demonstrating that rapid electron–hole recombination is the key factor for the reported low efficiency of hematite photoanodes.
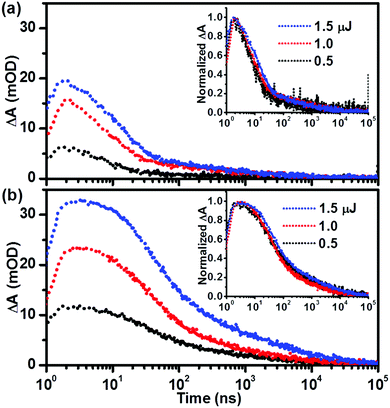 | ||
| Fig. 4 Transient absorption kinetic decays of (a) Fe2O3 and (b) Fe2O3–SnTi probed at 575 nm, as a function of excitation intensity (per pulse, 355 nm, 1 kHz); the inset shows normalized decays. | ||
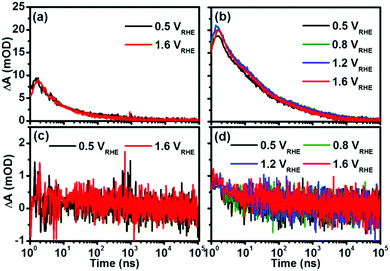
The applied bias is an important factor to enhance the photoactivity of hematite; we have probed the transient kinetics of pristine and co-doped hematite as a function of applied bias at 575 and 750 nm, respectively. As illustrated in Fig. 5, the transient kinetics displayed little difference under varied applied biases for both pristine and co-doped hematite, though their corresponding photocurrents were increased with increasing applied bias (Fig. S5, ESI†). This is different from the results reported by Durrant's group, which demonstrated that with increased bias, the transient kinetics around these two wavelengths were changing differently27,29 and the density of long-lived holes around 750 nm increased, thus corresponding to the enhanced photocurrent. One of the reasons for this difference is the different time windows that are being focused on, as it has been reported by the same group that the effect of applied bias on the ultrafast (fs–ns) spectra was not so obvious in the spectra on the time scale of μs–s.32 Another possible reason we do not observe the difference as a function of applied bias is the limited sensitivity of our measurements.
Scheme 1 illustrates the main points of our present transient absorption spectroscopy study. In pristine hematite, photogenerated electrons and holes recombine rapidly, thus inducing low efficiency for water oxidation. Sn doping is theoretically efficient in adjusting the band gap.39 We propose that Sn doping enhances the photocurrent by obvious band bending, thus will retard the recombination of photogenerated electrons and holes, which is confirmed by its time evolution spectra and kinetic decays in Fig. 2b and 3. Ti doping also contributes to the band bending (retarded electron–hole recombination in Fig. 3), while the band bending is not as distinguished as Sn doping; the main origin for its improved photocurrent is the increased density of photogenerated charge carriers (Fig. 2c and the inset of Fig. 3). Although it is believed that large numbers of separated charge carriers will recombine rapidly, it is predicted that Ti incorporation is beneficial for the separation and subsequent transportation of photogenerated charge carriers,40,41 thus improving the photoactivity. Co-doping hematite with Sn and Ti combines both advantages, with a high charge carrier density and retarded electron–hole recombination, thus further improving the water oxidation photocurrent.
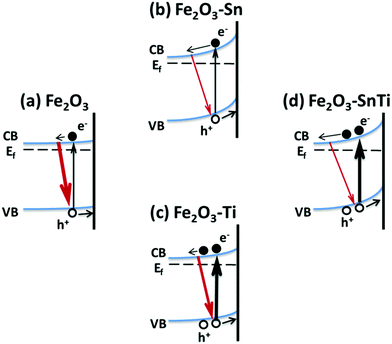 | ||
| Scheme 1 Schematic illustration of Sn and/or Ti doping affected photogenerated charge carrier dynamics in the hematite photoanode. | ||
Conclusions
The dynamics of photogenerated holes in pristine and Sn and/or Ti doped hematite were investigated and compared by transient absorption spectroscopy on the ns–μs time scale, providing insights into the different charge carrier dynamics in pristine and Sn and/or Ti doped hematite. Although both dopants enhanced the photocurrent for water oxidation at the similar level, the mechanism of the enhancement is different. Sn doping resulted in retardation of the electron–hole recombination, whereas Ti mainly increased the density of photogenerated holes. In addition, co-doping combined the advantages of both elements to further improve the photoactivity for water oxidation. Besides the above mentioned contents, the exploration of other dopant promoted effects on the charge carrier dynamics, such as charge transfer, will be inevitably helpful in further improving the photoactivity. This work also demonstrated that rapid electron–hole recombination was the main obstacle for low photoefficiency, and a systematic understanding of the charge carrier dynamics in photoelectrodes would guide the rational design of materials with high photoactivity for solar energy conversion.Conflicts of interest
There are no conflicts to declare.Acknowledgements
This work was part of the program “CO2-neutral fuels” (project 13-CO26) of the Foundation for Fundamental Research on Matter (FOM), which was financially supported by the Netherlands Organization for Scientific Research (NWO). Additional support comes from the NWO Graduate Program “Solar Fuels Catalysis”.References
- A. Fujishima and K. Honda, Nature, 1972, 238, 37–38 CrossRef CAS PubMed.
- M. T. Mayer, Y. Lin, G. Yuan and D. Wang, Acc. Chem. Res., 2013, 46, 1558–1566 CrossRef CAS PubMed.
- C. Ding, J. Shi, Z. Wang and C. Li, ACS Catal., 2017, 7, 675–688 CrossRef CAS.
- G. Carraro, C. Maccato, A. Gasparotto, T. Montini, S. Turner, O. I. Lebedev, V. Gombac, G. Adami, G. V. Tendeloo, D. Barreca and P. Fornasiero, Adv. Funct. Mater., 2014, 24, 372–378 CrossRef CAS.
- G. Carraro, D. Barreca, D. Bekermann, T. Montini, A. Gasparotto, V. Gombac, C. Maccato and P. Fornasiero, J. Nanosci. Nanotechnol., 2013, 13, 4962–4968 CrossRef CAS PubMed.
- A. B. Murphy, P. R. F. Barnes, L. K. Randeniya, I. C. Plumb, I. E. Grey, M. D. Horne and J. A. Glasscock, Int. J. Hydrogen Energy, 2006, 31, 1999–2017 CrossRef CAS.
- O. Khaselev and J. A. Turner, Science, 1998, 280, 425–427 CrossRef CAS PubMed.
- G. Wang, Y. Ling, D. A. Wheeler, K. E. N. George, K. Horsley, C. Heske, J. Z. Zhang and Y. Li, Nano Lett., 2011, 11, 3503–3509 CrossRef CAS PubMed.
- S. Shen, C. X. Kronawitter, D. A. Wheeler, P. Guo, S. A. Lindley, J. Jiang, J. Z. Zhang, L. Guo and S. S. Mao, J. Mater. Chem. A, 2013, 1, 14498–14506 CAS.
- M. E. A. Warwick, D. Barreca, E. Bontempi, G. Carraro, A. Gasparotto, C. Maccato, K. Kaunisto, T.-P. Ruoko, H. Lemmetyinen, C. Sada, Y. Gönüllü and S. Mathur, Phys. Chem. Chem. Phys., 2015, 17, 12899–12907 RSC.
- R. Franking, L. Li, M. A. Lukowski, F. Meng, Y. Tan, R. J. Hamers and S. Jin, Energy Environ. Sci., 2013, 6, 500–512 CAS.
- O. Zandi, B. M. Klahr and T. W. Hamann, Energy Environ. Sci., 2013, 6, 634–642 CAS.
- A. Kay, I. Cesar and M. Grätzel, J. Am. Chem. Soc., 2006, 128, 15714–15721 CrossRef CAS PubMed.
- J. Y. Kim, G. Magesh, D. H. Youn, J.-W. Jang, J. Kubota, K. Domen and J. S. Lee, Sci. Rep., 2013, 3, 2681 CrossRef PubMed.
- Y. Ling, G. Wang, D. A. Wheeler, J. Z. Zhang and Y. Li, Nano Lett., 2011, 11, 2119–2125 CrossRef CAS PubMed.
- Y. Zhang, S. Jiang, W. Song, P. Zhou, H. Ji, W. Ma, W. Hao, C. Chen and J. Zhao, Energy Environ. Sci., 2015, 8, 1231–1236 CAS.
- S. Shen, P. Guo, D. A. Wheeler, J. Jiang, S. A. Lindley, C. X. Kronawitter, J. Z. Zhang, L. Guo and S. S. Mao, Nanoscale, 2013, 5, 9867–9874 RSC.
- A. Kaouk, T.-P. Ruoko, M. Pyeon, Y. Gönüllü, K. Kaunisto, H. Lemmetyinen and S. Mathur, J. Phys. Chem. C, 2016, 120, 28345–28353 CAS.
- V. M. Aroutiounian, V. M. Arakelyan, G. E. Shahnazaryan, H. R. Hovhannisyan, H. Wang and J. A. Turner, Sol. Energy, 2007, 81, 1369–1376 CrossRef CAS.
- D. Monllor-Satoca, M. Bärtsch, C. Fàbrega, A. Genç, S. Reinhard, T. Andreu, J. Arbiol, M. Niederberger and J. R. Morante, Energy Environ. Sci., 2015, 8, 3242–3254 CAS.
- C. X. Kronawitter, I. Zegkinoglou, S.-H. Shen, P. Liao, I. S. Cho, O. Zandi, Y.-S. Liu, K. Lashgari, G. Westin, J.-H. Guo, F. J. Himpsel, E. A. Carter, X. L. Zheng, T. W. Hamann, B. E. Koel, S. S. Mao and L. Vayssieres, Energy Environ. Sci., 2014, 7, 3100–3121 CAS.
- P. Liao, M. C. Toroker and E. A. Carter, Nano Lett., 2011, 11, 1775–1781 CrossRef CAS PubMed.
- Z. Zhou, P. Huo, L. Guo and O. V. Prezhdo, J. Phys. Chem. C, 2015, 119, 26303–26310 CAS.
- D. V. Esposito, J. B. Baxter, J. John, N. S. Lewis, T. P. Moffat, T. Ogitsu, G. D. O’Neil, T. A. Pham, A. Alec Talin, J. M. Velazquez and B. C. Wood, Energy Environ. Sci., 2015, 8, 2863–2885 CAS.
- S. R. Pendlebury, M. Barroso, A. J. Cowan, K. Sivula, J. Tang, M. Grätzel, D. Klug and J. R. Durrant, Chem. Commun., 2011, 47, 716–718 RSC.
- A. J. Cowan, C. J. Barnett, S. R. Pendlebury, M. Barroso, K. Sivula, M. Grätzel, J. R. Durrant and D. R. Klug, J. Am. Chem. Soc., 2011, 133, 10134–10140 CrossRef CAS PubMed.
- S. R. Pendlebury, A. J. Cowan, M. Barroso, K. Sivula, J. Ye, M. Grätzel, D. R. Klug, J. Tang and J. R. Durrant, Energy Environ. Sci., 2012, 5, 6304–6312 CAS.
- M. Barroso, A. J. Cowan, S. R. Pendlebury, M. Grätzel, D. R. Klug and J. R. Durrant, J. Am. Chem. Soc., 2011, 133, 14868–14871 CrossRef CAS PubMed.
- M. Barroso, C. A. Mesa, S. R. Pendlebury, A. J. Cowan, T. Hisatomi, K. Sivula, M. Grätzel, D. R. Klug and J. R. Durrant, Proc. Natl. Acad. Sci. U. S. A., 2012, 109, 15640–15645 CrossRef CAS PubMed.
- M. Barroso, S. R. Pendlebury, A. J. Cowan and J. R. Durrant, Chem. Sci., 2013, 4, 2724–2734 RSC.
- F. L. Formal, S. R. Pendlebury, M. Cornuz, S. D. Tilley, M. Grätzel and J. R. Durrant, J. Am. Chem. Soc., 2014, 136, 2564–2574 CrossRef PubMed.
- S. R. Pendlebury, X. Wang, F. L. Formal, M. Cornuz, A. Kafizas, S. D. Tilley, M. Grätzel and J. R. Durrant, J. Am. Chem. Soc., 2014, 136, 9854–9857 CrossRef CAS PubMed.
- F. L. Formal, E. Pastor, S. D. Tilley, C. A. Mesa, S. R. Pendlebury, M. Grätzel and J. R. Durrant, J. Am. Chem. Soc., 2015, 137, 6629–6637 CrossRef PubMed.
- Z. Huang, Y. Lin, X. Xiang, W. Rodríguez-Cródoba, K. J. McDonald, K. S. Hagen, K.-S. Choi, B. S. Brunschwig, D. G. Musaev, C. L. Hill, D. Wang and T. Lian, Energy Environ. Sci., 2012, 5, 8923–8926 CAS.
- H. K. Mulmudi, N. Mathews, X. C. Dou, L. F. Xi, S. S. Pramana, Y. M. Lam and S. G. Mhaisalkar, Electrochem. Commun., 2011, 13, 951–954 CrossRef CAS.
- Z. Wang, G. Liu, C. Ding, Z. Chen, F. Zhang, J. Shi and C. Li, J. Phys. Chem. C, 2015, 119, 19607–19612 CAS.
- N. J. Cherepy, D. B. Liston, J. A. Lovejoy, H. Deng and J. Z. Zhang, J. Phys. Chem. B, 1998, 102, 770–776 CrossRef CAS.
- K. G. U. Wijayantha, S. Saremi-Yarahmadi and L. M. Peter, Phys. Chem. Chem. Phys., 2011, 13, 5264–5270 RSC.
- X. Meng, G. Qin, W. A. Goddard, L. Song, H. Pan, X. Wen, Y. Qin and L. Zuo, J. Phys. Chem. C, 2013, 117, 3779–3784 CAS.
- M. N. Huda, A. Walsh, Y. Yan, S.-H. Wei and M. M. Al-Jassim, J. Appl. Phys., 2010, 107, 123712 CrossRef.
- M. Zhang, W. Luo, Z. Li, T. Yu and Z. Zou, Appl. Phys. Lett., 2010, 97, 042105 CrossRef.
Footnote |
| † Electronic supplementary information (ESI) available: Experimental details, Fig. S1–S5 and Table S1. See DOI: 10.1039/c8cp00981c |
| This journal is © the Owner Societies 2018 |


