 Open Access Article
Creative Commons Attribution 3.0 Unported Licence
Spin–orbit effects in optical spectra of gold–silver trimers†
A.
Shayeghi
 *ab,
L. F.
Pašteka
 cde,
D. A.
Götz
b,
P.
Schwerdtfeger
cd and
R.
Schäfer
b
aVienna Center for Quantum Science and Technology, Faculty of Physics, University of Vienna, Boltzmanngasse 5, A-1090 Vienna, Austria
bEduard-Zintl-Institut, Technische Universität Darmstadt, Alarich-Weiss-Straße 8, 64287 Darmstadt, Germany. E-mail: armin.shayeghi@univie.ac.at
cCentre for Theoretical Chemistry and Physics, The New Zealand Institute for Advanced Study, Massey University Auckland, Private Bag 102904, 0632 Auckland, New Zealand
dCentre for Advanced Study at the Norwegian Academy of Science and Letters, Drammensveien 78, NO-0271 Oslo, Norway
eDepartment of Physical and Theoretical Chemistry, Faculty of Natural Sciences, Comenius University, Mlynská dolina, 84104 Bratislava, Slovakia
First published on 7th March 2018
Abstract
Cationic gold–silver trimers are ideal model systems for the evaluation of relativistic electronic structure theories. The closed-shell triangles allow one to test density functional and wavefunction-based methods in their prediction of optical properties, as dependent on composition and symmetry. Here we present the gas-phase optical spectra of AgNAu3−N+ (N = 0–3) clusters recorded by longitudinal photodissociation spectroscopy in the photon energy range 1.9–4.4 eV. The experimental data are compared to excited electronic state calculations in the framework of all-electron range-separated time-dependent density functional and equation-of-motion coupled cluster theory using two-component as well as the spin-free scalar relativistic theories. In particular, it is shown that for mixed trimers scalar-relativistic corrections are insufficient and a two-component approach becomes obligatory for a correct description of optical response properties including both spin–orbit coupling and charge-transfer effects.
1 Introduction
Trimers are at the very edge between isolated atoms and metallic nanoclusters. Their investigation is an important step towards a deeper understanding of nanoscale effects. A comprehensive study of molecular systems at this scale enables a deep insight into fundamental concepts as small clusters are excellent model systems for benchmarking the performance of quantum theoretical approaches for both ground and excited state properties, while the applicability of diatomic data for this purpose has been questioned.1Triatomic gold and silver clusters have gained great attention over the last 30 years. Early multi-reference singles and doubles configuration interaction (MR-CISD) calculations have identified isoscale triangles (C2v) as ground state structures for Ag3 and Au3.2 This has been supported by coupled cluster calculations including perturbative triples (CCSD(T))3–5 and density functional theory (DFT), where the deviation from D3h symmetry has been attributed to the first-order Jahn–Teller distortion.6 The C2v symmetry is confirmed for Ag3, but not for Au3 where the Jahn–Teller effect is quenched by spin–orbit (SO) coupling.7,8 The anions Ag3− and Au3− have been examined by photoelectron spectroscopy (PES).9,10 Both species are found to adopt D∞h symmetry, and a detailed analysis of the photoelectron spectrum of Au3− has recently been presented.11 In contrast, the cations are not subject to Jahn–Teller distortions due to their closed-shell configurations. Their D3h symmetry is confirmed by several theoretical studies and one experimental study.3–5,12
The optical spectra of neutral Ag3 and Au3 have been reported for the gas-phase,13,14 as well as in noble gas matrices.15–18 The absorption spectrum of Ag3+ has been measured in argon,19 and is in good agreement with scalar-relativistic equation-of-motion coupled cluster calculations (EOM-CCSD).20 Although the influence of 4d electrons on the optical response is generally assumed to be less important, their inclusion seems to be crucial for a quantitative description of the spectrum.20,21 The situation is, however, more complicated for gold, as the separation between the 5d and 6s levels is reduced by about 2 eV due to scalar relativistic (SR) effects,22 leading to richly structured electronic spectra at low transition energies.17,23 Further, SO effects in the 5d shell reduce this gap even more and complicate the electronic structure of the gold species,24 making interpretations and predictions a delicate task.
Little is known about mixed Ag–Au species. Laser-induced fluorescence spectroscopy experiments on the smallest system, the AgAu dimer, have revealed a significant ionic contribution to the electronic ground state25 due to the relativistically increased electronegativity of Au.26 The AgAu dimer was also the subject of a study on SO effects.27 Anionic trimers have been studied by PES, where gold is found to carry most of the negative charge and prefers terminal positions in the clusters.28 Cationic trimers have been investigated by ion mobility measurements,12 in good agreement with theoretical predictions where the influence of charge-transfer effects on structural properties has been discussed.29 More recently, the vibrational spectra of argon tagged mixed trimers from far-infrared multi-photon dissociation (FIR-MPD) spectroscopy revealed that the small cations show increasing argon bond energies with increasing amount of gold owing to SR effects.30
In this article we present for the first time measurements of optical photodissociation spectra of AgNAu3−N+ (N = 0–3) clusters in the photon energy range ħω = 1.9–4.4 eV. We support our experiments with optical response calculations employing time-dependent DFT (TDDFT) with and without long-range corrections (LC) introduced by range-separated exchange–correlation (xc) functionals, as well as the wavefunction based EOM-CCSD method. We show that all methods perform particularly well for the pure Ag3+ and Au3+ clusters, whereas the mixed systems Ag2Au+ and AgAu2+ are not satisfactorily described by a spin-free (SF) one-component (1c) theory. Here, we had to apply a variety of two-component (2c) approaches from TDDFT to Fock-space coupled cluster (FS-CCSD)31 theory to account for important SO effects in order to contribute to a better understanding of the opto-electronic behavior of such small but challenging nano-clusters.
2 Experimental and computational details
The experimental setup is described in detail elsewhere,32,33 and only a brief overview is given here. Pure and mixed gold–silver cluster cations are generated by ns-pulsed laser vaporization (using He as buffer gas) of an Au–Ag alloy target and separated by time-of-flight mass spectrometry. The optical spectra are measured by longitudinal photodissociation spectroscopy using an optic parametric oscillator. Photodissociation cross sections are calculated using the Lambert–Beer law assuming a perfect spatiotemporal overlap between the molecular beam and the dissociation laser. Therefore, the cross sections presented can be considered as a lower limit to absolute absorption cross sections. It should be noted that the spectral range 3.0–3.5 eV in the experimental data shows a larger scattering due to low photon fluence near the optical parametric oscillator degeneracy.All calculations have been performed with all-electron methods using the DIRAC1634 and Gaussian0935 program packages. For the 2c calculations, we used the exact two-component (X2C) Hamiltonian.36 In order to evaluate the magnitude of SO effects we used the SR limit (1c) of the X2C Hamiltonian. The geometries were optimized within 2c-CCSD(T). Here, both the valence (ns and (n − 1)d) and semi-core orbitals ((n − 1)p and 4f in Au) were correlated with the virtual orbital energy cutoff set to 10 a.u. Dyall's cv2z basis sets were used.37,38 The resulting geometries were used in all subsequent calculations.
In the TDDFT calculations we employed the PBE0 and the LC-ωPBEh functionals,39 as well as the HSE06 functional which includes a fraction of exact Hartree–Fock (HF) exchange at short-range.40,41 The LC-ωPBEh functional has already been proven to perform well for optical response calculations of small gold–silver clusters.32,33,42,43 HSE06, on the other hand, has been shown to perform particularly well for pure silver clusters.44 The introduction of range-separation in all functionals is based on partitioning the Coulomb operator into short-range and long-range components through the Ewald decomposition.39–42 Several basis sets (Dyall's v2z, v3z, v4z)37,38 were used, showing that the results are practically insensitive to the basis set size for all functionals applied. The results reported here are obtained with the v2z basis set, which has also been used in all CC calculations, as these were quite computer time consuming.
FS-CCSD is the most rigorous of all methods employed in the present work. To define the multi-reference (MR) in the intermediate Hamiltonian scheme,45 three orbitals belonging to the valence s shell (one occupied, two virtual) are included in the primary space and the occupied d shell and unoccupied p shells in the auxiliary space. The dynamic electron correlation spanned the active space which comprised ns, (n − 1)d shells and all virtuals up to a cutoff of 10 a.u. Approximate oscillator strengths for FS-CCSD were obtained via CI-like expressions using solutions for the right-hand vectors only.
We have additionally employed 1c- and 2c-MR-CISD methods. However, in the current implementation the use of large enough active spaces required to accurately describe the Ag/Au trimer cations was computationally prohibitive. Excluding any of the d-shell orbitals or reducing the virtual space led to an incorrect description of the electronic excitations.
A detailed analysis of the excitations based on population analyses using Knizia's intrinsic atomic orbitals (IAO)46 as implemented in DIRAC16 is provided. In this analysis, we chose only excitations corresponding to visible peaks in the spectra (i.e. with oscillator strengths >0.002 a.u.) based on our results obtained with the PBE0 functional. For each system, 18 molecular orbitals (MO) were analyzed, containing the atomic d and s shells with 15 and 3 atomic orbitals (AOs), respectively. 16 of these MOs are occupied (ideally, 15 with d-character and 1 with s-character), and the remaining 2 s AO combinations are unoccupied (virtual). All observed excitations are contained in this s–d set. The common point-group between all (pure and mixed) trimers is C2v (x-axis is chosen perpendicular to the molecular plane), and we use the axis labelling accordingly for all trimers. We note that in the 2c regime, the symmetry of the MOs is reduced to double-group representations with mixed symmetry composition with respect to the 1c approach.
3 Results and discussion
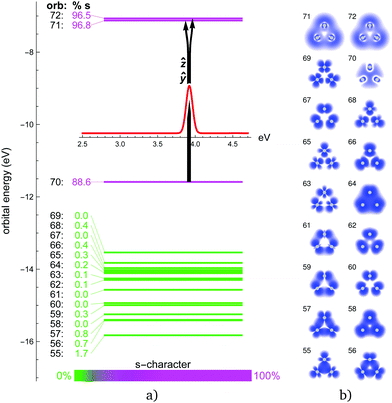
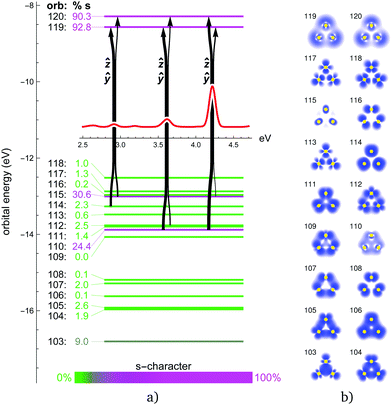
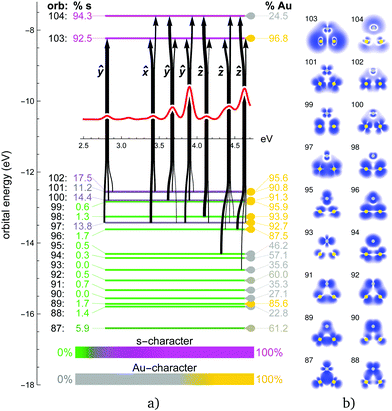
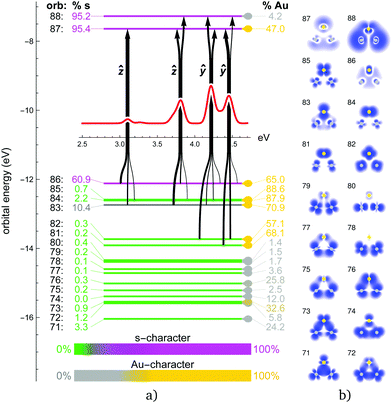
We compare our experimental and calculated optical spectra in Fig. 1–8. The results of the IAO analyses are depicted in the figures following immediately the experimental and theoretical optical spectra. Partial charges on the Ag/Au centers and an analysis of the orbitals participating in excitations, their symmetry and their s/d-character and Ag/Au composition are discussed further below.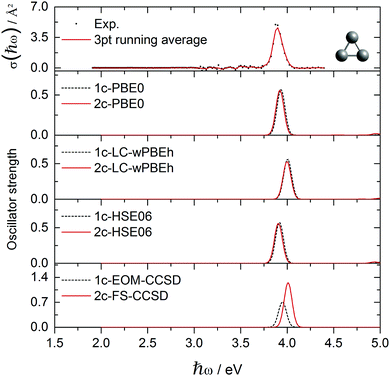 | ||
| Fig. 1 Experimental Ag3+ absorption cross section data points σ(ħω) compared to various optical response calculations including spin-free and two-component theories. | ||
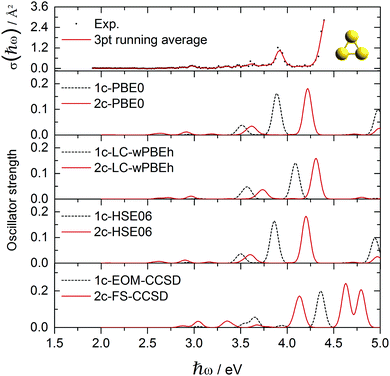 | ||
| Fig. 3 Experimental Au3+ absorption cross section data points σ(ħω) compared to various optical response calculations including spin-free and two-component theories. | ||
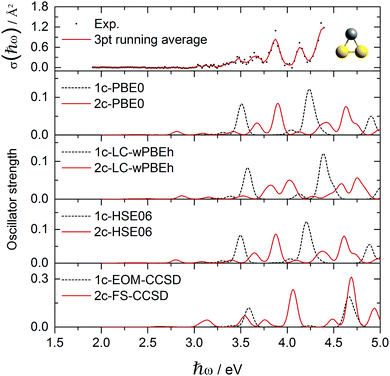 | ||
| Fig. 5 Experimental AgAu2+ absorption cross section data points σ(ħω) compared to various optical response calculations including spin-free and two-component theories. | ||
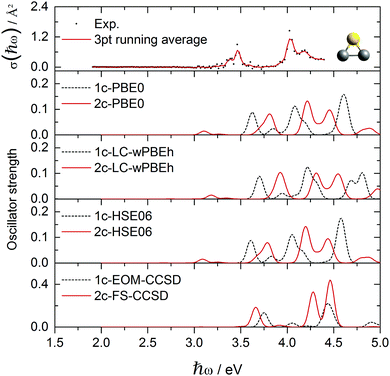 | ||
| Fig. 7 Experimental Ag2Au+ absorption cross section data points σ(ħω) compared to various optical response calculations including spin-free and two-component theories. | ||
In the pure trimers with perfect D3h symmetry, all in-plane excitations come in degenerate pairs (ẑ and ŷ), thus reducing the number of peaks in the spectra. In the mixed trimers, this degeneracy is lifted. The out-of-plane ![[x with combining circumflex]](https://www.rsc.org/images/entities/i_char_0078_0302.gif) excitations are mostly very weak, only a few are visible.
excitations are mostly very weak, only a few are visible.
The obtained energy gaps (see Fig. 2, 4, 6 and 8) separate the upper 3N + 1 occupied MOs from the rest of the orbitals, where N coincides with the stoichiometry of Ag3−NAuN+ (N = 0–3), i.e. each Au atom contributes three 5d5/2 orbitals to the upper occupied part of the MO diagram, plus one coming from the s-level. This is due to the strong SO splitting of the Au 5d-shell making the 5d3/2 more core-like. The three SO destabilized 5d5/2 AOs of gold are high enough in energy that they mix substantially with the s-shell in all trimers. Due to this mixing, the single-particle picture completely breaks down, i.e., all excitations can only be described as multi-reference in nature with combinations of initial and final orbitals. As a consequence, the spectra for the trimers containing gold (N > 0) become significantly more complex compared to the Ag3+ cluster, as discussed in more detail in the following subsections.
3.1 Ag3+ and Au3+
The absorption spectrum of the Ag3+ cluster is presented in Fig. 1. A single intensive absorption at 3.9 eV appears in the experiment which is generally well reproduced by all methods employed. Only LC-ωPBEh and 2c-FS-CCSD give a slight blue-shift of ∼0.1 eV compared to experiment. HSE06 and PBE0 clearly give the best agreement, which, compared to previous studies on Ag6+ and Ag8+ clusters,44 is perhaps not surprising. It is interesting that in contrast to Au3+, where SO effects shift the spectra correctly towards the experimental values, SO effects are almost negligible in the case of Ag3+ with the 1c and 2c results being in very good agreement (ESI†). For example in Ag3+, orbital 70 (HOMO) is of almost pure 4s character, and the two degenerate ẑ and ŷ excitations aim into the two virtual 4s-shell MOs (Fig. 2). The large s–d energy separation fully prohibits the d-shell from participating in the excitations in this energy range. This picture is unaffected by SO effects aside from the symmetry mixing between the virtual orbitals 71 and 72. This is in stark contrast to the mixed clusters, where SO effects lead to a rather large change in the optical signatures as we shall see.The experimental absorption spectrum of the Au3+ cluster compared to optical response calculations is presented in Fig. 3. The remarkable optical transition at 3.9 eV and a more intensive feature above 4.4 eV dominate the experimental spectrum while a smaller feature and a small broad structure appear around 3.0 eV and 3.6 eV, respectively. Almost all presented computational methods show a good qualitative agreement in terms of the optical signature, although the main features are red-shifted by 0.3–0.4 eV compared to the experimental data. By error compensation, the 1c-EOM-CCSD calculations reproduce the spectral signature and show the smallest (0.3 eV) red-shift for the most intense transition at around 3.9 eV. This points towards the fact that CCSD(T) is not sufficient. However, for all DFT functionals, the inclusion of SO effects apparently shifts the peaks towards the experimental values. LC-ωPBEh shows the best performance here but still showing a red-shift of 0.15 eV. The FS-CCSD calculations give a slightly different signature. The peak around 3.9 eV found in experiment is blue-shifted by about 0.3 eV while the transition above 4 eV splits into two blue-shifted transitions compared to all other calculations which, however, cannot be verified by the experiment.
In Au3+, the 6s–5d energy separation disappears, s and d shells mix and the s character is distributed among several MOs (Fig. 4). MOs with significant s content (112, 114, and especially 110 and 115) participate in the dominant excitations contributing to all three distinct features at around 2.9, 3.6 and 3.9 eV. Apart from the degenerate in-plane ẑ and ŷ excitations for each peak, there is also an out-of-plane ![[x with combining circumflex]](https://www.rsc.org/images/entities/i_char_0078_0302.gif) excitation contributing to the smaller 3.6 eV peak. Qualitatively, the same description of MOs and excitation holds for the 1c picture (ESI†). There is a clear correspondence between the 1c and 2c spectra of Au3+. SO effects only change the orbital energies and the s character of the participating MOs, and thus blue-shift the peak positions closer to experimental values. Interestingly, the higher the s character in the participating MOs, the stronger is the SO blue-shift in the 3 dominant peaks.
excitation contributing to the smaller 3.6 eV peak. Qualitatively, the same description of MOs and excitation holds for the 1c picture (ESI†). There is a clear correspondence between the 1c and 2c spectra of Au3+. SO effects only change the orbital energies and the s character of the participating MOs, and thus blue-shift the peak positions closer to experimental values. Interestingly, the higher the s character in the participating MOs, the stronger is the SO blue-shift in the 3 dominant peaks.
3.2 AgAu2+ and Ag2Au+
Fig. 5 shows the experimental photodissociation spectrum of AgAu2+. In the range 3.0–3.5 eV, a broad structure of not well separated peaks appears, followed by broad transitions at 3.65 and 3.85 eV, respectively. A less intense transition at 4.15 eV precedes the most intense transition at about 4.4 eV. Here, in contrast to the pure Au3+ and Ag3+ clusters, all 1c methods show poor agreement with respect to the spectral signature. Only the inclusion of SO effects successfully produces agreement, although deviations from some of the experimental transitions remain. Experimental features at 3.65 and 3.85 eV are well reproduced. However, the peaks at 4.15 and 4.4 eV are blue-shifted in the calculations by about 0.2–0.3 eV. Here, the 2c-PBE0 and 2c-HSE06 calculations clearly outperform all other methods, even the 2c-FS-CCSD calculations, which only qualitatively describe the experimental observations. In mixed trimers, the in-plane ẑ and ŷ excitations are no longer degenerate, due to the lower symmetry. The most intense ŷ/ẑ pair of excitations is split by 0.7 eV and forms the two major peaks in the 1c spectrum at 3.5 eV and 4.2 eV, respectively. Both are predominantly originating in the HOMO orbital, 102, which has strong s character (ESI†). SO effects spread the s-character across several occupied MOs, mostly 97, 100, 101, and 102 (Fig. 6). This also splits the ŷ-transition peak (1c: 3.5 eV) into three peaks at 2.8 eV, 3.7 eV and 3.9 eV in the 2c spectrum. The ẑ peak (1c: 4.2 eV) splits after the inclusion of SO effects into 4.1, 4.4 and 4.6 eV peaks. The small out-of-plane![[x with combining circumflex]](https://www.rsc.org/images/entities/i_char_0078_0302.gif) -transition peak (1c: 3.3 eV) simply shifts to 3.4 eV in the 2c spectrum. While the ŷ and
-transition peak (1c: 3.3 eV) simply shifts to 3.4 eV in the 2c spectrum. While the ŷ and ![[x with combining circumflex]](https://www.rsc.org/images/entities/i_char_0078_0302.gif) -transition peaks (2.8–3.9 eV) almost exclusively originate in the orbitals with increased s character, several d-type MOs contribute to the higher-energy ẑ-transition peaks (4.1–4.6 eV).
-transition peaks (2.8–3.9 eV) almost exclusively originate in the orbitals with increased s character, several d-type MOs contribute to the higher-energy ẑ-transition peaks (4.1–4.6 eV).
The experimental photodissociation spectrum of Ag2Au+ is shown in Fig. 7. It shows a broad transition at 3.45 eV with a shoulder towards lower transition energies. The main transition at 4.05 eV shows a tailing towards higher photon energies due to a less intense transition at 4.2 eV. Similar to AgAu2+, only the inclusion of SO effects successfully reproduces agreement in terms of the optical signature. Although the agreement regarding shifts is even less good for Ag2Au+ than for AgAu2+, it remains clear that the 2c approaches are needed to explain the experimental observations. Although blue-shifted by about 0.3 eV, again 2c-PBE0 and 2c-HSE06 calculations outperform all other methods including 2c-FS-CCSD, which is the only method that does not predict the low intensity transition at about 3.1 eV shown by 2c-TDDFT but not resolved in the experiment. Qualitatively, the inclusion of SO effects appears to be slightly less important in Ag2Au+ when compared to AgAu2+.
In the 1c picture of Ag2Au+ (ESI†), orbital 86 (HOMO) has a strong s character and contributes to the dominant 3.6 eV and 4.1 eV peaks, forming the in-plane ŷ/ẑ-transition pair similar to the ones in pure trimers, but in this case split by 0.5 eV. SO effects transfer part of the s character from orbital 86 to other MOs, mostly 83 and 84 (Fig. 8). This increases the intensities of multitudes of transitions from these orbitals and produces a more complicated spectrum. The ẑ-transition peak (1c: 3.6 eV) shifts and splits into the 3.8 eV and 4.2 eV peaks observed in the 2c spectrum. The ŷ-transition peak (1c: 4.1 eV) shifts and splits into 3 overlapping peaks in the range 4.2–4.4 eV. The strongest peak in the 2c spectrum at 4.2 eV combines contributions from both ŷ and ẑ excitations. Similar to the previous case of AgAu2+, MOs with significant s character contribute to all excitations. For higher-energy peaks (4.2–4.4 eV), however, d-type orbitals 81 and 82 add significant contributions.
Based on the IAO projection analysis we can also evaluate the density content of each MO coming from gold and silver atoms in the mixed trimers as well as the partial charges on these atoms. As expected, gold due to its relativistically increased electronegativity bears negative partial charge in both AgAu2+ and Ag2Au+ (−0.133e and −0.169e, respectively). This correlates with the corresponding calculated dipole moment values with respect to the geometrical center, 1.67 D and −2.01 D, respectively (the positive vector points upwards in the cluster orientation depicted in Fig. 6 and 8). Regarding the Ag/Au composition of the MOs in these systems, we observe clear separation with increasing Au and Ag character (as compared to the equally split density across all three atoms) in both the occupied and the virtual space. Au-dominant orbitals are generally the ones closer to the Fermi level, i.e. the upper occupied MOs and the LUMO (orbitals 96–103 in AgAu2+ and 81–87 in Ag2Au+). While both virtuals participate in the excitations equally, participating occupied MOs are almost exclusively Au-dominant in both systems. The resulting excitations thus mediate a charge transfer from Au to Ag atoms, counteracting the partial charge distribution of the ground state. This adds to the complexity of the mixed trimer spectra as compared to their pure counterparts.
4 Conclusions
As we have shown in the case of pure Ag3+ and Au3+ with D3h symmetry, all employed methods agree well with the experimental spectra in terms of the signatures. The optical spectra of mixed Ag2Au+ and AgAu2+ with C2v symmetry, however, are more complex and only when SO effects are taken into account we can adequately describe the optical response. Interestingly, SO effects do not seem to significantly influence the geometries of the trimer cations. Further, we see the general trend that HSE06 performs well for silver-rich clusters, supporting previous observations.Due to the higher symmetry of the pure trimers, there is degeneracy between the in-plane ẑ and ŷ-transitions producing simpler spectra with SO effects, but blue-shifting the peaks of Au3+. In mixed trimers, these excitation pairs are first split by symmetry lowering to C2v, and each peak is further split by the inclusion of the SO effects into multiple peaks. The mixed trimers exhibit partial charges; the charge separation is stronger in Ag2Au+ than in AgAu2+. There is a clear distinction between the Ag and Au-dominant orbitals in both systems. The LUMO is Au-dominant, and the LUMO+1 is Ag dominant. Occupied orbitals are separated into a lower-energy Ag-dominant part and a higher-energy Au-dominant part. Only the latter contributes to the excitations. Since all initial orbitals in the mixed trimer excitations are Au-dominant and roughly half of the transitions aim at Ag-dominant LUMO+1, there is a significant charge transfer Au → Ag compensating the ground state charge separation, increasing the complexity of the spectra.
Conflicts of interest
There are no conflicts to declare.Acknowledgements
We acknowledge financial support by the DFG (SCHA 885/10-2). The calculations reported here were performed on Simurg, the High-Performance Supercomputer of Massey University, and NeSI high-performance computing facilities (NZ eScience Infrastructure) within the project NESI00285 funded jointly by NeSI's collaborator institutions and the Ministry of Business, Innovation & Employment's Research Infrastructure programme (http://www.nesi.org.nz). PS is indebted to the Royal Society of New Zealand for financial support in terms of a Marsden Fund (MAU1409). AS is thankful to Leonid Skripnikov for useful discussions.References
- A. A. Rusakov, E. Rykova, G. E. Scuseria and A. Zaitsevskii, J. Chem. Phys., 2007, 127, 164322 CrossRef PubMed.
- K. Balasubramanian and M. Liao, Chem. Phys., 1988, 27, 313–324 CrossRef.
- J. Yoon, K. Kim and K. Baeck, J. Chem. Phys., 2000, 112, 9335–9342 CrossRef CAS.
- R. Wesendrup, T. Hunt and P. Schwerdtfeger, J. Chem. Phys., 2000, 112, 9356–9362 CrossRef CAS.
- M.-J. Huang and J. D. Watts, Phys. Chem. Chem. Phys., 2012, 14, 6849–6855 RSC.
- Y. Shen and J. BelBruno, J. Chem. Phys., 2003, 118, 9241–9246 CrossRef CAS.
- R. Guo, K. Balasubramanian, X. Wang and L. Andrews, J. Chem. Phys., 2002, 117, 1614–1620 CrossRef CAS.
- Y. Shen and J. BelBruno, J. Phys. Chem. A, 2005, 109, 512–519 CrossRef CAS PubMed.
- G. Gantefor, D. Cox and A. Kaldor, J. Chem. Phys., 1990, 93, 8395–8396 CrossRef CAS.
- H. Handschuh, G. Ganteför, P. Bechthold and W. Eberhardt, J. Chem. Phys., 1994, 100, 7093–7100 CrossRef CAS.
- N. P. Bauman, J. A. Hansen, M. Ehara and P. Piecuch, J. Chem. Phys., 2014, 141, 101102 CrossRef PubMed.
- P. Weis, O. Welz, E. Vollmer and M. M. Kappes, J. Chem. Phys., 2004, 120, 677 CrossRef CAS PubMed.
- P. Y. Cheng and M. A. Duncan, Chem. Phys. Lett., 1988, 152, 341–346 CrossRef CAS.
- G. Bishea and M. Morse, J. Chem. Phys., 1991, 95, 8779–8792 CrossRef CAS.
- S. Fedrigo, W. Harbich and J. Buttet, J. Chem. Phys., 1993, 99, 5712 CrossRef CAS.
- I. Rabin, W. Schulze, G. Ertl, C. Felix, C. Sieber, W. Harbich and J. Buttet, Chem. Phys. Lett., 2000, 320, 59–64 CrossRef CAS.
- S. Lecoultre, A. Rydlo, C. Félix, J. Buttet, S. Gilb and W. Harbich, J. Chem. Phys., 2011, 134, 074302 CrossRef CAS PubMed.
- S. Lecoultre, A. Rydlo, J. Buttet, C. Félix, S. Gilb and W. Harbich, J. Chem. Phys., 2011, 134, 184504 CrossRef CAS PubMed.
- S. Lecoultre, A. Rydlo and C. Félix, J. Chem. Phys., 2007, 126, 204507 CrossRef PubMed.
- V. Bonačić-Koutecký, J. Pittner, M. Boiron and P. Fantucci, J. Chem. Phys., 1999, 110, 3876–3886 CrossRef.
- J. C. Idrobo, S. Öǧüt and J. Jellinek, Phys. Rev. B: Condens. Matter Mater. Phys., 2005, 72, 085445 CrossRef.
- P. Pyykkö, Chem. Soc. Rev., 2008, 37, 1967–1997 RSC.
- J. C. Idrobo, W. Walkosz, S. F. Yip, S. Öǧüt, J. Wang and J. Jellinek, Phys. Rev. B: Condens. Matter Mater. Phys., 2007, 76, 205422 CrossRef.
- K. R. Geethalakshmi, F. Ruiperez, S. Knecht, J. M. Ugalde, M. D. Morse and I. Infante, Phys. Chem. Chem. Phys., 2012, 4, 8732–8741 RSC.
- J. Fabbi, J. Langenberg, Q. Costello, M. Morse and L. Karlsson, J. Chem. Phys., 2001, 115, 7543 CrossRef CAS.
- P. Schwerdtfeger, Chem. Phys. Lett., 1991, 183, 457–463 CrossRef CAS.
- D. Alizadeh, Z. Jamshidi and A. Shayesteh, Phys. Chem. Chem. Phys., 2013, 15, 18678 RSC.
- Y. Negishi, Y. Nakamura, A. Nakajima and K. Kaya, J. Chem. Phys., 2001, 115, 3657 CrossRef CAS.
- V. Bonačić-Koutecký, J. Burda, R. Mitrić, M. Ge, G. Zampella and P. Fantucci, J. Chem. Phys., 2002, 117, 3120–3131 CrossRef.
- A. Shayeghi, R. L. Johnston, D. M. Rayner, R. Schäfer and A. Fielicke, Angew. Chem., Int. Ed., 2015, 54, 10675–10680 CrossRef CAS PubMed.
- L. Visscher, E. Eliav and U. Kaldor, J. Chem. Phys., 2001, 115, 9720–9726 CrossRef CAS.
- A. Shayeghi, C. J. Heard, R. L. Johnston and R. Schäfer, J. Chem. Phys., 2014, 140, 054312 CrossRef CAS PubMed.
- A. Shayeghi, R. L. Johnston and R. Schäfer, Phys. Chem. Chem. Phys., 2013, 15, 19715–19723 RSC.
- H. J. A. Jensen, R. Bast, T. Saue and L. Visscher, with contributions from V. Bakken, K. G. Dyall, S. Dubillard, U. Ekström, E. Eliav, T. Enevoldsen, E. Faßhauer, T. Fleig, O. Fossgaard, A. S. P. Gomes, T. Helgaker, J. Henriksson, M. Iliaš, C. R. Jacob, S. Knecht, S. Komorovský, O. Kullie, J. K. Lærdahl, C. V. Larsen, Y. S. Lee, H. S. Nataraj, M. K. Nayak, P. Norman, G. Olejniczak, J. Olsen, Y. C. Park, J. K. Pedersen, M. Pernpointner, R. di Remigio, K. Ruud, P. Sałek, B. Schimmelpfennig, J. Sikkema, A. J. Thorvaldsen, J. Thyssen, J. van Stralen, S. Villaume, O. Visser, T. Winther and S. Yamamoto, DIRAC, a relativistic ab initio electronic structure program, Release DIRAC16, 2016, (see http://www.diracprogram.org).
- M. J. Frisch, G. W. Trucks, H. B. Schlegel, G. E. Scuseria, M. A. Robb, J. R. Cheeseman, G. Scalmani, V. Barone, B. Mennucci, G. A. Petersson, H. Nakatsuji, M. Caricato, X. Li, H. P. Hratchian, A. F. Izmaylov, J. Bloino, G. Zheng, J. L. Sonnenberg, M. Hada, M. Ehara, K. Toyota, R. Fukuda, J. Hasegawa, M. Ishida, T. Nakajima, Y. Honda, O. Kitao, H. Nakai, T. Vreven, J. A. Montgomery, Jr., J. E. Peralta, F. Ogliaro, M. Bearpark, J. J. Heyd, E. Brothers, K. N. Kudin, V. N. Staroverov, R. Kobayashi, J. Normand, K. Raghavachari, A. Rendell, J. C. Burant, S. S. Iyengar, J. Tomasi, M. Cossi, N. Rega, J. M. Millam, M. Klene, J. E. Knox, J. B. Cross, V. Bakken, C. Adamo, J. Jaramillo, R. Gomperts, R. E. Stratmann, O. Yazyev, A. J. Austin, R. Cammi, C. Pomelli, J. W. Ochterski, R. L. Martin, K. Morokuma, V. G. Zakrzewski, G. A. Voth, P. Salvador, J. J. Dannenberg, S. Dapprich, A. D. Daniels, Ö. Farkas, J. B. Foresman, J. V. Ortiz, J. Cioslowski and D. J. Fox, Gaussian 09 Revision A.1, Gaussian Inc., Wallingford CT, 2009 Search PubMed.
- T. Saue, ChemPhysChem, 2011, 12, 3077–3094 CrossRef CAS PubMed.
- K. G. Dyall, Theor. Chem. Acc., 2004, 112, 403–409 CrossRef CAS.
- K. G. Dyall, Theor. Chem. Acc., 2007, 117, 483–489 CrossRef CAS.
- M. A. Rohrdanz, K. M. Martins and J. M. Herbert, J. Chem. Phys., 2009, 130, 054112 CrossRef PubMed.
- J. Heyd, G. Scuseria and M. Ernzerhof, J. Chem. Phys., 2003, 118, 8207–8215 CrossRef CAS.
- J. Heyd, G. Scuseria and M. Ernzerhof, J. Chem. Phys., 2006, 124, 219906 CrossRef.
- D. W. Silverstein and L. Jensen, J. Chem. Phys., 2010, 132, 194302 CrossRef PubMed.
- F. Rabilloud, J. Phys. Chem. A, 2013, 117, 4267–4278 CrossRef CAS PubMed.
- A. Shayeghi, D. A. Götz, R. L. Johnston and R. Schäfer, Eur. Phys. J. D, 2015, 140, 054312 Search PubMed.
- A. Landau, E. Eliav, Y. Ishikawa and U. Kaldor, J. Chem. Phys., 2004, 121, 6634–6639 CrossRef CAS PubMed.
- G. Knizia, J. Chem. Theory Comput., 2013, 9, 4834–4843 CrossRef CAS PubMed.
Footnote |
| † Electronic supplementary information (ESI) available: Plots of 1-component spin-free orbital energy levels and excitations to complement Fig. 2, 4, 6 and 8. See DOI: 10.1039/c8cp00672e |
| This journal is © the Owner Societies 2018 |

