 Open Access Article
Creative Commons Attribution 3.0 Unported Licence
Thermodynamically accessible titanium clusters TiN, N = 2–32
Tomas
Lazauskas
 *a,
Alexey A.
Sokol
 a,
John
Buckeridge
 a,
C. Richard A.
Catlow
ab,
Susanne G. E. T.
Escher
 a,
Matthew R.
Farrow
a,
David
Mora-Fonz
c,
Volker W.
Blum
a,
Matthew R.
Farrow
a,
David
Mora-Fonz
c,
Volker W.
Blum
 d,
Tshegofatso M.
Phaahla
e,
Hasani R.
Chauke
e,
Phuti E.
Ngoepe
e and
Scott M.
Woodley
 *a
*a
aKathleen Lonsdale Materials Chemistry, Department of Chemistry, University College London, 20 Gordon Street, London WC1H 0AJ, UK. E-mail: t.lazauskas@ucl.ac.uk; scott.woodley@ucl.ac.uk
bSchool of Chemistry, Cardiff University, Cardiff CF10 3AT, UK
cDepartment of Physics and Astronomy, University College London, Gower Street, London WC1E 6BT, UK
dDepartment of Materials Science and Mechanical Engineering, Duke University, Durham, NC 27708, USA
eMaterials Modelling Centre, University of Limpopo, Private Bag x1106, Sovenga 0727, South Africa
First published on 30th April 2018
Abstract
We have performed a genetic algorithm search on the tight-binding interatomic potential energy surface (PES) for small TiN (N = 2–32) clusters. The low energy candidate clusters were further refined using density functional theory (DFT) calculations with the PBEsol exchange–correlation functional and evaluated with the PBEsol0 hybrid functional. The resulting clusters were analysed in terms of their structural features, growth mechanism and surface area. The results suggest a growth mechanism that is based on forming coordination centres by interpenetrating icosahedra, icositetrahedra and Frank–Kasper polyhedra. We identify centres of coordination, which act as centres of bulk nucleation in medium sized clusters and determine the morphological features of the cluster.
Transition metals exhibit rich physical and chemical properties with many applications, for example, in catalysis, microelectronics, and nanotechnology. In recent years, the structures and properties of transition metal clusters have been studied extensively,1,2 mainly due to the inherent size dependence, as cluster and bulk structures often exhibit substantially different properties.3,4
Titanium, in particular, has many uses in a wide range of fields, from medical applications, to aerospace, to catalysis. Efficient fabrication of commercially useful products is, however, hampered by the high mechanical strength of pure Ti metal, and, therefore, production routes of Ti powders are extremely important and of high interest.5–7 One of the viable processes is via chlorination of Ti slag, containing ilmenite and rutile minerals, which can be either formed by direct enrichment of Ti containing ores or present as a by-product in pigment production. This process has for example been developed by Council for Scientific and Industrial Research in South Africa (CSIR),8 which should enable novel technologies including the use of Ti powder in 3D printing of metal components for several industries.9
Studies on transition metal clusters, including Fe,10 Ni,11 Si,12,13 Al14,15 and V,16–18 have being carried out to investigate their structural evolution and electronic properties. It was found that the properties of small metal clusters may differ significantly from those of the bulk, but they can in part reproduce the behaviour either of the crystal defects or metal particle in supported crystals by Estiú.19
TiN clusters, however, have drawn less scientific attention compared to other transition metals. There are a small number of experimental studies reported on titanium clusters. Notably Sakurai et al. reported magic number TiN clusters in time-of-flight (TOF) mass spectra at N = 7, 13, 15, 19, and 25, as they observed higher TOF intensities around these sizes.20 Lian et al. studied dissociation pathways and bond energies of titanium cluster ions21 and suggested that small titanium clusters prefer icosahedral structures. Using photoelectron spectroscopy Liu et al. confirmed the findings by Lian et al. by observing abrupt photoelectron spectral narrowing for highly symmetric icosahedral structures at N = 13 and 55.22 The later study also showed that the electron affinities of the titanium clusters did not extrapolate to the bulk work function, and that the clusters may not possess the bulk packing.
Previous theoretical studies on Ti clusters mainly focused on small or selected sizes.23–35 Only one recent work by Sun et al.36 provided a systematic study of TiN, for sizes N = 2–20, with an analysis of the evolution of structural, electronic and bonding properties with cluster size. To the authors' knowledge, there has not been a systematic study of Ti clusters for larger sizes (N > 20) and there is not as yet a complete understanding of their structure and thermodynamic properties. Hence, we have performed atomistic and spin polarised electronic structure calculations on TiN nanoclusters of up to 32 atoms, and explored their electronic, geometric and bonding properties with the focus on finding new particularly stable (abundant) cluster sizes, known as magic numbers, within this range.
The rest of the paper is organised in the following manner: in Section 1 we describe our methodological approach and provide computational details; the description of the PES and spin polarized analysis are presented in Section 2; results on the structure and energetics of the clusters are presented and discussed in Section 3; and, finally, the summary is provided in Section 4.
1 Computational approach and technical details
Simulations in this work were carried out using the Knowledge-Led Master Code (KLMC) software suite37,38 and its recently improved genetic algorithm (GA) module,39 which has proved to locate efficiently local (LM) and global (GM) minima39–42 on PES. Alternative global optimisation techniques, typically based on either a GA or a Monte Carlo Basin Hopping scheme, have been applied to predicting the structure of metallic clusters or their alloys or generic atomistic energy landscapes.43–47First, the GA module was employed to perform a search on the semiclassical interatomic PES, using the GULP code48,49 for energy and force evaluations, and local geometry optimisations. Geometry optimisations were performed using the BFGS minimiser followed by the Rational Function Optimisation method to ensure that the system converges to a stable stationary point.
The use of high quality interatomic potentials (IP) to filter low energy candidates for a DFT analysis, or to compare regions of energy landscapes, is a strategy that has been exploited successfully in previous studies (e.g.ref. 38, 41, 42, 50 and 51). In this work, the PES of TiN nanoclusters is evaluated using a many-body embedded atom method (EAM), which includes a combination of a many-body attractive term, Ea, and a repulsive two-body Born–Mayer IP, Er. Parameters for the EAM IP were obtained from a mathematically equivalent parameterisation of the tight-binding potentials44,52–54 and are given in Table 1. The forms of the potentials are given by:
 | (1) |
 | (2) |
During GA simulations, the size of the cubic container, in which atoms are initially randomly placed, was adjusted to the cluster size (N), taking the values between 5 and 12 Å. Other GA parameters, such as the population size and graph radius of the geometrical prescreener (described in ref. 39) were kept fixed at 200 and 3.34 Å for all the GA simulations, respectively. To maintain diversity and ensure a healthy population, 80% of the structures obtained from the crossover operation were mutated using the same probability weights as were established in the previous work:39 0.2 – self-crossover, 0.1 – atom exchange, 0.1 – expansion, 0.1 – contraction, and 0.5 – random displacement. Moreover, as the number of degrees of freedom increased with N, a greater number of GA iterations per simulation was performed, varying from 10 to 3000.
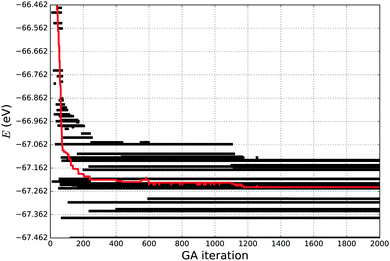
If a simulation stopped too early, the tentative GM found might in fact be a metastable LM, in which the simulation is trapped, and therefore a higher number of GA iterations would be necessary for the simulation to escape from this particular LM. In this work we have used the “evolution” of energy as the measure of simulation convergence, where we observe the twenty lowest energies, as it is shown in Fig. 1. We stop our simulations when the average energy of the 20 lowest energy structures becomes stable for about 100–200 GA iterations, giving a high confidence in having a good representative set of LMs and the desired GM.
After completing the search on the IP PES, we have selected for refinement a subset of the lowest energy LM within approximately 1.0 eV energy range above the corresponding tentative GM. Using this criterion, for example, Ti32 subset included 250 LM. The selected clusters were re-optimised at the quantum mechanical, DFT level using the all-electron, full potential electronic structure code FHI-aims.55
To reduce the computational time required for geometry relaxation (refinement), we use the PBEsol exchange–correlation functional38 without spin polarization and a multi-step optimisation procedure. The structures from the GA subsets were initially refined using the light basis sets (variationally equivalent to split valence double-zeta Gaussian plus polarisation basis sets) with “loose” convergence criteria. Then the resultant structures were further refined using the tight basis sets (equivalent to triple-zeta plus polarisation) and “tight” convergence criteria.56–58 The convergence criteria used for the light and tight basis sets are given in Table 2. The latter structures were used for a subsequent (PBEsol and tight basis set) refinement employing a spin polarized approach with different overall spin moments S: 0, 1, 2, 3 ħ. The lowest energy structures for each size were selected as the tentative GM. Finally, the tentative GM structures were evaluated using the hybrid functional PBEsol0,59,60 which includes 25% Hartree–Fock-like electron exchange, by performing single point energy calculations with the tight basis sets. If not stated otherwise, the results are given after the PBEsol tight refinement.
| Basis | Convergence criterion based on | Structure optimization (eV Å−1) | |||
|---|---|---|---|---|---|
| Charge density (electrons) | Eigenvalues (eV) | Total energy (eV) | Forces (eV Å−1) | ||
| Light | 10−2 | 10−1 | 10−2 | 10−1 | 10−2 |
| Tight | 10−4 | 10−3 | 10−5 | 10−3 | 10−3 |
To calculate binding energies (or enthalpies of formation) and provide a reference for asymptotic behaviour of structural and electronic properties of TiN clusters at the thermodynamic limit, we have evaluated bulk Ti at the same level of theory with a 20 × 20 × 20 sampling grid over the first Brillouin.
The thermodynamic stability of the lower energy clusters has been analysed with the usual procedure, including binding and first and second difference energies.61 Moreover, to help understand the structural stability of GM and lower energy metastable LM, in this study we investigate the surface area of each cluster by employing the Delaunay's triangulation (DT) method62,63 from the Python Visualisation ToolKit library in the following manner: (i) atoms of the cluster are treated as points and triangulated, (ii) triangles from the surface triangulation are extracted, (iii) the sum of the extracted triangles is defined as the surface area of the cluster – cf. some alternative approaches to the definition and the calculation of the surface area.64–67
2 Energy landscape
To understand how the chosen multi-step computational approach affects the final configurations of the clusters, we have performed energy ranking comparison between different levels of theory.2.1 Energy ranking
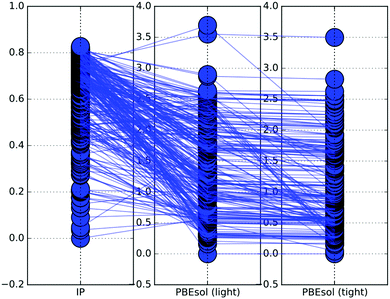
The graphical representation of how the energy ranking changes between the different levels of theory applied in this study is given in Fig. 2. Here we have shown relative (with respect to the tentative GM) energies of the Ti32 structures on the PES described by IP, PBEsol with the light and PBEsol with tight basis sets.For the largest (N = 32) clusters investigated in this work, the number of LM decreases with the level theory. In the given case, the 250 lowest energy LM obtained on the IP PES using GA were refined using the PBEsol functional with the light basis set. On refinement, the number of LM decreased from 250 on the IP PES to 185 on the PBEsol light PES. This significant reduction is observed as some groups of metastable LM on the IP PES converge to a single LM on the PBEsol light PES.
Fig. 2 illustrates the change in the LM ranking, based on energy, when switching from one level of theory to another. The lowest energy structure on the IP PES is not necessarily the lowest energy structure on the PBEsol light PES. In fact, in most of the cases when N ≥ 10, the lowest energy structure on the PBEsol energy landscape is different from the IP PES lowest energy structure. Thus, it is necessary to choose a sufficiently large energy range for each cluster size, that would ensure that at least one of the LM on the PES for the for the lower level would relax to the GM of the higher level. For our simulations, the chosen ≈1.0 eV energy range has proved to be sufficient.
After the results on the PBEsol light PES were obtained, the new structures were reoptimised on the PBEsol tight PES. Similarly to the previous refinement, the number of unique LM decreased (185 to 132) and the energy ranking has changed, but at a much lower extent to that seen between IP and PBEsol light.
The resultant configurations were then analysed using spin polarised calculations to investigate whether small TiN clusters have magnetic moments that also effect a change in energy ranking.
2.2 Spin polarisation
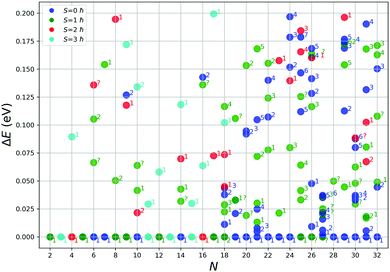
We have further investigated the fifty lowest PBEsol spin non-polarised energy structures using the PBEsol functional with spin polarization and the tight basis set. Based on a preliminary study, three overall spin moments, S, were used: 1, 2 and 3 ħ. Exploratory calculations for higher spin values consistently yielded much higher energies. The results from spin unpolarized and polarized calculations are juxtaposed in Fig. 3.As can be seen from Fig. 3, a majority of smaller clusters (N < 19) stabilize with higher overall spin moments. Exceptions are clusters of size N = 6, 7, 10, and 14, whose tentative GM structures are non magnetic. For bigger clusters (N > 23), most of the tentative GM structures have an overall spin moment of 0, except for N = 25, 26 and 27. For N = 25, the GM is only the second lowest energy structure from the GA search, whereas for N = 26 and 27, the GM spin polarized structures optimised to new configurations, which were not found during the GA search. For the smaller clusters (N < 19), the energy difference between the spin polarized tentative GM and higher energy spin unpolarized lowest energy LM is more pronounced than for bigger clusters (N ≥ 19), which suggests that for the bigger clusters there will be a greater competition for the ground state as there are more configurations of different spin with a similar energy. In most of the cases, the topology (as shown by atomic coordination) of the tentative GM is unchanged on refinement with spin polarized calculations, except for N = 18, whose new spin polarized tentative GM had the second lowest energy during the spin unpolarized GA search and the new N = 26 and 27 tentative GM, which were not found during the GA search.
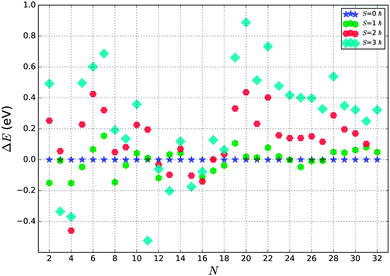
In Fig. 4 we show the effect of spin polarization on the energy of tentative GM structures. The results clearly indicate the tendency for the small (N < 19) TiN clusters to stabilize in a magnetic state, whereas bigger (N ≥ 19) TiN clusters prove to be non magnetic in the ground state with the exceptions described above.
The resultant tentative GM configurations were investigated further by studying the evolution of structural patterns adopted by small GM TiN clusters with cluster size, N.
3 Structures and stability
We now consider the atomic and electronic structure and chemical bonding in the TiN clusters obtained using the GA method and multi-step refinement procedure.3.1 Structural features
We start by comparing our predictions with results from the most recent systematic study of TiN clusters,36 in which clusters of up to twenty atoms were investigated. There is still little known about the configurations and properties of the structures with a greater number of atoms, where the phase space for such sizes is much larger.Even though a large number of isomers have been considered in this study, especially for larger sizes, for simplicity, we provide an image and description for just the ground state of each size. The whole set of structures, which were considered, are uploaded into the WASP@N database68 and can be found using the DOI (Digital Object Identifier) of this paper.
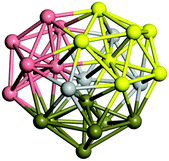
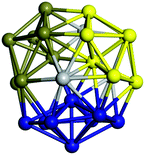
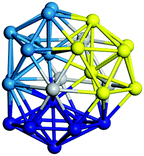
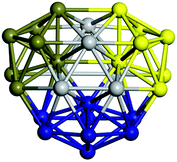
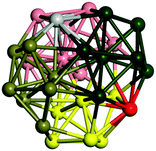
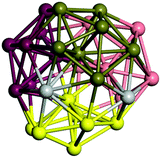
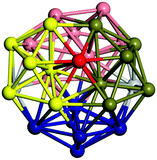
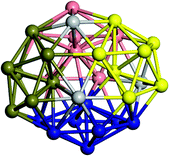
From N = 3 to 9, the configuration and energy rankings of all structures match those reported previously by ref. 36. For N = 10, our tentative ground state is a bicapped quadrilateral antiprism and is the second lowest energy structure in ref. 36. Starting from N = 11, we can see a clear trend of how the TiN cluster is evolving with size. In the case of N = 11, the lowest energy structure is a tetracapped pentagonal bipyramid, and by adding an atom to the tetracap, the ground state of N = 12 – a pentacapped pentagonal bipyramid is obtained. By continuing this process we form the ground states of N = 13 and N = 14 – an icosahedron and a capped (capping one atom over a triangular face) icosahedron, respectively. The following three tentative GM are a sixfold icositetrahedron, or Z14 Frank–Kasper polyhedron; Z15; and Z16 Frank–Kasper polyhedra. For N = 18, the ground state is a capped Z16 Frank–Kasper polyhedron; the capping atom is coloured pink in Table 3. Starting from N = 19, the ground states are formed by at least two interpenetrating fragments of higher symmetry configurations, such as icosahedra and Frank–Kasper polyhedra. To highlight which fragments were detected in tentative ground states, the following colouring was used in Tables 3 and 4: the atoms forming icosahedron fragments are coloured yellow (or khaki or pink), the atoms from sixfold icositetrahedra are coloured blue (or light blue) and the atoms from the Z15 Frank–Kasper polyhedron fragment are shown in orange. Using this colour map, we observe that the ground states of N = 19 and N = 20 are two interpenetrating icosahedra with the latter having an extra atom filling a vacant site.
Overall, our results for N = 3–20 corroborate the report by ref. 36 with only one exception of N = 10, where the two lowest energy structures are inter changed. This change in ranking might be an effect of using a different functional and/or different convergence criteria, as the energy differences between the two competing isomers are small, <0.03 eV in our calculations and <0.2 eV in ref. 36. The perfect agreement in the remaining ground states for N = 3–20 using two independent methods and implementations gives a high confidence in the predicted tentative GM.
Above N = 21, there are no reports of the ground or low energy states of TiN clusters. Hence, we could only compare our predicted structures with those reported for other transition metals. In fact, a reasonable comparison could be made only with palladium clusters reported in ref. 69 as discussed below.
Similar to N = 19 and N = 20, the Ti21 structure is also formed of two interpenetrating icosahedra with extra atoms filling vacant sites of the parent structure. For N = 22, the ground state is a structure of two tetracapped (highlighted in green) hexagonal rings, which can be thought of as fragments of capped Z16 Frank–Kasper polyhedra (N = 18). The N = 23 and N = 24 clusters are interpenetrating icosahedra with a tricapped top of Z16 Frank–Kasper polyhedron as the latter has an extra atom filling a vacant site. For GM structures of size N = 25–28, a new growth pattern can be observed based on three interpenetrating fragments. Starting from N = 25, the ground state is formed by three interpenetrating icosahedral fragments; at N = 26 one of the icosahedral fragments expands to a sixfold icositetrahedral fragment; at N = 27, two of the N = 25 icosahedral fragments expand to sixfold icositetrahedral fragments; whereas for N = 28, the ground state is composed of one icositetrahedral and two interpenetrating icosahedral fragments with two trianglar faces connecting the interpenetrating parts. From N = 29 to N = 32, the growth pattern, based on four interpenetrating fragments, continues. The N = 29 ground state has four interpenetrating icosahedral fragments, two of which (yellow and dark green) share an atom (red); as for N = 30, the four interpenetrating icosahedra fragments do not share atoms between them. Similar results are obtained for N = 31 and N = 32, except that one of the icosahedral fragments is replaced with an icositetrahedral fragment. Finally, we note that the atomic structures predicted here for Ti23 and Ti29 closely resemble the corresponding palladium structures.69
In the following analysis, we will use notation based on the descriptions given above for configurations of the GM: clusters with sizes from N = 2 to 10 do not have inner coordination centres (0-c.c.), clusters with sizes from N = 11 to 18 will be addressed as having one coordination centre (1-c.c.), for N = 19–24 – two coordination centres (2-c.c.), from N = 25 to 28 – three (3-c.c.), and lastly, Ti clusters with sizes from N = 29 to 32 as having four coordination centres (4-c.c.).
3.2 Stability
We characterize the relative stability of tentative GM clusters by their first and second order energy differences as defined in eqn (3) and (4), respectively, and their binding energies (note the sign, the lower the value the more stable the cluster) as defined in eqn (5):| Δ1(N) = EN − EN−1 − E1, | (3) |
 | (4) |
 | (5) |
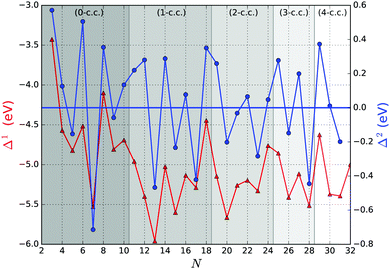
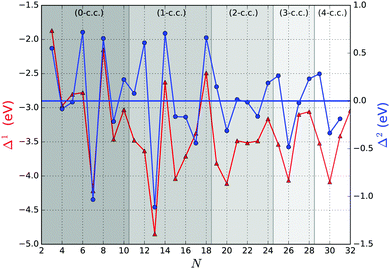
Fig. 5 shows the first and second order energy differences, where the former provides an indication of energetics growth, or nucleation: the lower the value, the more favourable the nucleation; whereas the negative value in the latter implies a greater stability of a cluster compared to clusters of neighbouring sizes, as described in ref. 61. Clusters with the lowest negative Δ1(N) and Δ2(N) values would maintain overall stability and therefore abundance in observed mass spectra for certain sizes, also known as magic numbers. From Fig. 5, we note that N = 5, 7*, 9, 13*, 15, 17*, 20, 23, 26, 28*, and 31 Δ1(N) values are in local minima, which match LM found for Δ2(N). We mark those with particularly negative Δ2(N) with a “*”. Magic number assignment for sizes N = 7 and 13 is in agreement with previous theoretical and experimental studies.20,25,26,29,36,70,71
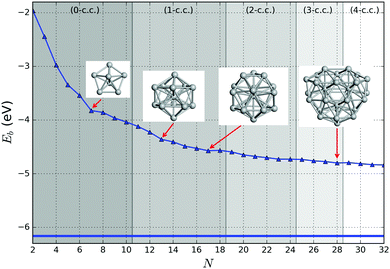
In Fig. 6 the binding energy steadily improves with cluster size with an asymptotic value of −5.155 eV, which is about 1.006 eV less stable than the bulk hcp Ti metal's value of −6.161 eV, represented by the blue line at the bottom, which is close to the calculated value of −6.040 eV reported by ref. 36 (cf. the standard enthalpy of formation of 4.824 eV is over 1.2 eV smaller than the magnitude of either calculated values and, thus showing that the GGA calculations do overestimate significantly the binding energy for Ti as is well known for a wide range of chemical compounds42,72,73). The difference between the asymptotic cluster value and the bulk energy can be assigned essentially to the shell structure of the clusters: the majority of the atoms are actually on the cluster surface, e.g. 28 surface atoms compared to 4 c.c. atoms for N = 32. The GM of the largest titanium cluster in this work, Ti32, has a binding energy of −4.838 eV, which is still 1.323 eV above the calculated bulk value. We note that the binding energies of Ti18 and Ti29 clusters are slightly higher than its respective nearest neighbour Ti17 and Ti28, indicating an instability with respect to size. On the other hand, binding energies of N = 7 and 13 almost plateau with neighbouring larger size clusters, and for N = 17 and 28, the binding energies are lower than those of the neighbouring larger size clusters, thus indicating the relative stability and prospect for these clusters being magic. Interestingly, two out of four tentative magic numbers are in the 0 and 1-c.c. region and the largest one is from the 3-c.c. region.
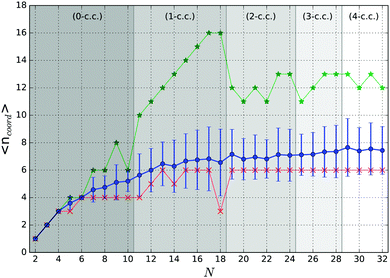
Particular stability of magic number clusters can be correlated with their geometrical parameters such as coordination numbers. The dependence of the average coordination numbers 〈ncoord〉 on cluster size is shown in Fig. 7 for all tentative GM. For simplicity, we consider atoms within a range of 3.1 Å of an another atom to have a coordination bond.
As expected, 〈ncoord〉 shows a nearly steady increase with the GM size towards the bulk hcp Ti value of 12. More informative, however, are the dependencies on cluster size of the minimum and maximum coordination numbers. Starting from N = 13, with the exceptions for N = 14 and 18, the minimum coordination number of 6 is associated with the central atom of a pentagonal ring, which, as can be seen from Fig. 3 and 4, is the main building block forming the outer shell of the clusters presented in this work.
The graphs of the coordination numbers in Fig. 7 show a clear dependence on the number of coordination centres in the cluster, which can be used to support the previous suggestion of the tentative magic numbers. For the 0 and 1-c.c. cases, we can see almost a linear increase in the maximum coordination number, which reaches 16 at N = 17 for the central atom of the Z15 Frank–Kasper polyhedron. On adding an additional atom, to N = 18, as it was described in Section 3.1, an extra atom is added on one of the faces of the Z15 Frank–Kasper polyhedron. The change in the structural motif results in the reduction of 〈ncoord〉, as the added atom has a coordination number of 3, as seen in the drop of the minimum coordination number. Moreover, for N = 13 and 17, the neighbouring sizes have lower average coordination numbers, which indicates the possible stability of these sizes.
Within the 2-c.c. region, the highest average coordination number is found for N = 19 cluster, which, like the N = 21 structure, is formed by two interpenetrating icosahedra and also has a higher 〈ncoord〉 than its neighbours. A similar observation can be made for N = 23, but the lack a of stable trend in the coordination numbers implies no particular stability within this region.
Similarly to the 1-c.c., in the 3-c.c. region we observe a steady increase in the average and maximum coordination numbers, where both reach peak values at N = 28, again implying the potential stability of this size.
Within the 4-c.c. region, similar trends to those described for the 2-c.c. region are observed – the smallest cluster in the region has the maximum average coordination number and the consecutive sizes do not show any particular trends, thus no particular stability in the region should be expected.
3.3 Energetic distribution
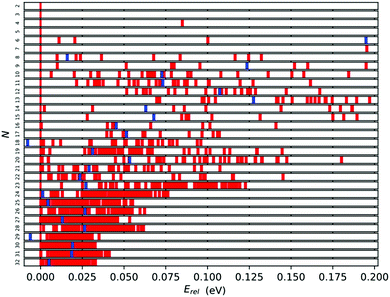
A further measure of stability can be gleaned from the energy distribution for each cluster size. The spread of energies (Erel = (ELM(N) − EGM(N))/N) can be seen in Fig. 8 for all cluster sizes. We expect that the wider the gap between the tentative GM (the red bar on the 0.00 eV mark) and the first lowest energy LM, the more stable the GM. From this perspective the most stable tentative GM are Ti7, Ti12, Ti13, Ti17, Ti23, Ti24 and Ti29 with the relative energy gaps per atom of 0.195, 0.052, 0.070, 0.040, 0.013, 0.006 and 0.004 eV, respectively. As expected, the Erel distribution narrows with cluster size, and the relative stability of the tentative GM decreases, as there are an increasing number of LM that are energetically close.In Fig. 8, the blue bars indicate the relative energy of the tentative GM for size N − 1; the further to the left, the more stable TiN−1 is with respect to TiN. For N = 18 and 29, the tentative GM has a higher energy per atom than the corresponding N − 1 GM, i.e. N = 17 and 28. This energetic distribution corroborates the tentative assignment of magic numbers made previously based on the binding energies and energy differences: for small Ti clusters, Ti7 and Ti13, due to the significant energy difference between the best two LM of each size, and for larger Ti clusters, Ti17 and Ti28, owing to the unfavourable TiN+1 energies.
3.4 Surface area
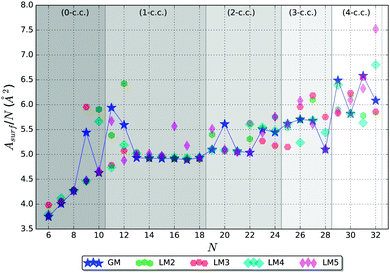
It is useful to compare surface areas as metal clusters are often compared with liquid droplets. Such droplets are more stable when they adopt spherical shapes in order to minimise their surface area. For large clusters, we can expect the larger fraction of atoms to be located inside the cluster with the remainder exposed at the surface, which warrants a ∼N2/3 asymptotic behaviour of the surface area, a regime we have not yet reached. For smaller clusters where the majority of atoms are on the surface, the surface area should depend on N linearly. The coefficient in the linear dependence will be determined mostly by the number of bulk atoms, or atoms playing the role of coordination centres as discussed previously. In the presence of such centres, we should also expect that the stability of a cluster will be determined both by the requirement of minimising the surface area and maximising the average coordination number. To check this hypothesis, we have analysed the surface area of the five lowest energy LM as a function of cluster size, shown in Fig. 9.Fig. 9, indeed, shows the expected behaviour – increasing Asurf/N with N. Curiously, the lowest energy structure does not always have the lowest Asurf/N, and, in many cases, higher energy LM have Asurf/N lower that of GM, especially for N > 22. Nonetheless, the Asurf/N correlates well with average coordination numbers and energetic measures of stability.
A spheroid concept is not applicable at the lowest end of the size scale, N, and becomes meaningful, perhaps, only from ∼N = 6 (cf. figures in Table 3 and graphs in Fig. 7 and 9).
In the 0-c.c. region, the surface is formed by a gradual increase in the number of triangular facets from 4 to 16. Before the average coordination number of surface atoms is saturated, the facet growth is faster than that of the expected spheroid area. With cluster growth, however, the discrete faceted surface resembles and approximates a spheroid more accurately. The N = 9 GM cluster shows a first indication of forming a coordination centre with one of the atoms increasing its coordination number to 8, while preserving coordination of the remaining atoms. This break in the trend can clearly be seen in the increased Asurf/N.
The 1-c.c. region thus starts with two clusters of greater surface area than expected (N = 11 and 12), as the GM stabilization originates from the formation of the c.c. In common with N = 9, the GM structures of N = 11 and 12 share a similar configurational property – one pentagonal cap, which expands clusters and maximizes their surface area. From N = 13, the tentative GM have a more symmetrical main building block, as described in Section 3.1, and we observe a plateau in Asurf/N, where it slowly decreases until N = 17, which, again, suggests possible stability of this particular size.
In the 2-c.c. region, Asurf/N shows a decreasing trend reaching the lowest value at N = 22, except for N = 20. At N = 23, the trend is broken, which correlates with the dramatic increase in the maximum coordination number, which clearly describes the environment of the two coordination centres. Thus we observe an interplay between the surface and bulk coordination trends, as hypothesised in the beginning of this subsection.
In the 3-c.c. region, a very low Asurf/N GM is seen at N = 28, whereas the data points for the other three sizes form a rough plateau. As the sustainable coordination number (〈ncoord〉 = 13 in this c.c. region) is reached, the N = 28 GM adopts the first available minimum surface area configuration, which also gives a possible explanation for stability.
In the 4-c.c. region, we cannot deduce any particular trends in Asurf/N from the available data points. The seemingly erratic behaviour can, however, be related to the increasingly intricate balance between the surface and bulk coordination trends. As the number of c.c. increases, we expect an emergence of greater scale features that average over irregularities at neighbouring sizes. Each new c.c. centre should give rise to a new plateau until a saturation surface to bulk ratio is reached, after which the surface area per atom should show a decreasing trend with the ∼N−1/3 asymptote and a stepwise behaviour close to the expected maximum of Asurf/N. We expect that this theory will be confirmed by future larger size cluster studies.
3.5 Refinement
As the GGA exchange–correlation functionals prove to be only moderately accurate in reproducing the binding energies (compared to experiment as can be seen from a significantly better reproduction of bulk and molecular dimer energies), the tentative GM structures for each size were refined using hybrid functional (PBEsol0) single point calculations. The PBEsol0 energies obtained were used to calculate binding energies and first and second order energy differences.PBEsol0 binding energy (Fig. 10) shows a similar behaviour with cluster size to that of the PBEsol level of theory. The match is potentially good within the 0-c.c. and 1-c.c. regions and provides further support of the stability of N = 7, 13 and 17 GM; likewise, the match is good within the 2-c.c. region although here the graphs are both featureless.
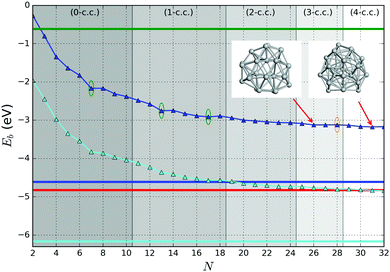 | ||
| Fig. 10 Binding energy of the tentative GM on the PBEsol0 PES (dark blue lines and triangles). The green (orange) elipses highlight key sizes where greater stability is predicted (not) to be the same using both levels of theory. Two ball and stick models of key GM configurations on the PBEsol0 PES are marked with arrows. Bounds on the data shown are provided by the binding energies for the smallest (N = 2) and largest (bulk) are shown with horizontal lines: the experimental dissociation energy of Ti2 is shown in green;23 PBEsol0 for bulk in blue; PBEsol for bulk in cyan; and the experimental value of cohesive energy is indicated in red.74 The background bands indicate the number of coordination centres (c.c.) in the tentative GM. | ||
A pronounced difference between the two levels of theory can be observed, however, within the 3-c.c. and 4-c.c. regions. On the PBEsol PES, N = 28 is the only size showing particular stability, whereas on the PBEsol0 PES, it is a maximum between two tentative magic numbers: N = 26 in the 3-c.c. and N = 31 in the 4-c.c. regions, respectively.
Following a similar procedure employed to assist in the assignment of magic numbers in Section 3.2, from Fig. 11 we now identify values of N that correspond to low LM of Δ2(N) as measured using PBEsol0. These are cluster sizes N = 7*, 9, 13*, 15, 17, 20*, 23, 26* and 30*, where those marked with a “*” also have low LM in Δ1. Apart from N = 30, which has a similar stability to N = 31, the remaining eight sizes matched those found previously for PBEsol GM. This includes the originally assigned N = 7 and 13 magic numbers. Two sizes did, however, disappear, namely N = 5 and 28. As the hybrid approach corrects the overbinding by the PBEsol functional, the overall average slope in Fig. 10 decreases and so does the scale for Δ1. Curiously the scale for Δ2 increases indicating the greater stability of certain size GM.
3.6 Electronic properties
In Fig. 11 we show the energies of the highest occupied (HOMO) and the lowest unoccupied (LUMO) molecular orbitals for the two levels of theory, and in Fig. 11, we present the calculated HOMO–LUMO gap, ΔE. As expected, ΔE decreases with increasing cluster size. This trend is evident in the PBEsol results but is more pronounced when employing the PBEsol0 functional. From the HOMO and LUMO energies, we observe that this decrease in ΔE is mainly a consequence of the lowering of the LUMO energy; as the cluster size increases, the quantum confinement effect on the more diffuse conduction-band-like states decreases and the LUMO becomes more stable. The HOMO energy, however, remains relatively constant as N increases. We expect that ΔE will reduce to zero when the HOMO and LUMO energies lie between −3.5 and −4 eV, relative to vacuum, but closer to the −3.5 eV end of this range (from the PBEsol0 results). Such a value of the HOMO energy would result in a work function somewhat lower than the experimental value for bulk Ti (3.95 eV from thermionic emission, 4.06 eV from photoelectric emission;75 note the positive sign convention for the work function, which is opposite to our convention for electronic levels relative to vacuum). This difference can be attributed to the fact that the clusters studied here are composed of Ti atoms that are typically on the surface of the cluster as opposed to atoms coordinated in a bulk-like fashion. As a consequence, the HOMO is composed mostly of states on surface atoms, and is hence less stable than it would be if the majority of atoms were bulk-like. If N were increased much further, so that the surface to volume ratio of the clusters reduced significantly and most of the atoms were coordinated as in bulk Ti, then we would expect the HOMO energy to lower and the work function to be closer to the experimental values.Although there is a clear overall trend in the energy of electronic states with cluster size, there is a high degree of fluctuation within this trend. It is difficult to attribute this variation to specific structural properties of the clusters, but the surface morphology, Ti coordination and ratio of surface to bulk-like atoms will all play a role. In Fig. 12, we have indicated the filling of coordination centres by different levels of shading; we see that, from the PBEsol0 results, apart from the 0-c.c. case, whenever an inner centre becomes fully coordinated (at the right-most point of each shaded region), the gap reduces, and then increases with additional atoms forming an additional c.c. This effect indicates a degree of stabilisation of the LUMO and destabilisation of the HOMO as the centre becomes coordinated, which may be related to (i) a reduction of the quantum confinement effect on LUMO states as more of the diffuse electron density can reside within the cluster on metallic bonds, and (ii) a decrease in the predominance of covalency as the bonding becomes increasingly metallic, which increases the HOMO energy due to their lower stability.
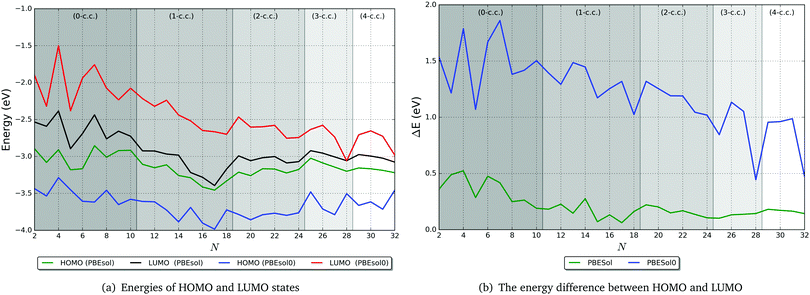 | ||
| Fig. 12 Electronic properties of tentative GM TiN clusters at two levels of theory: PBEsol and PBEsol0. The background bands indicate the number of coordination centres (c.c.) in the tentative GM. | ||
4 Conclusions
We have presented a systematic study of TiN clusters (N = 2–32) and their structural, electronic, and bonding properties. The results for N = 2 to 20 show good agreement with those reported by Sun et al.36 Here, a higher level of theory is employed, a more detailed exploration of LM and larger clusters (N = 21–32) are systematically studied for the first time. Our results show that the GM are formed of interpenetrating icosahedra and Frank–Kasper polyhedra. Early reports of small Ti clusters have found that the magnetic moments tend to decrease with the system size and disappear by N = 17. In contrast, we found non-zero spin moments persist to larger sized clusters: we report that magnetic moments of the lowest energy structures for N = 18, 25, 26, and 27 have an overall spin moment of 1 ħ. Analysis of the cluster energetics and structural features allowed us to identify new sizes of greater stability, which might be observed in a greater abundance. In particular, both PBEsol and PBEsol0 calculations agree with previous suggestions that N = 7 and 13 are “magic”. Furthermore, a match was found for additional seven sizes of enhanced stability using both levels of theory. Key to rationalising our results has been development of a new analytical toolkit including the measurement of surface area for a cluster and the identification of centres of coordination, which act as centres of bulk nucleation in medium sized clusters. The increase in the number of the latter is found to relate to the changes in the morphological features of GM.Author contributions
T. L. and A. A. S. prepared the manuscript, constructed the models and analytical tools. T. L. and T. M. P. performed the simulations. T. L., A. A. S., S. M. W., J. B., S. G. E. T, M. R. F., D. M.-F. and T. M. P. analysed results. V. W. B. provided expertise required in our DFT calculations. C. R. A. C., S. M. W., H. R. C. and P. E. N. formulated the project. T. L. and S. M. W. developed original methodological approach, software and provided overall supervision of the project.Conflicts of interest
There are no conflicts to declare.Acknowledgements
The research is part of the collaboration between the groups of C. R. A. C. and S. M. W. University College London (UCL) and P. E. N. and H. R. C. University of Limpopo (UL), funded by the Royal Society Advanced Fellowship Newton Grant (NA140447). The authors thank Dawie van Vuuren for useful comments in the course of this project and EPSRC for funding (grant numbers EP/K038958/1, EP/I03014X and EP/K016288/1). This work made use of the facilities of ARCHER, the UK's national high performance computing service, access to which was obtained from an MCC membership, which itself is supported by EPSRC grant EP/L000202, and UCL Faraday and Grace high performance computing facilities, and UCL Research computing platforms services.References
- J. A. Alonso, Chem. Rev., 2000, 100, 637–678 CrossRef CAS PubMed.
- A. Fernando, K. L. D. M. Weerawardene, N. V. Karimova and C. M. Aikens, Chem. Rev., 2015, 115, 6112–6216 CrossRef CAS PubMed.
- S. M. Woodley and R. Catlow, Nat. Mater., 2008, 7, 937–946 CrossRef CAS PubMed.
- M. R. Farrow, J. Buckeridge, T. Lazauskas, D. Mora-Fonz, D. O. Scanlon, C. R. A. Catlow, S. M. Woodley and A. A. Sokol, Phys. Status Solidi A, 2017, 214, 1600440 CrossRef.
- F. H. S. Froes, in Titanium Powder Metallurgy, ed. M. Qian and F. H. S. Froes, Elsevier, Boston, 2015, pp. 1–19 Search PubMed.
- D. S. van Vuuren, in Titanium Powder Metallurgy, ed. M. Qian and F. H. S. Froes, Elsevier, Boston, 2015, pp. 69–93 Search PubMed.
- F. H. (Sam) Froes, Titanium Powder Metallurgy, Elsevier, 2015, pp. 95–99 Search PubMed.
- W. van Tonder, MScEng thesis, Stellenbosch University, 2010.
- D. V. Vuuren and H. Greyling, CSIR Science Scope, 2015, 8, 74–75 Search PubMed.
- O. Diéguez, M. M. G. Alemany, C. Rey, P. Ordejón and L. J. Gallego, Phys. Rev. B: Condens. Matter Mater. Phys., 2001, 63, 205407 CrossRef.
- V. G. Grigoryan and M. Springborg, Chem. Phys. Lett., 2003, 375, 219–226 CrossRef CAS.
- I. Rata, A. A. Shvartsburg, M. Horoi, T. Frauenheim, K. W. M. Siu and K. A. Jackson, Phys. Rev. Lett., 2000, 85, 546–549 CrossRef CAS PubMed.
- K.-M. Ho, A. A. Shvartsburg, B. Pan, Z.-Y. Lu, C.-Z. Wang, J. G. Wacker, J. L. Fye and M. F. Jarrold, Nature, 1998, 392, 582–585 CrossRef CAS.
- F.-C. Chuang, C. Z. Wang and K. H. Ho, Phys. Rev. B: Condens. Matter Mater. Phys., 2006, 73, 125431 CrossRef.
- W. Zhang, W.-C. Lu, J. Sun, C. Wang and K. Ho, Chem. Phys. Lett., 2008, 455, 232–237 CrossRef CAS.
- F. Liu, S. N. Khanna and P. Jena, Phys. Rev. B: Condens. Matter Mater. Phys., 1991, 43, 8179–8182 CrossRef CAS.
- H. Wu, S. R. Desai and L.-S. Wang, Phys. Rev. Lett., 1996, 77, 2436–2439 CrossRef CAS PubMed.
- H. Grönbeck and A. Rosén, J. Chem. Phys., 1997, 107, 10620–10625 CrossRef.
- G. L. Estiu and M. C. Zerner, J. Phys. Chem., 1994, 98, 4793–4799 CrossRef CAS.
- M. Sakurai, K. Watanabe, K. Sumiyama and K. Suzuki, J. Chem. Phys., 1999, 111, 235–238 CrossRef CAS.
- L. Lian, C.-X. Su and P. B. Armentrout, J. Chem. Phys., 1992, 97, 4084–4093 CrossRef CAS.
- S. R. Liu, H. J. Zhai, M. Castro and L. S. Wang, J. Chem. Phys., 2003, 118, 2108–2115 CrossRef CAS.
- M. Doverstål, B. Lindgren, U. Sassenberg, C. A. Arrington and M. D. Morse, J. Chem. Phys., 1992, 97, 7087–7092 CrossRef.
- H. Wu, S. R. Desai and L.-S. Wang, Phys. Rev. Lett., 1996, 76, 212–215 CrossRef CAS PubMed.
- S. H. Wei, Z. Zeng, J. Q. You, X. H. Yan and X. G. Gong, J. Chem. Phys., 2000, 113, 11127–11133 CrossRef CAS.
- J. Zhao, Q. Qiu, B. Wang, J. Wang and G. Wang, Solid State Commun., 2001, 118, 157–161 CrossRef CAS.
- M. Castro, S.-R. Liu, H.-J. Zhai and L.-S. Wang, J. Chem. Phys., 2003, 118, 2116 CrossRef CAS.
- S.-Y. Wang, J.-Z. Yu, H. Mizuseki, J.-A. Yan, Y. Kawazoe and C.-Y. Wang, J. Chem. Phys., 2004, 120, 8463–8468 CrossRef CAS PubMed.
- M. Salazar-Villanueva, P. H. H. Tejeda, U. Pal, J. F. Rivas-Silva, J. I. R. Mora and J. A. Ascencio, J. Phys. Chem. A, 2006, 110, 10274–10278 CrossRef CAS PubMed.
- J. Du, H. Wang and G. Jiang, THEOCHEM, 2007, 817, 47–53 CrossRef CAS.
- D. Tzeli and A. Mavridis, J. Chem. Phys., 2008, 128, 034309 CrossRef PubMed.
- J. G. Du, X. Y. Sun and G. Jiang, Eur. Phys. J. D, 2009, 55, 111–120 CrossRef CAS.
- A. N. Chibisov, Comput. Mater. Sci., 2014, 82, 131–133 CrossRef CAS.
- P. L. Rodriíguez-Kessler and A. R. Rodriíguez-Domiínguez, J. Phys. Chem. A, 2016, 120, 2401–2407 CrossRef PubMed.
- A. S. Chaves, M. J. Piotrowski and J. L. F. Da Silva, Phys. Chem. Chem. Phys., 2017, 19, 15484–15502 RSC.
- H. Sun, Y. Ren, Z. Wu and N. Xu, Comput. Theor. Chem., 2015, 1062, 74–83 CrossRef CAS.
- S. M. Woodley, J. Phys. Chem. C, 2013, 117, 24003–24014 CAS.
- M. R. Farrow, Y. Chow and S. M. Woodley, Phys. Chem. Chem. Phys., 2014, 16, 21119–21134 RSC.
- T. Lazauskas, A. A. Sokol and S. M. Woodley, Nanoscale, 2017, 9, 3850–3864 RSC.
- S. G. Escher, T. Lazauskas, M. A. Zwijnenburg and S. M. Woodley, Comput. Theor. Chem., 2017, 1107, 74–81 CrossRef CAS.
- D. Mora-Fonz, T. Lazauskas, M. R. Farrow, C. R. A. Catlow, S. M. Woodley and A. A. Sokol, Chem. Mater., 2017, 29, 5306–5320 CrossRef CAS.
- D. Mora-Fonz, T. Lazauskas, S. M. Woodley, S. T. Bromley, C. R. A. Catlow and A. A. Sokol, J. Phys. Chem. C, 2017, 121, 16831–16844 CAS.
- X. Wang and D. Tian, Comput. Mater. Sci., 2009, 46, 239–244 CrossRef CAS.
- S. Heiles and R. L. Johnston, Int. J. Quantum Chem., 2013, 113, 2091–2109 CrossRef CAS.
- R. Li, M. Odunlami and P. Carbonnière, Comput. Theor. Chem., 2017, 1107, 136–141 CrossRef CAS.
- M. Dittner and B. Hartke, Comput. Theor. Chem., 2017, 1107, 7–13 CrossRef CAS.
- A. Cuko, A. Maciá, M. Calatayud and S. T. Bromley, Comput. Theor. Chem., 2017, 1102, 38–43 CrossRef CAS.
- J. D. Gale, J. Chem. Soc., Faraday Trans., 1997, 93, 629–637 RSC.
- J. D. Gale and A. L. Rohl, Mol. Simul., 2003, 29, 291–341 CrossRef CAS.
- D. Mora-Fonz, J. Buckeridge, A. J. Logsdail, D. O. Scanlon, A. A. Sokol, S. Woodley and C. R. A. Catlow, J. Phys. Chem. C, 2015, 119, 11598–11611 CAS.
- D. E. E. Deacon-Smith, D. O. Scanlon, C. R. A. Catlow, A. A. Sokol and S. M. Woodley, Adv. Mater., 2014, 26, 7252–7256 CrossRef CAS PubMed.
- F. Cleri and V. Rosato, Phys. Rev. B: Condens. Matter Mater. Phys., 1993, 48, 22–33 CrossRef CAS.
- M. W. Finnis and J. E. Sinclair, Philos. Mag. A, 1984, 50, 45–55 CrossRef CAS.
- R. P. Gupta, Phys. Rev. B: Condens. Matter Mater. Phys., 1981, 23, 6265–6270 CrossRef CAS.
- V. Blum, R. Gehrke, F. Hanke, P. Havu, V. Havu, X. Ren, K. Reuter and M. Scheffler, Comput. Phys. Commun., 2009, 180, 2175–2196 CrossRef CAS.
- K. Lejaeghere, G. Bihlmayer, T. Bjorkman, P. Blaha, S. Blugel, V. Blum, D. Caliste, I. E. Castelli, S. J. Clark, A. Dal Corso, S. de Gironcoli, T. Deutsch, J. K. Dewhurst, I. Di Marco, C. Draxl, M. Duak, O. Eriksson, J. A. Flores-Livas, K. F. Garrity, L. Genovese, P. Giannozzi, M. Giantomassi, S. Goedecker, X. Gonze, O. Granas, E. K. U. Gross, A. Gulans, F. Gygi, D. R. Hamann, P. J. Hasnip, N. A. W. Holzwarth, D. Iuan, D. B. Jochym, F. Jollet, D. Jones, G. Kresse, K. Koepernik, E. Kucukbenli, Y. O. Kvashnin, I. L. M. Locht, S. Lubeck, M. Marsman, N. Marzari, U. Nitzsche, L. Nordstrom, T. Ozaki, L. Paulatto, C. J. Pickard, W. Poelmans, M. I. J. Probert, K. Refson, M. Richter, G.-M. Rignanese, S. Saha, M. Scheffler, M. Schlipf, K. Schwarz, S. Sharma, F. Tavazza, P. Thunstrom, A. Tkatchenko, M. Torrent, D. Vanderbilt, M. J. van Setten, V. Van Speybroeck, J. M. Wills, J. R. Yates, G.-X. Zhang and S. Cottenier, Science, 2016, 351, aad3000 CrossRef PubMed.
- S. R. Jensen, S. Saha, J. A. Flores-Livas, W. Huhn, V. Blum, S. Goedecker and L. Frediani, J. Phys. Lett., 2017, 8, 1449–1457 CAS.
- S. R. Jensen, S. Saha, A. Flores-livas, W. Huhn, V. Blum, S. Goedecker and L. Frediani, DataverseNO, 2017, pp. 1–8 Search PubMed.
- M. Ernzerhof and G. E. Scuseria, J. Chem. Phys., 1999, 110, 5029–5036 CrossRef CAS.
- J. P. Perdew, A. Ruzsinszky, G. I. Csonka, O. A. Vydrov, G. E. Scuseria, L. A. Constantin, X. Zhou and K. Burke, Phys. Rev. Lett., 2008, 100, 136406 CrossRef PubMed.
- C. R. A. Catlow, S. T. Bromley, S. Hamad, M. Mora-Fonz, A. A. Sokol and S. M. Woodley, Phys. Chem. Chem. Phys., 2010, 12, 786–811 RSC.
- W. Schroeder, K. Martin and B. Lorensen, The Visualization Toolkit: An Object-oriented Approach to 3D Graphics, Kitware, Inc., New York, 4th edn, 2006 Search PubMed.
- T. Lazauskas, PhD thesis, Loughborough University, 2014.
- M. S. Daw and M. I. Baskes, Phys. Rev. B: Condens. Matter Mater. Phys., 1984, 29, 6443–6453 CrossRef CAS.
- S. M. Le Grand and K. M. Merz, J. Comput. Chem., 1993, 14, 349–352 CrossRef CAS.
- P. G. Spirakis, STACS 85, Springer-Verlag, Berlin/Heidelberg, 1985, vol. 182, pp. 328–338 Search PubMed.
- J. L. Pascual-ahuir, E. Silla and I. Tuñon, J. Comput. Chem., 1994, 15, 1127–1138 CrossRef CAS.
- WASP@N – Web Assisted Structure Prediction at the Nanoscale, http://hive.chem.ucl.ac.uk.
- P. Nava, M. Sierka and R. Ahlrichs, Phys. Chem. Chem. Phys., 2003, 5, 3372–3381 RSC.
- B. Lee and G. W. Lee, J. Chem. Phys., 2007, 127, 10–15 Search PubMed.
- H. Sun, Y. Ren, Y. Hao, Z. Wu and N. Xu, J. Phys. Chem. Solids, 2015, 80, 105–111 CrossRef CAS.
- A. Walsh, C. R. A. Catlow, R. Galvelis, D. O. Scanlon, F. Schiffmann, A. A. Sokol and S. M. Woodley, Chem. Sci., 2012, 3, 2565 RSC.
- J. Buckeridge, D. Jevdokimovs, C. R. A. Catlow and A. A. Sokol, Phys. Rev. B: Condens. Matter Mater. Phys., 2016, 94, 180101 CrossRef.
- C. Kittel, Introduction to solid state physics, 2005 Search PubMed.
- E. A. Mechtly, Reference Data for Engineers, Elsevier, 2002, pp. 4-1–4-33 Search PubMed.
| This journal is © the Owner Societies 2018 |

