 Open Access Article
Creative Commons Attribution 3.0 Unported Licence
Ultrafast action chemistry in slow motion: atomistic description of the excitation and fluorescence processes in an archetypal fluorescent protein†
Pau
Armengol
a,
Lasse
Spörkel
b,
Ricard
Gelabert
 *a,
Miquel
Moreno
a,
Walter
Thiel
 *b and
José M.
Lluch
 ac
ac
aDepartament de Qímica, Universitat Autònoma de Barcelona, 08193 Bellaterra, Barcelona, Spain. E-mail: ricard.gelabert@uab.cat
bMax-Planck-Institut für Kohlenforschung, Kaiser-Wilhelm-Platz 1, 45470 Mülheim an der Ruhr, Germany. E-mail: thiel@kofo.mpg.de
cInstitut de Biotecnologia i de Biomedicina, Universitat Autònoma de Barcelona, 08193 Bellaterra, Barcelona, Spain
First published on 26th March 2018
Abstract
We report quantum mechanical/molecular mechanical non-adiabatic molecular dynamics simulations on the electronically excited state of green fluorescent protein mutant S65T/H148D. We examine the driving force of the ultrafast (τ < 50 fs) excited-state proton transfer unleashed by absorption in the A band at 415 nm and propose an atomistic description of the two dynamical regimes experimentally observed [Stoner Ma et al., J. Am. Chem. Soc., 2008, 130, 1227]. These regimes are explained in terms of two sets of successive dynamical events: first the proton transfers quickly from the chromophore to the acceptor Asp148. Thereafter, on a slower time scale, there are geometrical changes in the cavity of the chromophore that involve the distance between the chromophore and Asp148, the planarity of the excited-state chromophore, and the distance between the chromophore and Tyr145. We find two different non-radiative relaxation channels that are operative for structures in the reactant region and that can explain the mismatch between the decay of the emission of A* and the rise of the emission of I*, as well as the temperature dependence of the non-radiative decay rate.
1 Introduction
Fluorescent proteins are nowadays a major subject of interest in the scientific community. They continue to attract intense attention because of their many uses in biomedicine as imaging assets.1–5 Numerous studies are devoted to developing versions of these systems with improved spectral characteristics, such as tuned absorption and fluorescence wavelength, improved photostability or larger brightness.6,7 These efforts are more likely to be successful if a detailed understanding of the inner working of these proteins is established through fundamental investigation of their structure and mechanism of operation.Green fluorescent protein (GFP) is the prototypical fluorescent protein.1,2 The basic features of its structure, the nature of its chromophore, and the molecular description of its photocycle are nowadays firmly established. “Wild type” GFP (wtGFP) has an absorption spectrum with two bands, one at 398 nm corresponding to a neutral chromophore (A) and a less intense one at 476 nm with an ionized chromophore (B). Excitation of A to A* results in bright fluorescence at 508 nm (I*), with a large quantum yield (QY) of about 0.8. There is consensus that I/I* belongs to a species with an ionized chromophore in an A-type protein environment. The fluorescence rise of I* occurs very quickly, within few picoseconds, and with an H/D kinetic isotope effect (KIE) of ∼5.8 The generation of the fluorescent species involves the translocation of three protons along a proton wire, which starts at the chromophore (Cro) and involves a water molecule and residues Ser205 and Glu222 (the final acceptor).9–11
The double mutant GFP S65T/H148D was originally created in the process of producing ratiometric pH probes that could, for instance, help measuring the pH inside cells and organelles.12–15 It was developed after GFP S65T, a single mutant that stabilizes the ionized form of the chromophore in the ground state and shows neither A absorption nor I* emission and that was instrumental in establishing the nature of the B species. Interestingly, GFP S65T/H148D recovered the A absorption band, with the maximum red-shifted to 415 nm,16 and as a bonus it also regained the lost fluorescence at 508 nm, though with a smaller quantum yield of about 0.2.16 See Fig. 1 for a structural description of the environment of the chromophore in these proteins.
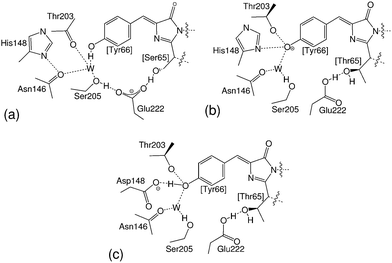 | ||
| Fig. 1 Chromophore and nearest interacting residues in (a) wtGFP, (b) GFP S65T and (c) GFP S65T/H148D. | ||
The fact that the rise in fluorescence of the I* band takes place very quickly and without measurable H/D KIE indicates that the proton transfer process in GFP S65T/H148D differs fundamentally from the one in wtGFP. Actually, GFP S65T/H148D hosts a much simpler excited state proton transfer (ESPT) process than wtGFP. The structure of the double mutant contains a very short O–O distance (2.32 Å, 2.41 Å after corrections) between Tyr66 in the chromophore and Asp148, which is the alternate final acceptor of the proton.16,17 The short donor–acceptor distance was suspected to underlie both the red shift of the A band and the ultrafast photocycle that lacks H/D KIE.18 It has thus been suggested that GFP S65T/H148D can be considered a paradigmatic fluorescent protein, having an elementary proton transfer that occurs very quickly, and that it may thus be the simplest system that can be used to unravel the complex dynamics of fluorescent proteins.17
A series of detailed time-resolved spectroscopic studies revealed unexpectedly complex properties and dynamics of GFP S65T/H148D. Its ground state was found to be heterogeneous, which led to proposals on the nature of the “hidden” or not resolved form of the ground state.18 No spectral evolution was found in time-resolved IR spectra for the carboxylate signals, which was interpreted in terms of a situation akin to a low-barrier hydrogen bond.17 Besides, the rise of the fluorescence signal at 510 nm occurs without KIE and extremely fast, being actually below the detection limit (50 fs in the most recent experiments).19 The driving force behind this extremely fast process has remained puzzling. For a while, it was commonly accepted that the photoexcitation would cause a sudden plunge in the pKa* of Tyr66 of at least 8 units, extrapolating the results obtained for the chromophore in solution in a theoretical study.20 This was assumed to cause a sudden shift of the potential energy minimum for ESPT from the vicinity of Tyr66 to Asp148 and trigger an ultrafast motion of the proton to its acceptor, likely in a single step without barrier.21
Theoretical studies can be of great help in interpreting experimental data and can assist in painting a coherent picture of phenomena occurring inside complex systems.22–24 In this spirit, some of us performed a detailed study of the ground state of GFP S65T/H148D with the goal of explaining the reasons behind this ultrafast process.25,26 Using quantum mechanical/molecular mechanical (QM/MM) and molecular dynamics (MD) methods the geometry of the Cro–Asp148 unit was satisfactorily reproduced.25 Moreover, QM potential energy (PE) profiles for proton transfer in the ground and excited electronic state of several snapshots from these simulations revealed that the proton transfer becomes more favored upon photoexcitation. All PE profiles were close to isoergic. However, no evidence could be found for the postulated extreme drop in pKa* value of Tyr66,26 which had originally been derived from a theoretical study of the chromophore in solution and in a conformation in which both rings were co-planar. The situation was found to be different in the protein: accounting for the effects of the protein surroundings led to an estimate of the pKa* decrease that was much smaller. Even in the absence of an overwhelming driving force, it was shown through quantum dynamics (QD) simulations that the essentially isoergic PE profile of the proton transfer supports a resonant non-stationary state where the proton transfers from donor to acceptor atoms and back with characteristic times under 50 fs. Further calculations demonstrated that the excited-state profiles are also rather flat, and QD simulations showed such resonant proton transfer also in the photoexcited state.24 The question remains: is this static picture a proper description of the photochemistry of GFP S65T/H148D in the excited electronic state?
It is fortunate that a wealth of precise time-resolved spectroscopic data has been put together for this protein using time-resolved infrared (TRIR) and pump–probe visible spectroscopies.13,16–19,21 Detailed measurements of the latter kind revealed more intriguing behavior. For instance, monitoring the fluorescence at lower energies than the fluorescence maximum (e.g. at 520 nm) showed no rise of the fluorescence at times above the detection limit, which means that the photoproduct is completely formed by then. Probing between 490 and 450 nm first showed an increasingly steep decay at short times (subpicosecond) and then a slower decay in the picosecond range.19 In all cases the rate of the process was insensitive to deuteration. This data suggest the existence of two different processes on different time scales. The first is very likely a barrierless proton transfer where Asp148 captures the proton from Tyr66, and the second a slower process, likely some unspecified internal vibrational relaxation (IVR).19 Time-resolved spectroscopic measurements at room temperature revealed that the rise of fluorescence of I* and the decay of fluorescence from A* did not completely match. The same measurements at 140 K yielded a much slower decay of the fluorescence from A* and an essentially unaltered rise of the fluorescence of I*. This seems to suggest that a non-radiative process is at work, able to depopulate A* without involving I*.18 Such non-radiative relaxation often proceeds through conical intersections (CIs).
We note in this context a recent ab initio QM/MM study on the non-radiative relaxation pathway in GFP S65T/H148D.27 The CI reported in that work can be classified as “product-type,” as its structure contains a well-formed aspartic acid and an ionized chromophore, both well separated from each other, and with the methinic hydrogen bent out of plane in a manner commonly referred to as “hula-twist.”
Theoretical simulations of fluorescence spectra are very costly, as they require excited-state MD runs. Ground-state MD simulations are normally done with empirical force fields that are fitted to reproduce ground-state properties. Some recent studies have employed classical MD simulations for the computation of full fluorescence spectra, using a specifically re-parameterized force field that reproduces the charges of the chromophore in the excited state.28 A similar approach is not feasible in GFP S65T/H148D, for reasons similar to those that limit the use of force fields in ground-state studies:26 the extremely short O–O distance between chromophore and Asp148 cannot be reproduced with ordinary force fields as the van der Waals term between these two atoms would keep them much further apart, and the crucial proton transfer between them involves bond making and bond breaking.
Hence, when aiming for a theoretical treatment that can predict the time-resolved fluorescence of GFP S65T/H148D, in order to compare with experiment and to check the hypotheses formulated thus far by experimental researchers, the only practical venue is to perform full excited-state QM/MM MD simulations. This is the approach taken in this work. At the QM/MM MD level, the non-radiative relaxation pathways via CIs will appear in a natural way provided that the chosen QM methodology can provide a balanced description of the electronic states involved and that the dynamics treatment can properly capture the time evolution of the system. In this article, we will show that the results from our previous static study26 remain valid, and in addition, we will elucidate the processes that concur to make the outcome of the process in the photoactive state irreversible, namely the formation of a neutral aspartic acid and an ionized chromophore.
2 Computational details
The goal of this work is to produce theoretical time-resolved fluorescence spectra of GFP S65T/H148D, and to use them to explain the wealth of the available experimental observations by linking them to the structure and dynamics of the system. The theoretical treatment of such a biological macromolecule requires special care in all stages of the modeling, involving the setup of a sample in the ground electronic state, the simulation of its evolution in the photoactive electronic state after the photoexcitation, and the evaluation of the fluorescence intensity. As already mentioned, we employ QM/MM methods to obtain the required energies and gradients. We first describe the setup of the QM/MM system and then specify the procedures used to integrate the MD trajectories and to compute the emission energies.2.1 QM/MM setup
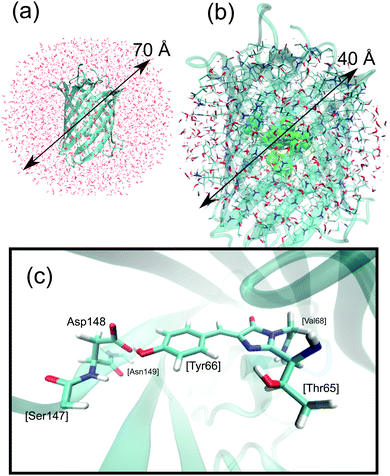
In a QM/MM model a part of the system is described using quantum mechanics, while the rest is described classically using molecular mechanics. The obvious choice here is to place the chromophore and Asp148 into the QM region, and the rest inside the MM region, which eliminates any need for force-field reparameterization and allows handling of the bond making and breaking processes upon proton transfer which will occur inside the QM region. This is also the approach taken in our previous ground-state dynamical study of GFP S65T/H148D.26 We can thus build on our previous results and extend them here to the excited state. The details of system design and the procedure used to compute the QM/MM MD trajectories are described in ref. 26, and therefore only a brief outline is given here.Protein coordinates were obtained from the structure deposited in the Protein Data Bank under accession code 2DUF.16 Missing atoms were added using the PROPKA server at pH 5.7.29–32 The system was solvated by putting it inside a water droplet with a radius of 35 Å. Water molecules were represented using the TIP3P model.33 Energies and gradients required for the MD simulations were computed within the QM/MM framework. The link atom method was used to saturate the bonds of QM atoms that connect to the MM part and the coupling between both parts employed the electronic embedding (EE) scheme,34 in which the QM part is polarized by the MM part. The charge-shift scheme was adopted to avoid overpolarization of the QM part because of nearby MM charges.35 The QM part of the system included the chromophore, Asp148, and parts of the closest residues (Val68, Ser147, Asn149), totaling 58 QM and 18508 MM atoms. See Fig. 2 for a graphical depiction of the system.
The QM/MM energies and gradients were computed with the ChemShell software.36–38 For the simulation of the ground state the orthogonalization model 3 (OM3)39–42 semiempirical Hamiltonian was used, which is known to provide reasonably accurate results for ground-state calculations of chemical and biochemical systems.35,40,41,43,44 The QM calculations were done with a development version of the MNDO99 suite.45 The MM region was described by the CHARMM22 force field46,47 and calculated using the DL-POLY CHEMSHELL device.48
When computing potential energy profiles, geometry optimizations were done with the HDCLOpt module of CHEMSHELL.49 In this case, the active zone (atoms allowed to move during the optimization) comprised all atoms within 20 Å of the center of the protein.
2.2 Excited state QM/MM molecular dynamics
Prior to photoexcitation the protein should be in equilibrium at room temperature. Thus, we need to generate an ensemble of structures representative of the A species in thermal equilibrium. To this end we used the 1 ns QM/MM trajectory from our previous work.26 The method of choice is to select representative snapshots of this ground-state QM/MM MD trajectory, simulate the photoabsorption process by promoting these snapshots to the excited state, and then continue the MD simulation using the energy and gradient of the excited state. Both the ground-state and excited-state MD simulations were done at constant temperature T = 300 K and under stochastic boundary conditions. The SHAKE algorithm was used to keep the distances between hydrogens and their bound heavy atoms in the MM part constant. Atoms within 20 Å of the center of the water droplet were allowed to move during the MD simulation.For the excited state special care needs to be exerted when computing QM/MM energies and gradients with the aim of integrating the equations of motion, not only because of accuracy concerns but also because the system may encounter a conical intersection between electronic states, so a balanced description of both states is required. On top of all, the costs incurred when computing electronically excited states are more onerous than those for the ground state, so a compromise between accuracy and efficiency needs to be sought. To get a balanced description of the photoactive and the ground electronic state we opted for a multireference configuration interaction treatment with single and double excitations (MRCISD) using the OM2 semiempirical Hamiltonian,43,50 which has been applied successfully in previous excited-state studies.42,51–59 In the OM2/MRCI calculations, the restricted open-shell Hartree–Fock formalism was applied in the self-consistent field (SCF) treatment. The active space in the MRCI calculations included 18 electrons in 18 orbitals. In terms of the SCF configuration, it comprised eight doubly occupied orbitals, the two singly occupied orbitals (SOMOs), and eight unoccupied orbitals. The two SOMOs are of π symmetry and are the main orbitals involved in the description of the photoactive excited state.25 The other active-space orbitals are comprised of the three highest doubly occupied π orbitals and the five other highest occupied orbitals, as well as the three lowest unoccupied π orbitals and the five other lowest unoccupied orbitals. For the MRCI treatment, three configuration state functions were chosen as references, namely the SCF configuration and the two closed-shell configurations derived therefrom (i.e., all singlet configurations that can be generated from HOMO and LUMO of the closed-shell ground state). The MRCI wave function was built by allowing all single and double excitations from these three references.
To simulate time-resolved spectra we need a certain number of structures, each of them corresponding to a different trajectory in the excited state and having run for the same time in the excited state. To this end we selected a bunch of phase space points of the trajectory in the ground state and promoted these snapshots to the excited state (at time zero). This “swarm” of trajectories was integrated from there on using the energy and gradients of the excited state. Each excited-state trajectory was thus started from a different phase space point visited by the ground-state trajectory. The velocities of all atoms were preserved during the transition so that the discontinuity in the total energy was confined to the potential energy term. The trajectory in the excited state was integrated in the NVE ensemble. The active region consisted of all atoms within 20 Å of the origin (center of the droplet). At every step two electronic states were considered (ground and photoactive), and their energies and gradients as well as their non-adiabatic couplings were computed on-the-fly. To allow for non-radiative transitions we employed the trajectory surface hopping (TSH) methodology,60–62 in which the molecular system is always in one specific electronic state, but with the possibility to undergo stochastic “hops” between electronic states. The time steps were chosen to be 1 fs for the nuclear motion and 0.0025 fs for the electronic motion. Whenever the energy gap between the ground and photoactive state dropped below 10 kcal mol−1 during the simulation, the fewest switches criterion was applied to derive the hopping probability and to decide whether a hop should take place.61,63 The empirical decoherence correction (0.1 a.u.) proposed by Granucci et al. was employed.64 During the integration of excited-state trajectories on MRCISD surfaces, there may be occasional discontinuities that originate from sudden changes in the active-space MOs during the finite integration step; to circumvent this problem we applied the adaptive time step algorithm recently proposed and applied to the GFP chromophore in solution.65 All TSH simulations were performed using the non-adiabatic dynamics module NADYM in a development version of ChemShell.36
All trajectories in the excited state were integrated for as long as they remained in it, or at most for 1.5 ps. Some trajectories ran into QM convergence problems and had to be discarded: this happened to 22 out of a total of 350 trajectories. Hence, thanks to the use of the adaptive time step algorithm, 93.7% of the trajectories survived, which is a similar success ratio as found previously.65
2.3 Simulation of fluorescence spectra
From each of the excited-state trajectories, the geometry of the system was extracted and saved at time intervals of 10 fs. Each of these snapshots was subjected to a single-point QM/MM calculation, with the same QM and MM regions as in the dynamics. The QM region was described using time-dependent density functional theory (TDDFT) with the Coulomb-attenuated functional CAM-B3LYP.66 This functional is known to perform well for organic chromophores of the size of the GFP chromophore, with a systematic tendency to overestimate excitation energies by about 0.35 eV.67 The TDDFT calculations employed the valence double-ζ basis set 6-31G(d,p). The polarization of the QM region by the MM region was captured through electronic embedding. The link atom approach was used to connect the QM and MM parts, and the charge-shift scheme was adopted to avoid overpolarization of the QM part because of nearby MM charges.35 The QM calculations were performed using the Gaussian09 software suite.68 We considered only the fluorescence from the photoactive excited state (i.e. the first excited singlet state) to the ground state.The fluorescence spectrum was computed as follows: the oscillator strength of a transition between states i and j is given by69
 | (1) |
 is the squared modulus of the transition dipole moment, which is itself proportional to the probability of transition between states i and j. This probability satisfies the following relation:
 | (2) |
 | (3) |
 | (4) |
3 Results and discussion
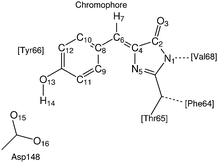
To facilitate the discussion we label the atoms in the environment of the proton transfer as shown in Fig. 3.3.1 Non-radiative relaxation channels
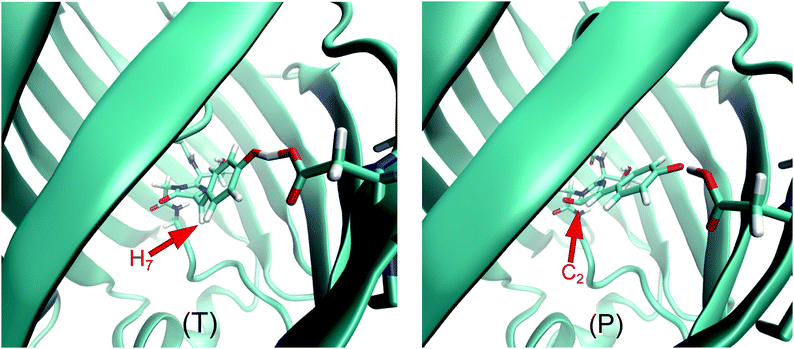
We first address the non-radiative decay processes operating via conical intersections in our system. Relevant in this context is a theoretical ab initio study,27 which explored the non-radiative relaxation pathways open to the chromophore in GFP S65T/H148D and in vacuo in terms of a two-step process, with an initial proton transfer from the chromophore to Asp148 followed by a rotation of the chromophore around the C4C6 bond. It was found that this two-step relaxation of the anionic chromophore takes place via a barrierless potential energy profile when in vacuo, whereas the same process in GFP S65T/H148D has to overcome a barrier of 3.2 kcal mol−1 at the stage of the rotatory isomerization.An analysis of the hopping points across the whole swarm of trajectories reveals that there are at least two different gateways to the ground state in our simulations. Fig. 4 shows a representative example of each of them. The first one (T) is qualitatively similar to the published pathway27 in that it involves a torsion around the C4C6 double bond, which takes the methinic hydrogen H7 strongly out of the plane of the chromophore. This deactivation channel accounts for roughly 90% of the non-radiative transitions to the ground state. However, while the CI found previously27 is of “product type” the one reported here (T) is of “reactant type”; that is, in the former case the donor–acceptor distance is much larger and thus closer to the situation in the product. We believe that the previously reported CI27 and our T-type CI may well be on the same conical intersection seam. The current simulation does not feature any hops near the “product type” CI, which may be due to the fact that none of our trajectories lives long enough in the excited state to reach the required large Asp148–chromophore distances.
The second kind of CI (P) accounts for about 10% of the non-adiabatic transitions to the ground state. In this CI the ketone carbon in the imidazolinone moiety (C2) becomes pyramidalized. To our knowledge this kind of CI has not yet been reported in connection to GFP-like chromophores. See ESI† for an exploration of the properties of this novel CI in the isolated chromophore.
During the MD simulations the approach to these CIs can be monitored through the dihedral angles H7C6C4N5 for T-type and C4C2O3N1 for P-type CIs (henceforth, θ and ρ, respectively). When a trajectory visits configurations far from these CIs, the values of both angles will remain around 180. In the neighborhood of a T-type CI one should expect θ = ±90, and likewise ρ ± 120 for a P-type CI. Fig. 5 shows the values of these dihedral angles at the hopping points for all non-adiabatic transitions encountered in the QM/MM MD dynamics of the excited state. It is noteworthy that both CIs are mostly encountered with a particular sign of the corresponding dihedral, not both.
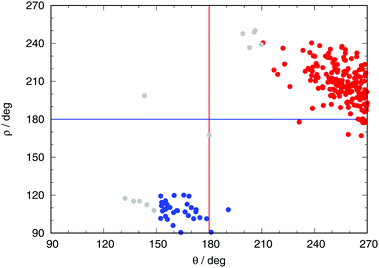 | ||
| Fig. 5 Values of the dihedral angles between atoms H7C6C4N5 (θ) and C4C2O3N1 (ρ) (see Fig. 3) at the hopping points. Red (blue) dots correspond to transitions through T-type (P-type) structures in Fig. 4. The red and blue lines denote the values of θ and ρ for a planar chromophore, respectively (180 in both cases). Grey dots indicate hopping events that have mixed character. | ||
One may ask at this point whether the QM(OM2/MRCI)/MM calculations give realistic CIs for GFP S65T/H148D. In the case of the T-type CI, this is supported by the fact that a qualitatively similar CI has been identified at the ab initio QM/MM level.27 In addition, we note that the OM2/MRCI methodology has been shown previously in a number of cases to be adequate for finding and describing CIs in medium-size organic chromophores. In particular, a recent paper presents comparisons of CI geometries and branching spaces for a total of 12 CIs in 8 organic molecules (including 2 CIs in the anionic form of the HBI chromophore closely related to GFP); these were located using ab initio MRCISD, SI-SA-REKS-DFT, SF-TDDFT, and OM2/MRCI methods and showed good agreement with each other.70 Further specific validation of OM2/MRCI against high-level methods is available for several other GFP-related chromophores.56,57
Finally, Fig. 6 summarizes the overall results for the hopping times from our non-adiabatic simulations. Obviously, the population of the photoactive state decays monotonously to zero within 1.5 ps in these simulations. Consequently, GFP S65T/H148D is incorrectly predicted to be non-fluorescent, contrary to the experimental finding of a quantum yield of 0.21. This implies that the deactivation via CI transit proceeds much too fast in our simulations. We postpone a discussion of this point and its consequences until later.
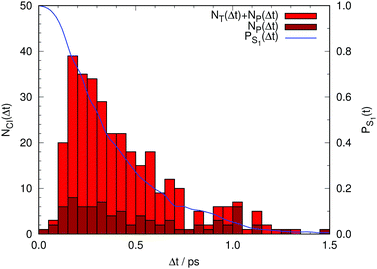 | ||
| Fig. 6 In red, total number of trajectories that transfer non-adiabatically from the photoactive to the ground electronic state either via a CI of type T (NT) or one of type P (NP). In brown, the number of trajectories that relax via a CI of type P, (NP) (see Fig. 4). The difference between the red and brown boxes corresponds to the number of trajectories that relax via a CI of type T. In blue, fractional population of the photoactive state (PS1) as a function of time lapse since photoexcitation. | ||
3.2 Fluorescence spectra
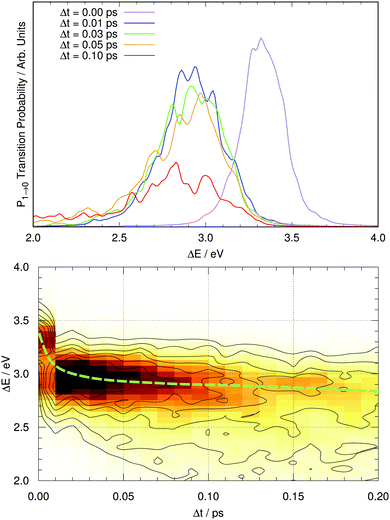
Fig. 7 shows the computed fluorescence spectrum of GFP S65T/H148D at different time gaps since photoexcitation (up to 0.1 ps). The snapshot corresponding to Δt = 0 corresponds to the induced fluorescence right after the system has been photoexcited: this should match the absorption spectrum under band A. The computed peak has its maximum at 3.32 eV (373 nm), while the experimental peak of absorption occurs at 415 nm, or 2.99 eV. The difference between both amounts to 0.33 eV. This is within the reported error expected for TDDFT(CAM-B3LYP) calculations, of about 0.35 eV.67 From now on, the values reported for the emission energy should be understood as overestimated by this amount.It is evident that a clear spectral evolution takes place as the peak of the band is moving quickly towards lower excitation energies, from ΔE ∼ 3.3 eV (Δt = 0) to about 3.0 eV at Δt = 0.05 ps. Later on the spectrum continues evolving but apparently the band maximum does not shift much any more, while the shape of the band changes. This is reminiscent of the two regimes described by Kondo et al.19 To visualize the existence of these two regimes we represent the time evolution of the full fluorescence spectrum in a two-dimensional plot in Fig. 7 for the first 200 fs after photoexcitation. The path followed by the maximum of fluorescence with time is suggestive: the process starts with a brisk shift of the emission band to lower energies (a decrease of about 0.3 eV in 30 fs), and afterwards the evolution continues with a slight decrease of the energy of the peak of fluorescence (about 0.1 eV per 100 fs) together with alterations of the shape of the band, which tends to broaden with time. Thus, there are two distinct regimes in the spectral evolution occupying different time frames.
Given this situation, it is tempting to check whether our simulation can also reproduce the experimental trend of the average emission frequency of the fluorescence band with time. This information is presented in Fig. 8, which should be compared to the experimental data of Kondo et al. in the inset of Fig. 2 in ref. 19. There is qualitative agreement in the general behavior: during the rise time our simulation predicts a fast bathochromic shift followed by a slower shift of the frequency over time. However, the agreement is not quantitative: the decrease of frequency in the initial 0.05 ps is approximately 0.5 eV and the subsequent decrease from 0.05 to 0.5 ps is about 0.7 eV in our simulations; both values are much larger than the experimentally estimated shifts of 0.005 eV and 0.05 eV, respectively.19 Experimental data on the evolution of the average fluorescence frequency is derived from fluorescence spectra that are quite symmetric, which means that variations on the average fluorescence frequency can be traced to shifts of the fluorescence maximum.19 In contrast, our computed fluorescence bands develop rather early an asymmetry in their shape that causes the average emission frequency to shift to the red, as the red tail of the emission band grows in general extent (see Fig. 7 and 8). There can be many reasons for this, but it is tempting to connect it to the excessive efficiency of the non-radiative deactivation channels, as those systems on their way to the electronic ground state will explore areas of configurational space with small excitation energies.
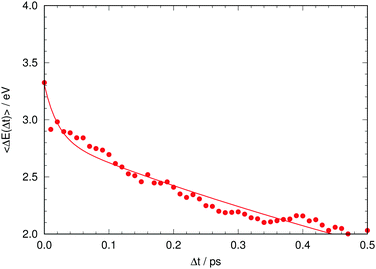 | ||
| Fig. 8 Time evolution of the computed average fluorescence energy. The solid line is a fitted biexponential function. | ||
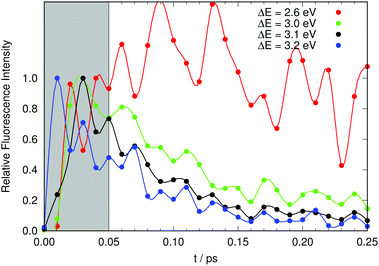
We now address the time-resolved fluorescence data at selected energies. Kondo et al. excited their sample at 415 nm and monitored the fluorescence at a variety of wavelengths from the blue to the red edges of the fluorescence band. They reported that fluorescence on the red end of the fluorescence band showed almost no decay, whereas they measured on the blue edge a fast decay with characteristic times below 1 ps.19 For comparison with Fig. 2 in ref. 19 we need to produce a plot of a theoretical fluorescence band. Judging from our Fig. 7 the computed fluorescence band will cover the range between 3.2 and 2.6 eV. We thus selected four values in this range and computed the time evolution of the fluorescence signal at 2.6, 3.0, 3.1, and 3.2 eV. The results are shown in Fig. 9.
The computed time-resolved fluorescence at the red end of the fluorescence band (2.6 eV) decays slowly (actually somewhat erratically because of poor statistics). This compares well to the experimental results monitored at 520 nm. The data at 3.0 eV, 3.1 eV and 3.2 eV show, in this order, increasingly fast decays, which compares qualitatively equally well to those measured at 490 nm, 460 nm and 450 nm.19
At this point we may conclude that our all-atom model manages to reproduce qualitatively the spectroscopic time-resolved data available for GFP S65T/H148D. It predicts the existence of two different dynamical regimes, as well as their relative rates. Apparently, with the necessary caveats concerning the approximate methods used and the limited statistics achieved, the chosen model and methodology have managed to capture the physics behind the photoinduced processes inside the protein. The next question is obvious: is it possible to discern from our simulations what is behind each of these dynamical regimes?
3.3 An ultrafast reaction in slow motion
We start off by focusing on the main character of the photochemical process in GFP S65T/H148D: the proton. To analyze globally the position of the proton and how it changes over time, we define the following coordinate24 (for atom labels, see Fig. 3): | (5) |
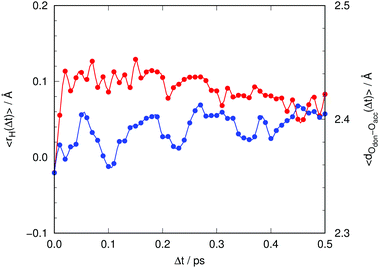 | ||
| Fig. 10 Time evolution of the average signed distance of the proton to the center of the donor–acceptor line (eqn (5), red) and of the donor–acceptor distance between chromophore and Asp148 (blue). | ||
We clarify that 〈rH(t)〉 corresponds to the classical average position of the proton along the donor–acceptor line, which is approximate as the proton has a non-negligible de Broglie wavelength and should be described as a quantum particle. However, as the potential energy profiles are lacking any barriers,26 one does not expect any significant interference effects that could affect the expected position of the proton. Initially, at Δt = 0, the value of 〈rH(t)〉 is slightly negative, meaning that the proton is closer to the oxygen atom of the chromophore. During approximately the first 20 fs, 〈rH(t)〉 leaps from slightly negative to positive values. Thereafter it decreases slowly. This indicates that as time goes by the proton gets closer to the chromophore or, more likely, that the distance between chromophore and Asp148 increases. The latter indeed happens, as can be seen in Fig. 10 (blue line), with a rate of increase of approximately 0.1 Å ps−1.
So far we have detected a sudden impulsive motion of the proton towards the acceptor despite having a potential energy profile for proton transfer that is essentially flat,26 and a substantially slower motion separating the donor and acceptor atoms that starts to take place thereafter. A similar situation was encountered with the I* species of GFP, which is formed over several picoseconds right after photoexcitation, again in spite of the fact that the potential energy surface for proton transfer between donor and acceptor atoms in the I* state was computed to be very flat.23,24 The reaction occurs only because motion along some heavy-atom coordinate made the process irreversible and stabilized the product structure. As mentioned in our previous work, this might be the norm rather than the exception in fluorescent proteins.
As reported elsewhere,26 these motions that get started after the proton has undergone the sudden impulsive motion serve the purpose, precisely, to bring about isoergic, or even exoergic, potential energy profiles for the motion of the proton, thereby stabilizing the product of the proton transfer. Naturally, as the Tyr145 stabilizes the negative charge on the chromophore (anionic after losing the proton), and the evolution of water molecules around Asp148 takes place, the interaction between Asp148 and the chromophore becomes less important, which ends up facilitating motions that increase the distance between them. Thus, it is the proton transfer which triggers these changes and not the other way around.
The motion of the proton to the product region causes the electronic wavefunction of the chromophore to “collapse” to the anionic state, which can be detected because it has a smaller excitation energy. Hence, the displacement of the proton is the main cause behind the sudden shift of the fluorescence band in the ultrafast regime before 50 fs.
3.4 Vibrational relaxation
What atomic motions are behind the slower process? We have already seen that Asp148 starts moving away from the chromophore basically from the beginning. It has been suggested that this slower process in the picosecond range has something to do with vibrational relaxation, though without identifying the part of the system that is affected.19 We believe that the distance Asp148–chromophore plays a crucial role in this regard; scrutiny of the surroundings of the chromophore might indicate what kind of other motions are activated after the proton transfer.Fig. 11 displays the time evolution of the average values of angular parameters that monitor the coplanarity of the chromophore: τ is the dihedral C8C6C4C2, and ϕ is the dihedral C10C8C6C4. Also shown is the dihedral O16O15C11C12, φ, which measures the relative planarity of the Tyr66 and Asp148 residues. As Asp148 and the chromophore move away from each other, the Asp148 carboxylate slightly changes its orientation such that it gets closer to coplanarity with the phenolic ring of the chromophore. However, the most important changes concern the internal coplanarity within the chromophore. Coplanarity of the two chromophore moieties is known to be less preserved in GFP S65T/H148D than in wtGFP, and this has been suggested to lie behind the notably smaller quantum yield of fluorescence.16 It is usual to quantify this coplanarity through the values of the two dihedral angles defined above, namely ϕ and τ. At Δt = 0 both angles start with an average value close to planarity, 〈ϕ〉 = 184.5 and 〈τ〉 = 185.8. As time progresses, 〈ϕ〉 drops slightly under 180 and then remains approximately constant. A more pronounced change occurs with τ, as its value increases steadily until reaching around 220°. This marked out-of-plane motion might be surprising at first sight. However, previous studies already found that the excited state of GFP chromophore model compounds adopts a twisted conformation that will facilitate photoisomerization.71 Analysis of the excitation in terms of the involved MOs shows that the LUMO has a nodal plane between atoms C6 and C4, which is not present in the HOMO (see Fig. S4 in the ESI†).25 Hence, the HOMO–LUMO excitation breaks, or weakens significantly, the double bond between these atoms. As a consequence rotation around the C6C4 bond becomes much easier than in the ground state. In energetic terms, this motion de-stabilizes the ground state (where it involves the breaking of a double bond) more than it does the excited electronic state (where this bond is of single nature). Hence, its overall effect is to reduce the excitation energy.
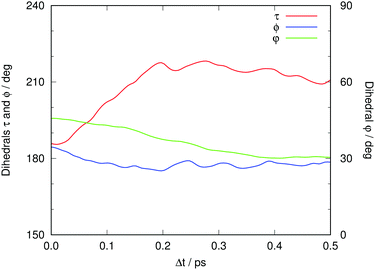 | ||
| Fig. 11 Time evolution of the average values of τ (dihedral C8C6C4C2, red), ϕ (dihedral C10C8C6C4, blue) and φ (dihedral O16O15C11C12, green). See Fig. 3 for atom labeling. | ||
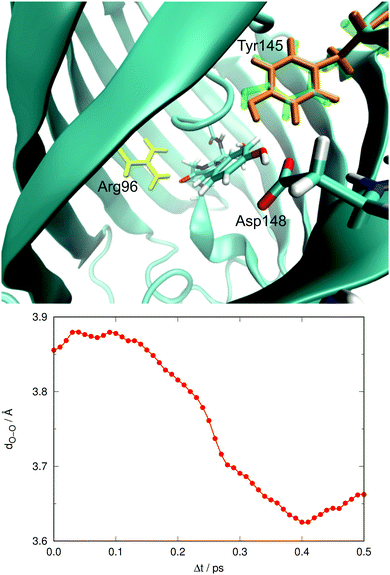
In our previous work we also discussed the possible effect of a nearby residue, Tyr145, which can be oriented such that a hydrogen bond between the oxygens of Tyr66 and Tyr145 may be established.26 In our ground-state QM/MM MD study we found that Tyr145 can adopt two different conformations. One of them had an O–O distance close to 3.0 Å, indicative of a well-established hydrogen bond, whereas the other one was less well defined and had O–O distances of about 4.5 Å. Fig. 12 exemplifies the extent of orientational changes undergone by Tyr145 during the excited-state MD runs. Also shown in Fig. 12 is the average value of this O–O distance over all trajectories in the electronically excited state at each time gap, 〈dO–O〉.
At Δt = 0 the distribution yields an average O–O distance of 3.86 Å, which of course matches the bimodal distribution in the ground state. After photoexcitation not much seems to happen initially. After 0.1 ps, 〈dO–O〉 shows a sudden tendency to decrease notably during the next 0.3 ps, overall by about 0.3 Å. This motion of Tyr145 preferentially stabilizes the electronically excited state, in which Tyr66 is already anionic. The effect on the excitation energy is thus to make it smaller. Alternatively, the decrease of 〈dO–O〉 may also reflect different survival rates of the different structures, i.e. that structures with Tyr145 farther away from the chromophore could decay faster. We cannot rule out this possibility but consider it unlikely.
Summarizing: right after photoexcitation, there is a very fast motion of the proton that leaves the chromophore and gets close to Asp148, which causes the change of the chromophore to its anionic state. This triggers other motions: first, the new electronic structure in the photoactive state facilitates rotation around the C6C4 double bond, and second, the new local negative charge on (mainly) the oxygen of the phenolic group of the chromophore causes Tyr145 to tilt and get closer to the phenolate in the chromophore. All these motions happen in the range of several hundreds of femtoseconds in our simulations. All of them alter the emission energy making it smaller: either because they preferentially stabilize the photoactive over the ground electronic state (in case of the approach of Tyr145 to Tyr66) or because they strongly destabilize the ground state relative to the photoactive state (in case of the C6C4 torsion). These effects give rise to the observed slight decrease of the emission energy in the fs-spectra.
3.5 Efficiency of non-radiative relaxation channels
So far we have reproduced the time-resolved fluorescence spectra and identified the atomistic foundations of the dynamical processes that manifest themselves in the different time scales of the fluorescence. We have also characterized the CIs that mediate the non-radiative deactivation of the photoexcited state to the ground electronic state. The photoinduced processes can be described using a set of four generic coordinates: (1) the proton position is linked to the fast dynamical regime in the range of tens of femtoseconds, (2) a complex coordinate including the donor–acceptor distance, but also other heavy-atom coordinates like the Tyr145–Tyr66 distance, is linked to the slower dynamical regime with time constant over 1 ps, and (3) the transit through the CIs is associated either with the torsion of the C6C4 bond (T) or the pyramidalization at C2 (P).Even though the computed time evolution of the fluorescence explains the experimental data well at short times, it is evident that our QM/MM simulations become unrealistic at longer times. There are many non-adiabatic hops to the ground state starting at Δt ∼ 0.25 ps (see Fig. 6), and the fractional population of the excited state falls off quickly thereafter. Almost all trajectories have returned to the ground state within 1.5 ps of photoexcitation. This disagrees with the experimentally observed quantum yield of 0.21 of this mutant,16 which is much larger than the tiny value that would be expected from our QM/MM simulations. Obviously, the non-adiabatic decay is predicted way too efficient. This implies that our system approaches the CI region much too fast. Once a trajectory in the excited state makes it to the vicinity of a CI the likelihood of undergoing a non-adiabatic transition is large; the funnel acts as an attractor that will make it difficult for the trajectory to escape the “cone” again. The only plausible way to rationalize the experimentally observed non-negligible quantum yield is to assume that there is actually some barrier between the Franck–Condon region and the CI, which is missing in our QM/MM MD simulations.
To test whether this is the case we performed relaxed QM/MM potential energy scans in the excited state along the reaction coordinate that leads to the T-type CI, namely the H7C6C4N5 dihedral angle (θ). The scans were done using OM2/MRCI and TDDFT/CAM-B3LYP for the QM region. Even though DFT is a single-reference method and thus cannot correctly describe CIs, it has been often used successfully as a means to locate them approximately in theoretical studies.72–77 The computed energy profiles are shown in the ESI.†
The QM(OM2/MRCI)/MM method predicts a monotonous decrease of the potential energy upon torsion in the photoactive S1 state. This is why most trajectories of our simulations reach the CI region quickly and then quickly hop to the ground state. By contrast, the potential energy profiles of the S1 state at the QM(TDDFT/CAM-B3LYP)/MM level show either a potential energy barrier or a slightly uphill path towards the CI. These kinds of profile will slow down the non-adiabatic relaxation and increase the excited-state lifetime (consistent with the experimentally observed non-negligible quantum yield). We note in this context that a recent ab initio QM/MM study on the non-radiative relaxation pathway in GFP S65T/H148D also reported a small barrier of 3.2 kcal mol−1 on the route towards the T-type CI.27
For improved accuracy, it would thus be desirable to perform first-principles QM/MM MD simulations of the GFP S65T/H148D protein in the excited state, which is however not yet practical for a system of this size. The affordable semi-empirical QM(OM2/MRCI)/MM MD simulations are flawed on longer time scales because they do not encounter a barrier on the torsional route to the main CI and thus yield a much too fast non-adiabatic decay to the ground state. However, this shortcoming is not expected to affect the short-time dynamics (up to 100 fs after photoexcitation) because the initial barrierless proton transfer and vibrational relaxation are described by coordinates that are distinct from those that regulate the transit through the CIs. Hence, we still believe that our simulations provide a realistic scenario for the short-time dynamics that gives rise to characteristic signatures in the time-resolved fluorescence spectra.
3.6 The hidden fate of species A*
A final aspect deserves to be addressed in connection with the role of the non-adiabatic relaxation channels found.Fig. 13 visualizes the classical position of the proton (eqn (5)) at all hopping points. Interestingly, about 29% of the non-radiative transitions occur when the proton is closer to the chromophore, that is, when the chromophore is neutral (rH < 0 in Fig. 13). As neutral GFP chromophores are known to have excitation energies that are A-like, analysis of the excitation energies at the time of transfer to S0 could indicate whether depopulation is taking place while in the A* form.18 The transfer time is computed to be 20 fs based on the average value of rH, 〈r〉. However, at each instant in time there are trajectories of the swarm where the proton is found on the reactant side.
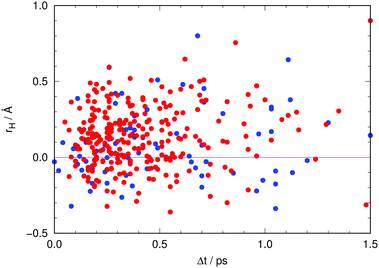 | ||
| Fig. 13 Position of the proton (using eqn (5)) at each hop as a function of the time lapse since photoexcitation. Red dots indicate transit through the CI involving hydrogen out-of-plane motion (type T in Fig. 4) while blue dots indicate transit through the CI involving pyramidalization at C2 (type P in Fig. 4). | ||
In Fig. S6 of the ESI† the individual emission energies for each snapshot of all trajectories are related to the classical position of the proton, rH, during the initial stages of the evolution in the photoexcited state. The overall decrease of ΔE seems to correlate with the motion of the proton as it moves from reactants (rH < 0) to products (rH > 0), although it should be kept in mind, of course, that the emission energy also depends on other parameters, such as the donor–acceptor distance and the arrangement of nearby residues.
Hence, trajectories that undergo non-radiative decay to the ground state whilst in the “reactant” configuration decrease the number of systems that emit at high energies, and will not reach the region of “product” configurations that would emit at low energies. This is in qualitative agreement with the findings of Shi et al.18 with regard to the non-concomitant decrease of A* fluorescence and rise of I* fluorescence. They carried out experiments at room temperature and at 140 K, finding that the rise of fluorescence of I* was not affected by temperature within the experimental time resolution. By contrast, the non-radiative pathway that depopulates A* was found to slow down at 140 K, which indicates that this process, whatever it might be, has to overcome a barrier. Such a barrier is encountered on the route to our T-type CI (see Fig. S8 in the ESI,† and ref. 27), which suggests that this pathway may be responsible for the non-radiative process identified by Shi et al.18
4 Conclusions
We report in this work a theoretical study of the time evolution of the fluorescence spectrum of GFP S65T/H148D, a protein that shows an ultrafast rise of fluorescence at 510 nm when irradiated at 415 nm (insensitive to H/D isotope substitution). The absorption at 415 nm is associated with a protonated chromophore, whereas emission at 510 nm is caused by an ionized chromophore. Previous theoretical work by the authors gave essentially isoergic potential energy profiles for proton transfer and established that, contrary to expectation, the decrease of pKa upon photoexcitation of the chromophore is not extreme.26 Quantum dynamics simulations showed that the proton enters a resonant state after photoexcitation on such potential energy profiles.26The present simulations reproduce the ultrafast shift to lower energies of the excitation energy and the existence of two dynamical regimes, as well as their qualitative time scales. An ultrafast initial phase responsible for most of the red shift in the fluorescence spectrum can be directly linked to the barrierless motion of the proton from the photoexcited chromophore to Asp148. This phase is essentially complete at times of 50 fs or less, which matches the experimental observations made with the best temporal resolution to date.19 The transfer of the proton unleashes a series of structural changes that are slower, happening at times above 0.1 ps. Geometric analysis of the ensemble of trajectories reveals that one major change is the steady increase of the O–O distance between chromophore and Asp148. Also, photoexcitation destroys the double bond between the imidazolinone ring and the methine carbon in the chromophore, which causes a strong out-of-plane distortion in the excited state. Moreover, the nearby Tyr145 residue is brought closer to the chromophore, which is important to achieve an isoergic potential energy profile. Thus several slow motions (compared to proton transfer) have been identified as likely candidates for the second dynamical process in the picosecond range. In this way a coherent picture of the atomic motions, their sequence and driving forces arises that is consistent with the time-resolved experimental data on this system.
The non-adiabatic molecular dynamics protocol followed has revealed that two different non-radiative pathways are present in the neighborhood of the Franck–Condon region. One of them is reached via a torsional motion of the methine hydrogen of the chromophore. It is in fact analogous to the conical intersection reported previously for the same system in the product region of the proton transfer,27 but occurs already in the reactant region: at the hopping points, the proton is still closer to the chromophore and the donor–acceptor distance is mostly very short and in line with the equilibrium value. The other conical intersection involves the pyramidalization of the ketone carbon in the imidazolinone ring of the chromophore and has not been reported before. Both conical intersections can be reached from the Franck–Condon region, and their presence may explain the so-far unexplained differences between the time-resolved fluorescence decay of the A* species and the fluorescence rise of the I* species. TDDFT calculations show that there is an intervening potential energy barrier between the Franck–Condon region and one of the conical intersections, which helps to understand the reported slow-down of this non-radiative relaxation channel when the temperature is lowered.18
Conflicts of interest
There are no conflicts to declare.Acknowledgements
This work was supported by the Spanish “Ministerio de Economía y Competitividad” (project CTQ2014-53144-P) and “Ministerio de Economía, Industria y Competitividad” (project CTQ2017-83745-P). Use of computational facilities at the “Consorci de Serveis Universitaris de Catalunya (CSUC)” is gratefully acknowledged. This work was also supported by an ERC Advanced Grant (OMSQC to WT). Fig. 2, 4 and 12 have been prepared with the VMD visualization software78 using the Tachyon raytracing library.79 Open Access funding provided by the Max Planck Society.References
- M. Zimmer, Chem. Rev., 2002, 102, 759–781 CrossRef CAS PubMed.
- S. R. Meech, Chem. Soc. Rev., 2009, 38, 2922–2934 RSC.
- J. J. van Thor, Chem. Soc. Rev., 2009, 38, 2935–2950 RSC.
- S. J. Remington, Protein Sci., 2011, 20, 1509–1519 CrossRef CAS PubMed.
- M. Z. Lin, M. R. McKeown, H.-L. Ng, T. A. Aguilera, N. C. Shaner, R. E. Campbell, S. R. Adams, L. A. Gross, W. Ma, T. Alber and R. Y. Tsien, Chem. Biol., 2009, 16, 1169–1179 CrossRef CAS PubMed.
- F. V. Subach and V. V. Verkhusha, Chem. Rev., 2012, 112, 4308–4327 CrossRef CAS PubMed.
- B. Wu, K. D. Piatkevich, T. Lionnet, R. H. Singer and V. V. Verkhusha, Curr. Opin. Cell Biol., 2011, 23, 310–317 CrossRef CAS PubMed.
- M. Chattoraj, B. A. King, G. U. Bublitz and S. G. Boxer, Proc. Natl. Acad. Sci. U. S. A., 1996, 93, 8362–8367 CrossRef CAS.
- D. Stoner Ma, A. A. Jaye, P. Matousek, M. Towrie, S. R. Meech and P. J. Tonge, J. Am. Chem. Soc., 2005, 127, 2864–2865 CrossRef CAS PubMed.
- J. J. van Thor, G. Zanetti, K. L. Ronayne and M. Towrie, J. Phys. Chem. B, 2005, 109, 16099–16108 CrossRef CAS PubMed.
- D. Stoner Ma, E. H. Melief, J. Nappa, K. L. Ronayne, P. J. Tonge and S. R. Meech, J. Phys. Chem. B, 2006, 110, 22009–22018 CrossRef CAS PubMed.
- R. M. Wachter, B. A. King, R. Heim, K. Kallio, R. Y. Tsien, S. G. Boxer and S. J. Remington, Biochemistry, 1997, 36, 9759–9765 CrossRef CAS PubMed.
- M. A. Elsliger, R. M. Wachter, G. T. Hanson, K. Kallio and S. J. Remington, Biochemistry, 1999, 38, 5296–5301 CrossRef CAS PubMed.
- M. Kneen, J. Farinas, Y. X. Li and A. S. Verkman, Biophys. J., 1998, 74, 1591–1599 CrossRef CAS PubMed.
- J. Llopis, J. M. McCaffery, A. Miyawaki, M. G. Farquhar and R. Y. Tsien, Proc. Natl. Acad. Sci. U. S. A., 1998, 95, 6803–6808 CrossRef CAS.
- X. Shu, K. Kallio, X. Shi, P. Abbyad, P. Kanchanawong, W. Childs, S. G. Boxer and S. J. Remington, Biochemistry, 2007, 46, 12005–12013 CrossRef CAS PubMed.
- D. Stoner Ma, A. A. Jaye, K. L. Ronayne, J. Nappa, S. R. Meech and P. J. Tonge, J. Am. Chem. Soc., 2008, 130, 1227–1235 CrossRef CAS PubMed.
- X. Shi, P. Abbyad, X. Shu, K. Kallio, P. Kanchanawong, W. Childs, S. J. Remington and S. G. Boxer, Biochemistry, 2007, 46, 12014–12025 CrossRef CAS PubMed.
- M. Kondo, I. A. Heisler, D. Stoner Ma, P. J. Tonge and S. R. Meech, J. Am. Chem. Soc., 2010, 132, 1452–1453 CrossRef CAS PubMed.
- C. Scharnagl and R. A. Raupp Kossmann, J. Phys. Chem. B, 2004, 108, 477–489 CrossRef CAS.
- P. Leiderman, L. Genosar, D. Huppert, X. Shu, S. J. Remington, K. M. Solntsev and L. M. Tolbert, Biochemistry, 2007, 46, 12026–12036 CrossRef CAS PubMed.
- K. B. Bravaya, B. L. Grigorenko, A. V. Nemukhin and A. I. Krylov, Acc. Chem. Res., 2012, 45, 265–275 CrossRef CAS PubMed.
- B. L. Grigorenko, A. V. Nemukhin, I. V. Polyakov, D. I. Morozov and A. I. Krylov, J. Am. Chem. Soc., 2013, 135, 11541–11549 CrossRef CAS PubMed.
- M. Nadal Ferret, R. Gelabert, M. Moreno and J. M. Lluch, Phys. Chem. Chem. Phys., 2015, 17, 30876–30888 RSC.
- P. Armengol, R. Gelabert, M. Moreno and J. M. Lluch, Org. Biomol. Chem., 2014, 12, 9845–9852 CAS.
- P. Armengol, R. Gelabert, M. Moreno and J. M. Lluch, J. Phys. Chem. B, 2015, 119, 2274–2291 CrossRef CAS PubMed.
- Q. Zhang, X. Chen, G. Cui, W. Fang and W. Thiel, Angew. Chem., Int. Ed., 2014, 53, 8649–8653 CrossRef CAS PubMed.
- M. Bergeler, H. Mizuno, E. Fron and J. N. Harvey, J. Phys. Chem. B, 2016, 120, 12454–12465 CrossRef CAS PubMed.
- H. Li, A. D. Robertson and J. H. Jensen, Proteins, 2008, 61, 704–721 CrossRef PubMed.
- D. C. Bas, D. M. Rogers and J. H. Jensen, Proteins, 2008, 73, 765–783 CrossRef CAS PubMed.
- M. H. M. Olsson, C. R. Sondergard, M. Rostkowski and J. H. Jensen, J. Chem. Theory Comput., 2011, 7, 525–537 CrossRef CAS PubMed.
- C. R. Sondergard, M. H. M. Olsson, M. Rostkowski and J. H. Jensen, J. Chem. Theory Comput., 2011, 7, 2284–2295 CrossRef PubMed.
- W. L. Jorgensen, J. Chandrasekhar, J. D. Madura, R. W. Impey and M. L. Klein, J. Chem. Phys., 1983, 79, 926–935 CrossRef CAS.
- D. Bakowies and W. Thiel, J. Phys. Chem., 1996, 100, 10580–10594 CrossRef CAS.
- H. M. Senn and W. Thiel, Angew. Chem., Int. Ed., 2009, 48, 1198–1229 CrossRef CAS PubMed.
- ChemShell, a Computational Chemistry Shell, see http://www.chemshell.org, last accessed on: Tue Mar 27 15:55 2017.
- P. Sherwood, A. H. de Vries, M. F. Guest, G. Schreckenbach, C. R. A. Catlow, S. A. French, A. A. Sokol, S. T. Bromley, W. Thiel, A. J. Turner, S. Billeter, F. Terstegen, S. Thiel, J. Kendrick, S. C. Rogers, J. Casci, M. Watson, F. King, E. Karlsen, M. Sjøvoll, A. Fahmi, A. Schäfer and Ch. Lennartz, THEOCHEM, 2003, 632, 1–28 CrossRef CAS.
- S. Metz, J. Kästner, A. A. Sokol, T. W. Keal and P. Sherwood, WIREs Comput. Mol. Sci., 2014, 4, 101–110 CrossRef CAS.
- M. Scholten, PhD thesis, Universität Düsseldorf, 2003.
- T. Tuttle and W. Thiel, Phys. Chem. Chem. Phys., 2008, 10, 2159–2166 RSC.
- M. Korth and W. Thiel, J. Chem. Theory Comput., 2011, 7, 2929–2936 CrossRef CAS PubMed.
- W. Thiel, WIREs Comput. Mol. Sci., 2014, 4, 145–157 CrossRef CAS.
- P. O. Dral, X. Wu, L. Spörkel, A. Koslowski, W. Weber, R. Steiger, M. Scholten and W. Thiel, J. Chem. Theory Comput., 2016, 12, 1082–1096 CrossRef CAS PubMed.
- P. O. Dral, X. Wu, L. Spörkel, A. Koslowski and W. Thiel, J. Chem. Theory Comput., 2016, 12, 1097–1120 CrossRef CAS PubMed.
- W. Thiel, MNDO99 Program, Version 7.0, Max-Planck-Institut für Kohlenforschung, Mülheim, Germany, 2005 Search PubMed.
- A. D. MacKerell, D. Bashford, M. Bellott, R. L. Dunbrack, J. D. Evanseck, M. J. Field, S. Fischer, J. Gao, H. Guo, S. Ha, D. Joseph McCarthy, L. Kuchnir, K. Kuczera, F. T. K. Lau, C. Mattos, S. Michnick, T. Ngo, D. T. Nguyen, B. Prodhom, W. E. Reiher, B. Roux, M. Schlenkrich, J. C. Smith, R. Stote, J. Straub, M. Watanabe, J. Wiorkiewicz Kuczera, D. Yin and M. Karplus, J. Phys. Chem. B, 1998, 102, 3586–3616 CrossRef CAS PubMed.
- A. D. MacKerell, M. Feig and C. L. Brooks, J. Am. Chem. Soc., 2004, 126, 698–699 CrossRef CAS PubMed.
- W. Smith and T. R. Forester, J. Mol. Graphics, 1996, 14, 136–141 CrossRef CAS PubMed.
- S. R. Billeter, A. J. Turner and W. Thiel, Phys. Chem. Chem. Phys., 2000, 2, 2177–2186 RSC.
- W. Weber and W. Thiel, Theor. Chem. Acc., 2000, 103, 495–506 CrossRef CAS.
- B. Heggen, Z. Lan and W. Thiel, Phys. Chem. Chem. Phys., 2012, 14, 8137–8146 RSC.
- L. Spörkel, G. Cui and W. Thiel, J. Phys. Chem. A, 2013, 117, 4574–4583 CrossRef PubMed.
- L. Spörkel, G. Cui, A. Koslowski and W. Thiel, J. Phys. Chem. A, 2014, 118, 152–157 CrossRef PubMed.
- L. Spörkel, J. Jankowska and W. Thiel, J. Phys. Chem. B, 2015, 119, 2702–2710 CrossRef PubMed.
- Y. Lu, Z. Lan and W. Thiel, Angew. Chem., Int. Ed., 2011, 50, 6864–6867 CrossRef CAS PubMed.
- G. Cui, Z. Lan and W. Thiel, J. Am. Chem. Soc., 2012, 134, 1662–1672 CrossRef CAS PubMed.
- X. Y. Liu, X. P. Chang, S. H. Xia, G. Cui and W. Thiel, J. Chem. Theory Comput., 2016, 12, 753–764 CrossRef CAS PubMed.
- M. R. Silva-Junior and W. Thiel, J. Chem. Theory Comput., 2010, 6, 1546–1564 CrossRef CAS PubMed.
- D. Tuna, Y. Lu, A. Koslowski and W. Thiel, J. Chem. Theory Comput., 2016, 12, 4400–4422 CrossRef CAS PubMed.
- J. C. Tully and R. K. Preston, J. Chem. Phys., 1971, 55, 562–572 CrossRef CAS.
- S. Hammes Schiffer and J. C. Tully, J. Chem. Phys., 1994, 101, 4657–4667 CrossRef CAS.
- E. Fabiano, T. W. Keal and W. Thiel, Chem. Phys., 2008, 349, 334–347 CrossRef CAS.
- J. C. Tully, J. Chem. Phys., 1990, 93, 1061–1071 CrossRef CAS.
- G. Granucci, M. Persico and A. Zoccante, J. Chem. Phys., 2010, 133, 134111 CrossRef PubMed.
- L. Spörkel and W. Thiel, J. Chem. Phys., 2016, 144, 194108 CrossRef PubMed.
- T. Yanai, D. P. Dew and N. C. Handy, Chem. Phys. Lett., 2004, 393, 51–57 CrossRef CAS.
- N. H. List, J. M. Olsen, T. Rocha-Rinza, O. Christiansen and J. Kongsted, Int. J. Quantum Chem., 2012, 112, 789–800 CrossRef CAS.
- M. J. Frisch, G. W. Trucks, H. B. Schlegel, G. E. Scuseria, M. A. Robb, J. R. Cheeseman, G. Scalmani, V. Barone, B. Mennucci, G. A. Petersson, H. Nakatsuji, M. Caricato, X. Li, H. P. Hratchian, A. F. Izmaylov, J. Bloino, G. Zheng, J. L. Sonnenberg, M. Hada, M. Ehara, K. Toyota, R. Fukuda, J. Hasegawa, M. Ishida, T. Nakajima, Y. Honda, O. Kitao, H. Nakai, T. Vreven, J. A. Montgomery, Jr., J. E. Peralta, F. Ogliaro, M. Bearpark, J. J. Heyd, E. Brothers, K. N. Kudin, V. N. Staroverov, R. Kobayashi, J. Normand, K. Raghavachari, A. Rendell, J. C. Burant, S. S. Iyengar, J. Tomasi, M. Cossi, N. Rega, J. M. Millam, M. Klene, J. E. Knox, J. B. Cross, V. Bakken, C. Adamo, J. Jaramillo, R. Gomperts, R. E. Stratmann, O. Yazyev, A. J. Austin, R. Cammi, C. Pomelli, J. W. Ochterski, R. L. Martin, K. Morokuma, V. G. Zakrzewski, G. A. Voth, P. Salvador, J. J. Dannenberg, S. Dapprich, A. D. Daniels, Ö. Farkas, J. B. Foresman, J. V. Ortiz, J. Cioslowski and D. J. Fox, Gaussian 09 Revision C.01, Gaussian Inc., Wallingford CT, 2009 Search PubMed.
- I. N. Levine, Molecular Spectroscopy, John Wiley & Sons, 1975 Search PubMed.
- A. Nikiforov, J. A. Gamez, W. Thiel, M. Huix Rotllant and M. Filatov, J. Chem. Phys., 2014, 141, 124122 CrossRef PubMed.
- W. Weber, V. Helms, J. A. McCammon and P. W. Langhoff, Proc. Natl. Acad. Sci. U. S. A., 1999, 96, 6177–6182 CrossRef CAS.
- B. G. Levine, C. Ko, J. Quenneville and T. J. Martinez, Mol. Phys., 2006, 104, 1039–1051 CrossRef CAS.
- K. Sadeghian and M. Schuetz, J. Am. Chem. Soc., 2007, 129, 4068–4074 CrossRef CAS PubMed.
- U. Werner, R. Mitric, T. Suzuki and V. Bonacic Koutecky, Chem. Phys., 2008, 349, 319–324 CrossRef CAS.
- I. Tavernelli, E. Tapavicza and U. Rothlisberger, J. Chem. Phys., 2009, 130, 124107 CrossRef PubMed.
- J. M. Ortiz Sánchez, R. Gelabert, M. Moreno and J. M. Lluch, ChemPhysChem, 2010, 11, 3696–3703 CrossRef PubMed.
- M. Moreno, J. M. Ortiz Sánchez, R. Gelabert and J. M. Lluch, Phys. Chem. Chem. Phys., 2013, 15, 20236–20246 RSC.
- W. Humphrey, A. Dalke and K. Schulten, J. Mol. Graphics, 1996, 14, 33–38 CrossRef CAS PubMed.
- J. Stone, MSc thesis, Computer Science Department, University of Missouri-Rolla, 1998.
Footnote |
| † Electronic supplementary information (ESI) available: Analysis of time evolution of some geometrical parameters across the swarm of trajectories, plots of the HOMO and LUMO of the chromophore, analysis of the relation between emission energy and proton position, potential energy profiles along paths that link the Franck–Condon region to the T- and P-type CIs. See DOI: 10.1039/c8cp00371h |
| This journal is © the Owner Societies 2018 |

