 Open Access Article
Creative Commons Attribution 3.0 Unported Licence
Absolute and relative-rate measurement of the rate coefficient for reaction of perfluoro ethyl vinyl ether (C2F5OCF![[double bond, length as m-dash]](https://www.rsc.org/images/entities/h2_char_e001.gif) CF2) with OH
CF2) with OH
G.
Srinivasulu
,
A. J. C.
Bunkan
,
D.
Amedro
and
J. N.
Crowley
 *
*
Division of Atmospheric Chemistry, Max-Planck-Institut für Chemie, 55128 Mainz, Germany. E-mail: john.crowley@mpic.de
First published on 19th January 2018
Abstract
The rate coefficient (k1) for the reaction of OH radicals with perfluoro ethyl vinyl ether (PEVE, C2F5OCF![[double bond, length as m-dash]](https://www.rsc.org/images/entities/char_e001.gif) CF2) has been measured as a function of temperature (T = 207–300 K) using the technique of pulsed laser photolysis with detection of OH by laser-induced fluorescence (PLP-LIF) at pressures of 50 or 100 Torr N2 bath gas. In addition, the rate coefficient was measured at 298 K and in one atmosphere of air by the relative-rate technique with loss of PEVE and reference reactant monitored in situ by IR absorption spectroscopy. The rate coefficient has a negative temperature dependence which can be parameterized as: k1(T) = 6.0 × 10⁻¹³
CF2) has been measured as a function of temperature (T = 207–300 K) using the technique of pulsed laser photolysis with detection of OH by laser-induced fluorescence (PLP-LIF) at pressures of 50 or 100 Torr N2 bath gas. In addition, the rate coefficient was measured at 298 K and in one atmosphere of air by the relative-rate technique with loss of PEVE and reference reactant monitored in situ by IR absorption spectroscopy. The rate coefficient has a negative temperature dependence which can be parameterized as: k1(T) = 6.0 × 10⁻¹³![[thin space (1/6-em)]](https://www.rsc.org/images/entities/char_2009.gif) exp[(480 ± 38/T)] cm3 molecule−1 s−1 and a room temperature value of k1 (298 K) = (3.0 ± 0.3) × 10−12 cm3 molecule−1 s−1. Highly accurate rate coefficients from the PLP-LIF experiments were achieved by optical on-line measurements of PEVE and by performing the measurements at two different apparatuses. The large rate coefficient and the temperature dependence indicate that the reaction proceeds via OH addition to the C
exp[(480 ± 38/T)] cm3 molecule−1 s−1 and a room temperature value of k1 (298 K) = (3.0 ± 0.3) × 10−12 cm3 molecule−1 s−1. Highly accurate rate coefficients from the PLP-LIF experiments were achieved by optical on-line measurements of PEVE and by performing the measurements at two different apparatuses. The large rate coefficient and the temperature dependence indicate that the reaction proceeds via OH addition to the C![[double bond, length as m-dash]](https://www.rsc.org/images/entities/char_e001.gif) C double bond, the high pressure limit already being reached at 50 Torr N2. Based on the rate coefficient and average OH levels, the atmospheric lifetime of PEVE was estimated to be a few days.
C double bond, the high pressure limit already being reached at 50 Torr N2. Based on the rate coefficient and average OH levels, the atmospheric lifetime of PEVE was estimated to be a few days.
1 Introduction
Desirable properties such as thermal and chemical resistance have led to the use of fluoropolymers in many industrial processes including the production of plastics, elastomers or membranes1,2 and to their production in large quantities. The most important commercial fluoropolymers are homopolymers based on only three main monomers; tetrafluoroethylene (TFE), vinyl fluoride and vinylidene fluoride.3 In addition, smaller amounts of co-polymers with tailored properties are made with co-monomers like hexafluoropropylene and perfluoro vinyl ethers.Since perfluorinated compounds generally have strong absorption features in the atmospheric infrared window and often have long atmospheric lifetimes, many of them are very potent greenhouse gases.4–6 To evaluate their impact on climate change, accurate assessment of their atmospheric sinks is essential. From a physical chemical perspective, we note that the reaction kinetics of perfluoro substituted organic trace gases can differ greatly from the non-fluorinated analogues. Study of the OH reaction with a fluorinated ethyl vinyl ether (electrophilic addition of OH to the C![[double bond, length as m-dash]](https://www.rsc.org/images/entities/char_e001.gif) C double bond) allows us to analyse the electronic effects caused by the presence of a fluorinated alkyl group separated from the electron rich double bond by the ether linkage.
C double bond) allows us to analyse the electronic effects caused by the presence of a fluorinated alkyl group separated from the electron rich double bond by the ether linkage.
To the best of our knowledge, there are no published studies on the atmospheric fate of perfluoro ethyl vinyl ether (C2F5OCF![[double bond, length as m-dash]](https://www.rsc.org/images/entities/char_e001.gif) CF2, henceforth PEVE) though a few experimental studies on related reactions of perfluoro methyl vinyl ether7–9 and perfluoro propyl vinyl ether10 exist. In this work we have studied the kinetics of the reaction of PEVE with OH radicals (R1) using both the technique of pulsed laser photolysis with detection of OH radicals by laser-induced fluorescence as well as relative-rate measurements using FTIR detection of reactants to derive the rate coefficient, k1.
CF2, henceforth PEVE) though a few experimental studies on related reactions of perfluoro methyl vinyl ether7–9 and perfluoro propyl vinyl ether10 exist. In this work we have studied the kinetics of the reaction of PEVE with OH radicals (R1) using both the technique of pulsed laser photolysis with detection of OH radicals by laser-induced fluorescence as well as relative-rate measurements using FTIR detection of reactants to derive the rate coefficient, k1.
| OH + PEVE → products | (R1) |
2 Experimental methods
Both absolute and relative-rate methods were used to determine the rate coefficient, k1, for the title reaction.2.1 Pulsed laser photolysis, laser-induced fluorescence (PLP-LIF)
Absolute rate coefficients were determined using the pulsed laser photolysis, laser-induced fluorescence technique with two different experimental set-ups (PLP-LIF1 and PLP-LIF2). The one used for most of the measurements (PLP-LIF1), is shown in Fig. 1. This apparatus has been described in detail elsewhere11 and only a brief description will be given here. The quartz reaction cell has a volume of ≈500 cm3 and can be thermostatted to the desired temperature by circulating ethanol through its jacket. The measurements were performed at temperatures between 207 and 300 K at pressures of 50 and 100 Torr N2 and 10 Hz laser repetition rate. The gas flow, regulated using calibrated mass flow controllers (MKS), was chosen to ensure that a fresh gas mixture was available for each laser pulse.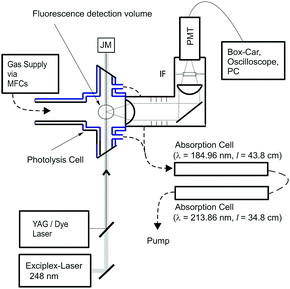 | ||
| Fig. 1 Experimental setup (PLP-LIF1) for the absolute measurements of k1(T). MFC = mass flow controller, JM = joule meter, PMT = photomultiplier tube, IF = interference filter. | ||
When using PLP-LIF1, OH radicals were generated by pulsed photolysis of H2O2 or HNO3 at 248 nm using an exciplex laser (LambdaPhysik 300i).
| H2O2 + hν → 2OH | (R2) |
| HNO3 + hν → OH + NO2 | (R3) |
The concentrations of H2O2 (1–2 × 10¹⁴ molecule cm−3) and HNO3 (4–6 × 10¹⁴ molecule cm−3) were measured by on-line optical absorption at 213.86 nm and 184.95 nm, respectively using low pressure Zn and Hg lamps as light sources. By analogy to PPVE,10 PEVE does not absorb significantly at 213.86 nm. Laser fluences of 10–20 mJ cm−2 per pulse resulted in OH radical concentrations of (1–2) × 1011 molecule cm−3. OH was monitored in real time via its laser-induced fluorescence after exciting the A2Σ(v = 1) ← X2Π(v = 0), Q11(1) transition at ≈282 nm using a frequency-doubled, YAG-pumped Dye-Laser (Quantel Brilliant B plus Lambda-Physik ScanMate II). OH fluorescence was detected using a photomultiplier screened with a 310 nm interference filter. The photomultiplier signal was accumulated using a box-car integrator (Stanford Research Systems, SR 250).
The other absolute measurements were performed on a similar apparatus (PLP-LIF2) in our laboratory,12 which is equipped for both LIF and transient absorption spectroscopy detection schemes. The LIF detection of OH was similar to that described above, whereas OH radicals were generated from H2O2 in (R2) using the pulsed, 266 nm emission of a frequency quadrupled Nd:YAG laser (Quantel Brilliant B).
When H2O2 was used as OH precursor, the concentration of PEVE was measured in both experimental setups by on-line optical absorption at 184.95 nm using the cross-section determined in this study. Optically derived concentrations of PEVE agreed to within ≈10% with those calculated from its mixing ratio in the storage bulb and the partial flow and pressure.
Optical measurements of PEVE were not possible when using HNO3 as OH precursor owing to very large optical extinction due to HNO3 absorption at this wavelength. Instead, PEVE concentrations were calculated from partial flows and the total pressure and cross calibrated against optical measurements in the absence of HNO3.
2.2 Relative-rate measurements
The rate coefficient for the reaction of PEVE with OH radicals was measured in a 44 l cylindrical quartz reaction chamber equipped with White-type multi-pass optics providing a 43.7 m optical path length for infrared absorption spectroscopy.13 The reactor was operated at 298 K and 1 bar total pressure. Six, external, radially mounted, UV photolysis lamps (30 W, emitting predominantly at 253.65 nm) provided a homogeneous light flux within the reactor for radical generation which was initiated by the photolysis of ozone in a large excess of hydrogen:| O3 + hν → O(1D) + O2 | (R4) |
| O(1D) + H2 → OH + H | (R5) |
| H + O2 + M → HO2 + M | (R6) |
| H + O3 → OH + O2 | (R7) |
| HO2 + O3 → OH + 2O2 | (R8) |
2.3 Chemicals
N2 (Westfalen 99.999%), H2 (Westfalen 99.999%), synthetic air (Westfalen), propane (Linde, 99.95%) and PEVE (Merck, 99%) were used as supplied without further purification. H2O2 (AppliChem, 50 wt%) was concentrated to >90 wt% by vacuum distillation. Anhydrous nitric acid was prepared by mixing KNO3 (Sigma Aldrich, 99%) and H2SO4 (Roth, 98%), and condensing HNO3 vapour into a liquid nitrogen trap. To prevent decomposition the nitric acid sample was stored at −17 °C between the measurements. O3 was generated by photodissociation of O2, achieved by passing air over a low pressure Hg-lamp emitting at 184.95 nm.3 Results
3.1 Absorption cross-section of PEVE at 184.95 nm
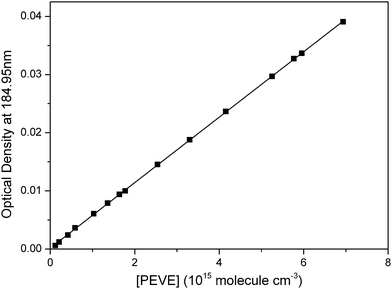
To accurately determine the concentration of PEVE in the PLP-LIF measurements, the cross-section at 184.95 nm was required. The optical densities (OD) measured at various pressures (1.67–107.0 Torr) of accurately diluted mixtures of PEVE in N2 are shown in Fig. 2. The absorption cross-section, obtained by dividing the slope of a plot of OD vs. [PEVE] by the optical path length, yielded σ184.95![[thin space (1/6-em)]](https://www.rsc.org/images/entities/char_2009.gif) nm = (5.61 ± 0.02) × 10−18 cm2 molecule−1 where the errors are 2σ statistical only. The total uncertainty is estimated to be 5% to give a final value of (5.61 ± 0.28) × 10−18 cm2 molecule−1 which is very close to that previously measured for perfluoro propyl vinyl ether.10 Experiments were conducted using several different sample mixtures to check for systematic errors. The cross-sections obtained were identical within the precision of the measurement.
nm = (5.61 ± 0.02) × 10−18 cm2 molecule−1 where the errors are 2σ statistical only. The total uncertainty is estimated to be 5% to give a final value of (5.61 ± 0.28) × 10−18 cm2 molecule−1 which is very close to that previously measured for perfluoro propyl vinyl ether.10 Experiments were conducted using several different sample mixtures to check for systematic errors. The cross-sections obtained were identical within the precision of the measurement.
3.2 Absolute rate coefficients (207–300 K)
In the PLP-LIF1 and PLP-LIF2 set-ups, the rate coefficient for the reaction of PEVE with OH radicals was measured under pseudo-first order conditions with [PEVE] ≫ [OH]0. The OH radical time profiles are then given by[OH]t = [OH]0![[thin space (1/6-em)]](https://www.rsc.org/images/entities/char_2009.gif) exp(−[k1[PEVE]+ kd]t) exp(−[k1[PEVE]+ kd]t) | (i) |
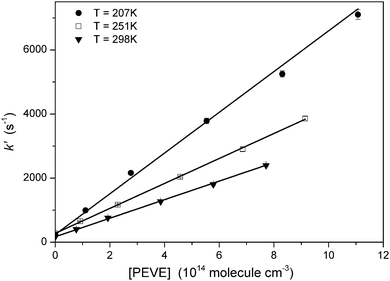
The OH-LIF time profiles were fitted to eqn (i) and example profiles from measurements at 298 K obtained using PLP-LIF1 are shown in Fig. 3. Each measured OH-LIF time profile is the average of 20–25 measurements and was mono-exponential over at least two orders of magnitude. Rate coefficients for the reaction of OH with PEVE were obtained by linear fitting of the pseudo-first order rate coefficients as a function of [PEVE], as shown in Fig. 4. The rate coefficients and the experimental conditions used (temperature, pressure and OH-precursor) are summarised in Table 1.
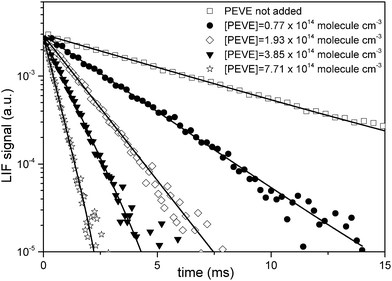 | ||
| Fig. 3 OH decays in the presence of various concentrations of PEVE at p = 50 Torr and T = 298 K. HNO3 photolysis at 248 nm was used as OH source. | ||
| Setup | Temp. (K) | OH precursor | Pressure (Torr) | k 1(T)a (10−12 cm3 molecule−1 s−1) |
|---|---|---|---|---|
| a Uncertainty in k1 is 2σ statistical only. | ||||
| PLP-LIF1 | 207 | HNO3 | 50 | 6.35 ± 0.30 |
| PLP-LIF1 | 225 | HNO3 | 50 | 5.32 ± 0.31 |
| PLP-LIF1 | 233 | HNO3 | 50 | 4.59 ± 0.05 |
| PLP-LIF1 | 251 | HNO3 | 50 | 3.90 ± 0.07 |
| PLP-LIF1 | 260 | H2O2 | 50 | 3.85 ± 0.20 |
| PLP-LIF1 | 268 | H2O2 | 50 | 3.49 ± 0.12 |
| PLP-LIF1 | 270 | HNO3 | 50 | 3.39 ± 0.08 |
| PLP-LIF1 | 272 | H2O2 | 100 | 3.60 ± 0.12 |
| PLP-LIF1 | 280 | H2O2 | 100 | 3.24 ± 0.09 |
| PLP-LIF1 | 281 | H2O2 | 50 | 3.22 ± 0.12 |
| PLP-LIF1 | 299 | HNO3 | 50 | 2.90 ± 0.07 |
| PLP-LIF1 | 299 | H2O2 | 50 | 3.04 ± 0.05 |
| PLP-LIF1 | 298 | H2O2 | 100 | 3.03 ± 0.03 |
| PLP-LIF2 | 299 | H2O2 | 50 | 3.02 ± 0.04 |
| PLP-LIF2 | 300 | H2O2 | 50 | 2.95 ± 0.15 |
| PLP-LIF2 | 300 | H2O2 | 50 | 2.96 ± 0.14 |
| PLP-LIF2 | 300 | H2O2 | 50 | 2.70 ± 0.14 |
| PLP-LIF2 | 300 | H2O2 | 100 | 2.75 ± 0.04 |
Values of k1 obtained with the two experimental setups and using different OH precursors show no significant difference and no dependence on pressure between 50 and 100 Torr N2. The rate coefficient does however show a significant, negative temperature dependence.
3.3 Relative rate coefficients
In the relative-rate experiments, the loss of PEVE was measured relative to that of propane. Propane was chosen as a reference because it does not react with other compounds in the reaction mixture, does not stick to surfaces and it has a well-established rate coefficient. In the absence of loss processes other than reaction with OH, the depletion factors, ln![[thin space (1/6-em)]](https://www.rsc.org/images/entities/char_2009.gif) (initial concentration/concentration after time t), for reactant and reference are described by:
(initial concentration/concentration after time t), for reactant and reference are described by: | (ii) |
| PEVE + OH → products | (R1) |
| C3H8 + OH → C3H7 + H2O | (R9) |
The initial concentration ranges used for PEVE and propane were (1.0–3.3) × 1013 molecule cm−3 and (1.0–4.0) × 1014 molecule cm−3, respectively. A typical experiment lasted around one hour, with the photolysis lamps switched on for 5–10 periods of 10–300 s duration for each experiment. The intermittent acquisition of FTIR spectra (64 scans at 0.5 cm−1 resolution) took ≈2 min. No significant loss of either PEVE or propane on these time scales was observed in the reaction mixtures including O3 and H2 in the dark.
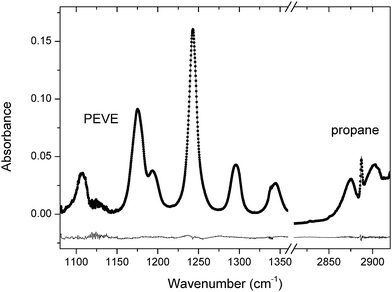
The time dependent depletion factors for PEVE and propane were obtained by least squares fitting to a reference spectrum in the range 1080–1360 cm−1 for PEVE and 2810–2920 cm−1 for propane. Absorption by products was accounted for by including qualitative reference spectra of the assumed products, CF2O, (FCO)2 and C2F5OCFO in a spectral fitting procedure using DOASIS software.14 An example spectrum with fit and residuals is shown in Fig. 5.
Assuming that the photo-oxidation mechanism for PEVE is similar to those of PMVE and PPVE, perfluoro methoxy radicals (CF3O) are expected to be formed in our experiments. These are known to react with hydrocarbons15 and may, in principle, influence our measurements. To assess the potential systematic bias due to reactions of the CF3O radical, as well as possible interferences from O(1D) reactions with PEVE or propane the concentration of H2, a scavenger of both CF3O and O(1D), was varied by an order of magnitude. As illustrated in Fig. 6 and Table 2, there was no discernible impact on the relative decay rate of PEVE and propane and we conclude that any bias is too small to be significant. In support of this conclusion, numerical simulations16 were carried out which used a literature rate coefficient for the reaction of CF3O with propane and one for CF3O + H2 which was taken to be the same as OH + H2 (6.7 × 10⁻¹⁵ cm3 molecule−1 s−1 at 298 K).17 The rate coefficient for CF3O + H2 is actually likely to be larger as the CF3O radical is more reactive than OH radicals towards hydrocarbons.15 The simulations revealed that the reaction of perfluoro methoxy radicals with propane accounts for only 2% of the total propane loss even at the lowest H2 concentrations, which is in accord with our observations. A total of four relative-rate experiments were performed under different experimental conditions, which are summarised in Table 2 and Fig. 6. The values of k1/k9 from the single experiments agree within 10% but we may discern a weak, barely significant positive dependence of the relative rate coefficient on the O3 concentration. i.e. k1/k9 changes (by ≈ 9%) from 2.604 ± 0.032 to 2.847 ± 0.042 going from the lowest to highest ozone concentration used. Potential explanations for this would be reaction of either O3 or O(3P) with PEVE, whereby O(3P) is formed in the collisional quenching of O(1D) (formed in (R5)) with bath gas. Numerical simulations revealed that the ratio of O(3P)/OH concentrations varied from ≈0.01 to 0.1 between experiments, but this was not accompanied by a significant change in the relative rate constant. We also note that the dark loss of PEVE in the presence of O3 was too small to explain this effect. We have no robust explanation of this weak trend and increase the errors on the rate coefficient obtained by the relative-rate method to take this into account.
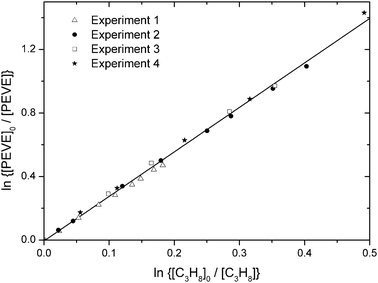 | ||
| Fig. 6 Fractional loss of PEVE and propane in the presence of OH radicals from four individual experiments in 750 Torr air diluent. The conditions for each experiment are listed in Table 2. | ||
| Expt. no. | P (Torr) | [PEVE]0a | [C3H8]0a | [O3]0a | [H2]0b | [OH]0c | k 1/k9d |
|---|---|---|---|---|---|---|---|
| a The initial concentrations of PEVE, C3H8 and O3 (units of 1013 molecule cm−3) were determined from the IR spectra. b The H2 concentration (units of 1017 molecule cm−3) was derived from pressure measurements. c The OH concentration (units of 108 molecule cm−3) from the initial decay of PEVE. d Uncertainty is 2σ statistical only. | |||||||
| 1 | 750 | 3.3 | 39.8 | 22.1 | 0.36 | 3.22 | 2.604 ± 0.032 |
| 2 | 750 | 2.7 | 22.0 | 36.3 | 0.29 | 6.78 | 2.713 ± 0.030 |
| 3 | 750 | 1.6 | 12.7 | 58.1 | 1.7 | 1.55 | 2.752 ± 0.108 |
| 4 | 750 | 1.0 | 10.1 | 103.8 | 0.13 | 1.80 | 2.847 ± 0.042 |
A linear least squares fit to all data (solid line in Fig. 6) gives k1/k9 = 2.802 ± 0.061 (2σ). From this k1 can be determined using an evaluated literature value of k9 = (1.1 ± 0.08) × 10−12 cm3 molecule−1 s−1![[thin space (1/6-em)]](https://www.rsc.org/images/entities/char_2009.gif) 18 to give k1 = (3.1 ± 0.35) × 10−12 cm3 molecule−1 s−1 at 298 K and 1 bar total pressure of air, where the uncertainty contains both statistical and systematic errors originating from the uncertainty (7%) in the literature value for k9 and also the potential bias (<10%) related to the presence of O3.
18 to give k1 = (3.1 ± 0.35) × 10−12 cm3 molecule−1 s−1 at 298 K and 1 bar total pressure of air, where the uncertainty contains both statistical and systematic errors originating from the uncertainty (7%) in the literature value for k9 and also the potential bias (<10%) related to the presence of O3.
4 Discussion and literature comparison
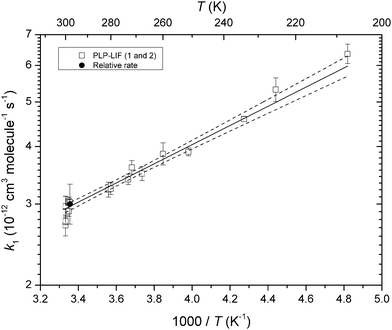
The complete dataset, including data obtained using two different experimental setups for determination of the absolute rate coefficient and also the relative rate study is summarised in Fig. 7 as an Arrhenius plot. The room temperature (298 ± 2 K) rate coefficients obtained are k1 = (2.97 ± 0.30) cm3 molecule−1 s−1 (PLP-LIF1, 50 Torr N2), k1 = (2.90 ± 0.29) cm3 molecule−1 s−1 (PLP-LIF2, 50–100 Torr N2) and k1 = (3.1 ± 0.35) cm3 molecule−1 s−1 (relative rate, 750 Torr air). The uncertainties reported for the absolute rate coefficients are dominated by estimated uncertainty in the PEVE cross-section.The three results are thus in very good agreement, confirming that k1 is independent of bath gas identity (N2 or air) or pressure between 50 and 750 Torr. Combining all three sets of data at room temperature we derive k1(298 K) = (3.0 ± 0.3) × 10−12 cm3 molecule−1 s−1 where the uncertainty is dominated by potential systematic errors in both absolute and relative-rate experiments.
The temperature dependent data obtained using the PLP-LIF1 set-up can be described by an Arrhenius expression: k1 (207–300 K) = (5.9 ± 0.8) × 10−13 exp[(480 ± 38)/T] cm3 molecule−1 s−1, which was derived by instrument-weighted, least-squares fitting to the data displayed in Fig. 7. The negative temperature dependence stems from the formation of an association complex as described for other fluorinated, vinyl ethers.10,23
The quoted errors are 2σ (statistical only). We adopt the temperature dependence (480/T) and modify the pre-exponential factor slightly to give the average room temperature rate coefficient from all experiments and obtain: k1(200–300 K) = 6.0 × 10⁻¹³![[thin space (1/6-em)]](https://www.rsc.org/images/entities/char_2009.gif) exp(480/T) for use in calculation of the rate coefficient at any temperature in the range listed, where the uncertainty will be 10%, independent of temperature.
exp(480/T) for use in calculation of the rate coefficient at any temperature in the range listed, where the uncertainty will be 10%, independent of temperature.
In the following section, we compare our results with previous literature determinations of rate coefficients for the reactions of OH with perfluoro methyl vinyl ether (PMVE, CF3OCF![[double bond, length as m-dash]](https://www.rsc.org/images/entities/char_e001.gif) CF2) and perfluoro propyl vinyl ether (PPVE, C3F7OCF
CF2) and perfluoro propyl vinyl ether (PPVE, C3F7OCF![[double bond, length as m-dash]](https://www.rsc.org/images/entities/char_e001.gif) CF2) which differ from PEVE only in the length of the alkyl chain on the opposite side of the ether linkage to the double bond (CF3versus C2F5versus C3F7).
CF2) which differ from PEVE only in the length of the alkyl chain on the opposite side of the ether linkage to the double bond (CF3versus C2F5versus C3F7).
Table 3 lists literature values for room temperature rate coefficients and Arrhenius parameters for the reactions of OH with PMVE, PEVE and PPVE. Note that Mashino et al.8 measured the rate coefficient for PMVE with OH radicals relative to ethene and ethyne at 296 K in 700 Torr air, and they report a value of (2.6 ± 0.3) × 10−12 cm3 molecule−1s−1. By using their relative rate constants and the most recent IUPAC recommendations18 for the ethene (7.8 × 10⁻¹² cm3 molecule−1s−1) and ethyne (7.5 × 10⁻¹² cm3 molecule−1 s−1) reference reactions we recalculate this to be (2.2 ± 0.3) × 10−12 cm3 molecule−1 s−1.
| k (298 K)a | A factorb | E a | Ref. | |
|---|---|---|---|---|
| a Units of 10−12 cm3 molecule−1 s−1. b Units of 10−13 cm3 molecule−1 s−1. c Units of kJ mol−1. d Originally reported value has been corrected using the most recent IUPAC recommendations for the reference rate coefficients. e the authors stated that the overall uncertainty was less than 10%. | ||||
CF3OCF![[double bond, length as m-dash]](https://www.rsc.org/images/entities/char_e001.gif) CF2 (PMVE) CF2 (PMVE) |
3.58 ± 0.46 | 641 ± 82 | 7.2 ± 0.3 | (Li et al., 2000)7 |
| 2.2 ± 0.3d | (Mashino et al., 2000)8 | |||
| 2.98 ± 0.3e | 10.1 ± 0.4 | −2.7 ± 0.1 | (Tokuhashi et al., 2000)9 | |
CH3OCH![[double bond, length as m-dash]](https://www.rsc.org/images/entities/char_e001.gif) CH2 CH2 |
33.5 ± 3.4 | (Perry et al., 1977)19 | ||
C2F5OCF![[double bond, length as m-dash]](https://www.rsc.org/images/entities/char_e001.gif) CF2 (PEVE) CF2 (PEVE) |
3.0 ± 0.3 | 6.0 ± 0.8 | −4.0 ± 0.3 | This work |
C2H5OCH![[double bond, length as m-dash]](https://www.rsc.org/images/entities/char_e001.gif) CH2 CH2 |
68 ± 7 | (Thiault et al., 2002)20 | ||
| 77.9 ± 17.1 | (Zhou et al., 2006)21 | |||
C3F7OCF![[double bond, length as m-dash]](https://www.rsc.org/images/entities/char_e001.gif) CF2 (PPVE) CF2 (PPVE) |
3.4 ± 0.3 | 4.88 ± 0.49 | −4.7 ± 0.1 | (Amedro et al., 2015)10 |
C3H7OCH![[double bond, length as m-dash]](https://www.rsc.org/images/entities/char_e001.gif) CH2 CH2 |
110 ± 3.4 | (Peirone et al., 2011)22 | ||
The rate coefficient measured in this work for PEVE is very similar to those reported using absolute techniques by Tokuhashi et al.9 for PMVE and by Amedro et al.10 for PPVE, both of whom report a room temperature rate coefficient close to 3–4 × 10⁻¹² cm3 molecule−1 s−1 and a weak, negative temperature dependence. Although the room temperature rate coefficient of Li et al.7 obtained for PMVE is similar to these values, their large activation energy is inconsistent with the other experimental results and also with the fact that the reaction is expected to proceed via electrophilic addition of OH to the double bond of PMVE. As their experiments were conducted at a pressure of 1 Torr of He, where the high pressure limit is possibly not achieved, a lower room temperature rate coefficient may have been expected rather than a higher one. We have no explanation for this discrepancy, but note that low pressure studies of OH reactions often suffer from significant OH wall losses, and pulsed laser systems (essentially wall free) are expected to deliver more accurate results.
Considering only the datasets of Amedro et al.10 Mashino et al.8 and Tokuhashi et al.9 we can discern a small increase in the rate coefficient with increasing chain length, although this is only just significant given the overall uncertainty reported by each experiment. The change in the negative activation energy is however more obvious, likely reflecting the formation of lower energy transition states on the exit channel to product formation for the larger association complexes formed from addition of OH to the vinyl ethers, though this has not been predicted by quantum chemical calculations for PMVE and PEVE.10,23Table 3 also lists room temperature rate coefficients for the reaction of non-fluorinated alkyl vinyl ethers. The rate coefficients for the non-fluorinated analogues are significantly larger by factors of 10 to 30 going from methyl–ethyl–propyl substituted alkyl vinyl ethers. As these are largely OH addition reactions,24,25 this significant increase in the rate coefficient reflects the effect of increasing electron density at the double bond through donation from the alkoxy groups. This trend is clearly much weaker (if at all apparent) for the perfluorinated analogues, and may be expected given the more strongly bound electrons in the fluorinated alkyl/alkoxy groups.
The tropospheric lifetime of PEVE can be estimated by assuming uniform, global concentration of OH radicals. Using a value of [OH] ≈ 106 molecule cm−3![[thin space (1/6-em)]](https://www.rsc.org/images/entities/char_2009.gif) 26 we estimate a tropospheric lifetime for PEVE due to its reaction with OH of ≈4 days. This is an order of magnitude shorter that the exchange time for transport to the stratosphere so that, like PPVE, PEVE will be, to a good approximation, completely degraded in the troposphere by reaction with OH. Since its lifetime is short, PEVE is unlikely to have a significant global warming potential. The atmospheric, OH-initiated degradation of PEVE is likely to lead to fluorinated oxygenates such as CF2O and C2F5OCFO,10,23 though this theoretical result awaits confirmation in experimental product studies, which are presently being undertaken in this laboratory.
26 we estimate a tropospheric lifetime for PEVE due to its reaction with OH of ≈4 days. This is an order of magnitude shorter that the exchange time for transport to the stratosphere so that, like PPVE, PEVE will be, to a good approximation, completely degraded in the troposphere by reaction with OH. Since its lifetime is short, PEVE is unlikely to have a significant global warming potential. The atmospheric, OH-initiated degradation of PEVE is likely to lead to fluorinated oxygenates such as CF2O and C2F5OCFO,10,23 though this theoretical result awaits confirmation in experimental product studies, which are presently being undertaken in this laboratory.
5 Conclusions
The rate coefficient (k1) of the reaction of OH with C2F5OCF![[double bond, length as m-dash]](https://www.rsc.org/images/entities/char_e001.gif) CF2 (PEVE) has been measured for the first time. Both absolute and relative-rate methods at various pressures and temperatures were applied to derive a value of 6.0 × 10⁻¹³
CF2 (PEVE) has been measured for the first time. Both absolute and relative-rate methods at various pressures and temperatures were applied to derive a value of 6.0 × 10⁻¹³![[thin space (1/6-em)]](https://www.rsc.org/images/entities/char_2009.gif) exp(480/T) cm3 molecule−1 s−1 with a room temperature value of (3.0 ± 0.3) × 10−12 cm3 molecule−1 s−1 independent of pressure in the range 50 to 100 Torr N2. The use of three different production schemes for the OH radical, two different experimental set-ups for the pulsed laser experiments (50 or 100 Torr N2) and relative rate constant measurements (750 Torr air) reduce the uncertainty on the rate coefficient to ≈10% at all temperatures. The values of k1 obtained are consistent with rate coefficients for reaction of OH with other fluorinated vinyl ethers and significantly lower than measured for the non-fluorinated analogues. The large OH rate coefficient ensures that PEVE will not be a persistent fluorinated trace-gas in the atmosphere.
exp(480/T) cm3 molecule−1 s−1 with a room temperature value of (3.0 ± 0.3) × 10−12 cm3 molecule−1 s−1 independent of pressure in the range 50 to 100 Torr N2. The use of three different production schemes for the OH radical, two different experimental set-ups for the pulsed laser experiments (50 or 100 Torr N2) and relative rate constant measurements (750 Torr air) reduce the uncertainty on the rate coefficient to ≈10% at all temperatures. The values of k1 obtained are consistent with rate coefficients for reaction of OH with other fluorinated vinyl ethers and significantly lower than measured for the non-fluorinated analogues. The large OH rate coefficient ensures that PEVE will not be a persistent fluorinated trace-gas in the atmosphere.
Conflicts of interest
There are no conflicts to declare.Acknowledgements
We thank Merck KGaA for partial financial support of this project and for provision of samples of PEVE. Open Access funding provided by the Max Planck Society.Notes and references
- A. E. Feiring, in Organofluorine Chemistry: Principles and Commercial Applications, ed. R. E. Banks, B. E. Smart and J. C. Tatlow, Springer, US, Boston, MA, 1994, pp. 339–372 DOI:10.1007/978-1-4899-1202-2_16.
- T. Hiyama and H. Yamamoto, in Organofluorine Compounds: Chemistry and Applications, ed. H. Yamamoto, Springer, Berlin, Heidelberg, 2000, pp. 183–233 DOI:10.1007/978-3-662-04164-2_6.
- S. Ebnesajjad, in Applied Plastics Engineering Handbook, William Andrew Publishing, Oxford, 2011, pp. 49–60, DOI:10.1016/B978-1-4377-3514-7.10004-2.
- M. K. W. Ko, N. D. Sze, W. C. Wang, G. Shia, A. Goldman, F. J. Murcray, D. G. Murcray and C. P. Rinsland, J. Geophys. Res.: Atmos., 1993, 98, 10499–10507 CrossRef.
- M. J. Prather and J. Hsu, Geophys. Res. Lett., 2008, 35, L12810, DOI:12810.11029/12008gl034542.
- W. T. Sturges, T. J. Wallington, M. D. Hurley, K. P. Shine, K. Sihra, A. Engel, D. E. Oram, S. A. Penkett, R. Mulvaney and C. A. M. Brenninkmeijer, Science, 2000, 289, 611–613 CrossRef CAS PubMed.
- Z. J. Li, Z. N. Tao, V. Naik, D. A. Good, J. C. Hansen, G. R. Jeong, J. S. Francisco, A. K. Jain and D. J. Wuebbles, J. Geophys. Res.: Atmos., 2000, 105, 4019–4029 CrossRef CAS.
- M. Mashino, M. Kawasaki, T. J. Wallington and M. D. Hurley, J. Phys. Chem. A, 2000, 104, 2925–2930 CrossRef CAS.
- K. Tokuhashi, A. Takahashi, M. Kaise, S. Kondo, A. Sekiya and E. Fujimoto, Chem. Phys. Lett., 2000, 325, 189–195 CrossRef CAS.
- D. Amedro, L. Vereecken and J. N. Crowley, Phys. Chem. Chem. Phys., 2015, 17, 18558–18566 RSC.
- M. Wollenhaupt, S. A. Carl, A. Horowitz and J. N. Crowley, J. Phys. Chem., 2000, 104, 2695–2705 CrossRef CAS.
- C. B. M. Groß, T. J. Dillon, G. Schuster, J. Lelieveld and J. N. Crowley, J. Phys. Chem. A, 2014, 118, 974–985 CrossRef PubMed.
- J. N. Crowley, G. Saueressig, P. Bergamaschi, H. Fischer and G. W. Harris, Chem. Phys. Lett., 1999, 303, 268–274 CrossRef CAS.
- S. Kraus, DOASIS, DOAS intelligent system, University of Heidelberg, 2006, http://https://doasis.iup.uni-heidelberg.de/bugtracker/projects/doasis/index.php Search PubMed.
- S. B. Barone, A. A. Turnipseed and A. R. Ravishankara, J. Phys. Chem., 1994, 98, 4602–4608 CrossRef CAS.
- A. R. Curtis and W. P. Sweetenham, FACSMILE/CHECKMAT User's Manual, AERE-R12805, Atomic Energy Research Establishment, Harwell, 1988.
- R. Atkinson, D. L. Baulch, R. A. Cox, J. N. Crowley, R. F. Hampson, R. G. Hynes, M. E. Jenkin, M. J. Rossi and J. Troe, Atmos. Chem. Phys., 2004, 4, 1461–1738 CrossRef CAS.
- R. Atkinson, D. L. Baulch, R. A. Cox, J. N. Crowley, R. F. Hampson, R. G. Hynes, M. E. Jenkin, M. J. Rossi and J. Troe, Atmos. Chem. Phys., 2006, 6, 3625–4055 CrossRef CAS.
- R. A. Perry, R. Atkinson and J. N. Pitts Jr., J. Chem. Phys., 1977, 67, 611–614 CrossRef CAS.
- G. Thiault, R. Thevenet, A. Mellouki and G. Le Bras, Phys. Chem. Chem. Phys., 2002, 4, 613–619 RSC.
- S. Zhou, I. Barnes, T. Zhu, I. Bejan and T. Benter, J. Phys. Chem. A, 2006, 110, 7386–7392 CrossRef CAS PubMed.
- S. A. Peirone, J. P. Aranguren Abrate, R. A. Taccone, P. M. Cometto and S. I. Lane, Atmos. Environ., 2011, 45, 5325–5331 CrossRef CAS.
- L. Vereecken, J. N. Crowley and D. Amedro, Phys. Chem. Chem. Phys., 2015, 17, 28697–28704 RSC.
- B. Klotz, I. Barnes and T. Imamura, Phys. Chem. Chem. Phys., 2004, 6, 1725–1734 RSC.
- S. Zhou, I. Barnes, T. Zhu, B. Klotz, M. Albu, I. Bejan and T. Benter, Environ. Sci. Technol., 2006, 40, 5415–5421 CrossRef CAS PubMed.
- R. G. Prinn, J. Huang, R. F. Weiss, D. M. Cunnold, P. J. Fraser, P. G. Simmonds, A. McCulloch, C. Harth, P. Salameh, S. O'Doherty, R. H. J. Wang, L. Porter and B. R. Miller, Science, 2001, 292, 1882–1888 CrossRef CAS PubMed.
| This journal is © the Owner Societies 2018 |

