Effect of phase coarsening under melt annealing on the electrical performance of polymer composites with a double percolation structure†
Xiao-Rong
Sun
,
Tao
Gong
,
Jun-Hong
Pu
,
Rui-Ying
Bao
,
Bang-Hu
Xie
,
Ming-Bo
Yang
 and
Wei
Yang
 *
*
State Key Laboratory of Polymer Materials Engineering, College of Polymer Science and Engineering, Sichuan University, No. 24 South Section 1, Yihuan Road, Chengdu 610065, China. E-mail: weiyang@scu.edu.cn; Fax: +86 28 8546 0130; Tel: +86 28 8546 0130
First published on 27th November 2017
Abstract
The effect of phase coarsening on the evolution of the carbon black (CB) nanoparticle network under quiescent melt annealing and the electrical performance of polypropylene/polystyrene/carbon black (PP/PS/CB) composites with a double percolation structure was investigated. The results showed that when the CB content is low, the coarsening process of PP/PS/CB blends can be divided into two stages. In the first stage, the coarsening rate is fast before the formation of the CB nanoparticle network, and after annealing for a certain time, the evolution of the co-continuous morphology can drive the CB nanoparticles to self-assemble into a complete nanoparticle network. In the second stage, the coarsening rate is slow after the formation of the CB nanoparticle network. When the CB content is high, the CB nanoparticle network can be maintained throughout the whole annealing process, so that the conductivity and morphology of the PP/PS/CB composites are stable. Moreover, the electrical conductivity of the PP/PS/CB composites greatly increases after annealing for a certain time, and a percolation threshold as low as 0.07 vol% can be obtained. These results reveal the relationship between the evolution of the morphology and the conductivity in the conductive polymer composites with a double percolation structure, and provide a more in-depth and comprehensive understanding of the double percolation structure.
1. Introduction
Electrical conductive polymer composites (CPCs) have been widely studied and used in recent years because of their diverse performances, tunable electrical conductivity and low density, especially compared with metal.1–7 Carbon black,8–13 carbon nanotubes14–19 and graphene20–23 have been integrated into the polymer matrix most commonly to fabricate conductive composites. Many methods and mechanisms have been reported to lower the percolation threshold of composites,16,24–32 and it has been found that the electrical properties of CPCs greatly depends on their structure.33,34 Constructing double-percolation structures in conductive polymer composites was thought to be one of the most effective approaches to greatly improve the electrical conductivity of the materials and reduce the percolation threshold.35–38 The concept of double-percolation was firstly raised by Sumita et al.39 in 1991, which is based on the selective distribution of the conductive filler in immiscible co-continuous polymer blends. Since then researchers have paid close attention to the double percolation structure. Now it is generally believed that the reduction of the percolation threshold of composites based on the double-percolation structure is only attributed to the size exclusion effect of the filler poor phase.25,40In general, the properties of immiscible polymer blends greatly depend on their morphologies, including phase sizes and phase shapes. However, the morphology of immiscible polymer blends are usually in a non-equilibrium state after melt blending.41 In this case, the coarsening of phases occurred when the blends suffered subsequent melt processing (i.e. thermal annealing or secondary processing) in order to reduce the interfacial tension, showing increasing phase sizes and decreasing curvature of the interfaces.42–45 The phase coarsening phenomenon has been reported by many researchers, and to obtain polymer blends with stable and desirable properties, the phase coarsening of immiscible polymer blends was greatly suppressed with the incorporation of organic compatibilizers46,47 or inorganic nano-particles.48–51 In our previous work,52–54 the coarsening behavior of polypropylene (PP)/polystyrene (PS) and polyamide 6 (PA6)/acrylonitrile-butadiene-styrene (ABS) blends annealed in a melt state was studied, and the coarsening rate was significantly decreased and the phase morphologies were stabilized with the introduction of nano-silica particles, owing to the strong inhibition effect of the particle network on the movement of the molecular chains. A quantificationally regulated coarsening rate would probably be realized with this understanding of the relationship between the coarsening process of immiscible co-continuous polymer blends and the mobility of polymer molecular chains under annealing.55
For double-percolation structures based on co-continuous polymer blends, the morphologies of the composites are also in a non-equilibrium state, thus the electrical conductivity of the composites can be easily affected by the evolution of morphology during melt annealing.56 Gubbels et al.49,57 studied the effect of the morphology of co-continuous filled polyethylene (PE)/PS blends on electrical conductivity after thermal treatment at 200 °C. They found that the electrical conductivity of the co-continuous 45/55 PE/PS blend containing 5 wt% CB selectively localized in the PE phase increased with the reduction of the interfacial area of the PE phase. It was considered that the conductive pathway is along the branching of the PE phase, when the tortuosity of the PE phase decreased upon annealing, the conductive pathway was shortened, resulting in a higher conductivity. Tan et al.58 investigated the electrical and rheological behaviors of CB-filled immiscible co-continuous PP/PS blends during annealing. They found that the electrical conductivity of the composites increased clearly after annealing and thought that the variation of the resistivity of the composites was mainly attributed to CB migration and agglomeration in the PS phase and the interfacial region during melt annealing.
Recently, studies on double-percolation structured polymer composites have mainly concentrated on the variation of the electrical conductivity of the composites under melt annealing with a high content of conductive fillers,8 and the effect of the evolution of the morphologies on the electrical properties was rarely taken into account. This is probably because of the strong inhibitory effect of the abundant fillers on the phase coarsening of the composites, which makes the morphology relatively stable. While at a low content of conductive filler, obvious phase coarsening still takes place in the double-percolation conductive polymer composites during the melt annealing process, which definitely affects the final electrical properties. In this case, the effect of the evolution of morphologies on the dispersion state of the nanoparticles and the electrical properties is still not completely understood. In this paper, the effect of phase coarsening on the evolution of the CB nanoparticle network and the electrical performance of PP/PS/CB composites with a double percolation structure under quiescent melt annealing was investigated comprehensively, which will probably provide helpful guidance for the preparation of morphologically tunable and performance optimized polymer composites.
2. Experimental section
2.1 Materials
Isotactic polypropylene (iPP, T30s), with the weight-average molecular weight of 387![[thin space (1/6-em)]](https://www.rsc.org/images/entities/char_2009.gif) 000 and a polydispersity of 3.6, was supplied by Kunlun Petrochemical Co., Ltd, China. Polystyrene (PS, PG-383M), with the weight-average molecular weight of 287
000 and a polydispersity of 3.6, was supplied by Kunlun Petrochemical Co., Ltd, China. Polystyrene (PS, PG-383M), with the weight-average molecular weight of 287![[thin space (1/6-em)]](https://www.rsc.org/images/entities/char_2009.gif) 000 and a polydispersity of 2.3 was supplied by Zhenjiang Chimei Chemical Co., Ltd, China. Carbon black (CB, BP2000), with a mean particle size of 12 nm, a specific surface area of 1487 m2 g−1 and a dibutyl phthalate absorption of 330 mL/100 g, was supplied by Cabot Corp., USA.
000 and a polydispersity of 2.3 was supplied by Zhenjiang Chimei Chemical Co., Ltd, China. Carbon black (CB, BP2000), with a mean particle size of 12 nm, a specific surface area of 1487 m2 g−1 and a dibutyl phthalate absorption of 330 mL/100 g, was supplied by Cabot Corp., USA.
2.2 Sample preparation
The polymers were vacuum dried at 80 °C for 12 h before use. The melt compounding was conducted in a torque rheometer (XSS-300, Shanghai Kechuang Rubber Plastics Machinery Set Ltd, China) at 190 °C. The PP pellets were firstly mixed with a certain amount of CB powder in the torque rheometer at 50 rpm for 3 min, then PS pellets were added into the mixing chamber and blended for another 5 min. This charging sequence was applied for a more uniform dispersion of CBs in the PS phase as described in our previous work.59 After mixing, the blends were rapidly quenched in cold water to freeze the phase morphology. The weight ratio of PP and PS was kept at 50/50 for all blends to maintain the co-continuous phase structure and the obtained samples were denoted as PP/PS/CB-X, where X represents the volume fraction of the CB particles in the PP/PS/CB composites. For comparison, conventional melt compounded PS/CB composites with different contents of CB particles were also prepared in the same torque rheometer at 190 °C and 50 rpm for 5 min and these samples were marked as conventional PS/CB-Y, where Y represents the volume fraction of the CB particles in the PS/CB composites.2.3 Annealing process
Annealing treatment was carried out on a compression molding machine. The samples obtained by melt compounding were placed into the cavity of a frame (30 mm × 10 mm× 2 mm), and sandwiched between two polyimide films. The materials were then placed between two metal plates, and subsequently put on the compression molding machine. The samples were preheated at 190 °C for 1 min and compression molded under 2 MPa for 30 s. Then the pressure was removed and the materials were kept in close contact with the top and bottom press plates. To avoid the morphology change induced by pressing, no pressure was applied during annealing. All the blends were annealed for different times at 190 °C, respectively. After annealing, the samples were quenched with cold water.2.4 Characterizations
 | (1) |
A polarizing optical microscope (POM, Olympus BX51, Olympus Co., Tokyo, Japan) equipped with a PixeLINK CCD camera and a LINKAM THMS 600 shear hot stage was also used to observe the morphologies of the samples. The blends were cut into thin films with a thickness of 10 μm using an ultra-thin semiautomatic microtome (KD-3358, Zhejiang Jinhua Kedi Instrumental Equipment Co., Ltd, China). Then the obtained films were placed between two slides and observed by POM and the morphologies were recorded by using a video camera. For in situ observation of the morphology coarsening, the composite films were placed between two slides of the shear hot stage and heated to 190 °C at a ramp of 30 °C min−1, and the micrographs were recorded every minute as soon as the temperature reached 190 °C.
3. Result and discussion
3.1 Distribution of CB particles under quiescent annealing
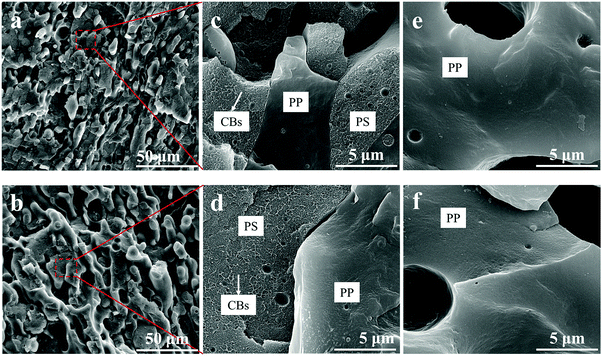
CB particles are usually distributed in one phase or at the interphase rather than homogeneously distributed in the whole polymer blend when they are introduced into an immiscible polymer blend.39,60–62 In our previous work,9 the location of the CB particles was predicted by the wetting parameter (ω) proposed by Sumita et al.,39 and the result indicated that the CB particles would selectively distribute in the PS phase in the PP/PS blend thermodynamically, which was also verified by the SEM micrographs and optical microscopic observation.In order to confirm the distribution of CB particles during annealing, the morphologies of the PP/PS/CB composites with a CB content of 3.34 vol% annealed at 190 °C for various times are shown in the SEM results (Fig. 1). As shown in Fig. 1(a) and (b), the two phases interpenetrate into a typical co-continuous structure, after annealing for 5 min and even for 120 min. The two images only show a little difference in the phase domain size. It can be clearly observed in the magnified Fig. 1(c) and (d) that the CB particles just locate in one phase, showing a rough fracture surface with a lot of bumps. And the fracture surface of the other phase is smooth, where the CB particles can hardly be seen. Fig. 1(e) and (f) show the porous morphology of the samples after selective extraction of the PS phase, that is, the PP porous structure. The fracture surface of the remaining PP frame is smooth and no CB particles can be found. So we can identify the two phases in Fig. 1(c) and (d) and conclude that the CB particles almost totally distribute in the PS phase during the whole annealing process.
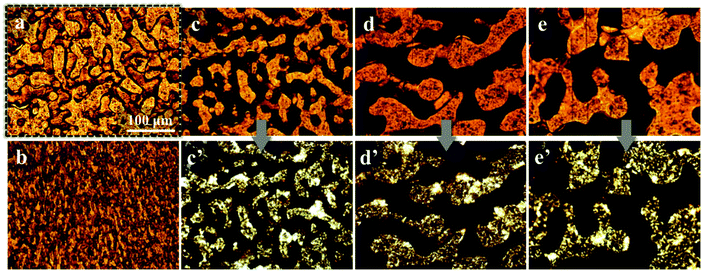
The selective distribution of the filler particles in the immiscible polymer blends can be observed further with an optical microscope, and the optical micrographs of the pure PP/PS blend and the PP/PS/CB composite with a CB content of 0.33 vol% annealed at 190 °C for various periods of time are shown in Fig. 2. In Fig. 2(a), the pure PP/PS blend shows a distinct phase interface, and the difference in the brightness of the PP phase and PS phase is very limited. When the CB particles are introduced, one phase of the composites turn dark because of the selective distribution of CB particles and the brightness of the other phase is almost unchanged. Moreover, the brightness is maintained during annealing, which demonstrates that the CB particles selectively distribute in one phase consistently during the whole annealing process. Under the polarization mode, the bright phase represents the crystallized PP phase and the dark phase belongs to the amorphous PS phase. Fig. 2(c′)–(e′) are the optical pictures under polarization mode, and it can be observed that the phase without the presence of CB particles (Fig. 2(c)–(e)) is shown as the bright phase under polarization mode (Fig. 2(c′)–(e′)), which can be concluded to be the PP phase. Thus, it is affirmed that CB particles selectively distribute in the PS phase, and such a selective distribution does not change under quiescent melt annealing.
3.2 Electrical properties of co-continuous PP/PS/CB composites quiescently annealed for various times
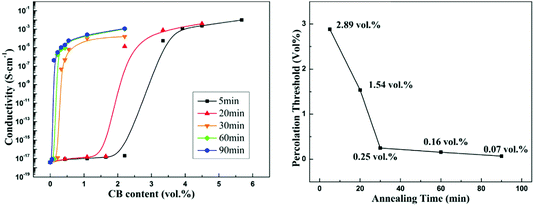
Fig. 3(a) shows the conductivity of the co-continuous PP/PS/CB composites annealed at 190 °C for different times as a function of CB content. From Fig. 3(a), the electrical conductivity of the composites increases significantly with the increase of annealing time. Moreover, the samples are electrically conductive even when they contain a very low content of CB after long-time quiescent melt annealing. Then the percolation thresholds of the composites annealed for different times are calculated using the modified classical percolation theory,63 and are shown as a function of annealing time in Fig. 3(b). With the extension of annealing time, an obvious decrease of the percolation threshold of the composites can be observed. The percolation threshold decreases from 2.89 vol% to 0.25 vol% only after 30 min of annealing, and it should be noted that this value is low for the CB-filled conductive polymer composites. The percolation threshold decreases further to 0.07 vol% after 90 min of annealing, which shows a 40-time-decrease than that of the initial percolation threshold. It is noteworthy that this value is almost the lowest percolation threshold in all the reported polymer/CB nanoparticle conductive polymer composites.8,9,57,64The effect of heat-treatment on the conductivity of PS/CB composites has been reported.65 The results showed that during annealing, CB particles would form a more perfect CB conductive network in the PS melt via self-assembly, resulting in a higher electrical conductivity and a lower percolation threshold. In our work, the variation of the conductivity of PS/CB composites annealed at 190 °C for various times is also examined and the results are shown in Fig. 4, for comparison with the co-continuous PP/PS/CB composites. Similarly, the electrical conductivity of the PS/CB composites gets higher with the increasing time of melt annealing, while the increasing range is much smaller than that of the PP/PS/CB composites. In Fig. 4, the percolation threshold decreases from 5.25 vol% to 2.31 vol% after 120 min of annealing, showing only a half of the reduction. However, as has been discussed in Fig. 3(b), the percolation threshold of the PP/PS/CB composites could manifest a 40-time-decrease only after 90 min of annealing. According to the size exclusion effect based on the double percolation theory, the percolation threshold of the co-continuous PP/PS/CB composites with a double percolation structure should be half of the percolation threshold of the PS/CB composites. However, after melt annealing, the percolation threshold of the PP/PS/CB composites is far lower than half of the percolation threshold of the PS/CB composites. Thus this clearly shows that the self-assembly behavior of CB particles in the PS melt could result in better electrical conductivity and a lower percolation threshold, but it is not the main reason for the sharply reduced percolation threshold of the co-continuous PP/PS/CB composites.
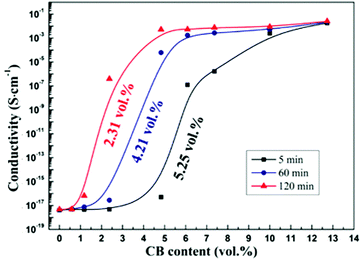 | ||
| Fig. 4 Dependence of conductivity on CB content for PS/CB composites annealed at 190 °C for different times. | ||
The variation of the electrical conductivity of the conductive polymer composites can be attributed to the variation of the conductive network formed by nanoparticles, and this variation of the filler network can be characterized by rheological analysis.58Fig. 5 shows the dynamic storage modulus (G′) of the PS/CB composites and the PP/PS/CB composites as a function of annealing time at 190 °C, and the relative contents of the CB particles to the PS phase are the same in these two series of composites. It can be seen that the G′ of pure PS stays nearly unchanged. With the introduction of CB nanoparticles, the G′ of the PS/CB composites increases slightly in the early stage of annealing and then remains unchanged, owing to the self-assembly of CB particles into a more perfect nanoparticle network during the annealing process. Similarly, for pure PP/PS blends, the G′ of the blends is almost unchanged. The G′ of PP/PS/CB composites increases continuously with the increase of annealing time, and the increasing range is clearly higher than that of PS/CB, moreover, the increasing range becomes more obvious with the increase of the CB content. This demonstrates that self-assembly of the CB particle is not the only factor to make the CB nanoparticle network more strengthened and complete in the PP/PS/CB composites.
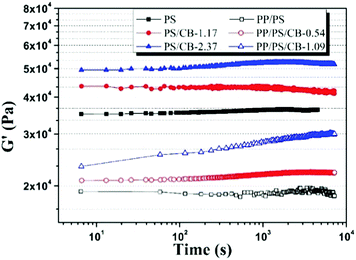 | ||
| Fig. 5 Dynamic storage modulus (G′) as a function of annealing time at 190 °C for PS/CB composites and PP/PS/CB composites with different contents of CB particles. | ||
3.3 Phase coarsening of co-continuous PP/PS/CB composites
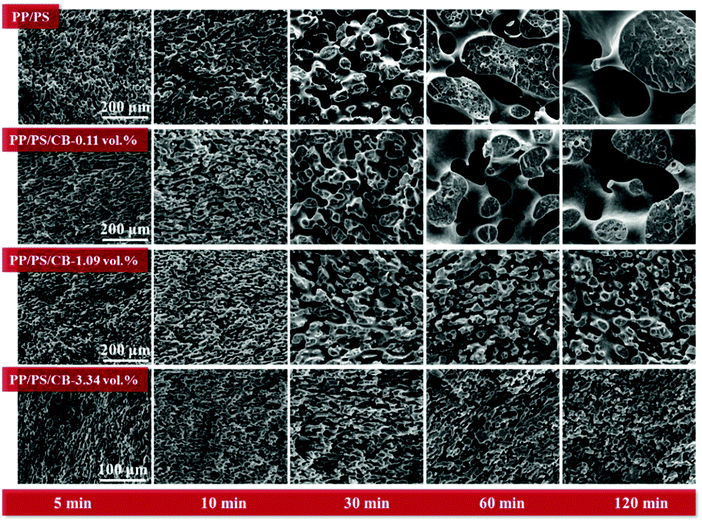
The preservation of the co-continuous phase structure during the whole melt annealing process should be verified firstly to well understand the phase coarsening of PP/PS/CB composites. So the dependences of the continuity of the PS phase on the annealing time in the composites with different CB contents are shown in Fig. S1 (ESI†). For pure PP/PS blends and all PP/PS/CB composites, the continuity of PS phase was maintained at over 95% after annealing for different times, indicating that the morphologies of all the samples can be considered as co-continuous structures.Fig. 6 shows the morphologies of the PP/PS blends and PP/PS/CB composites with different contents of CB annealed for various times at 190 °C. The PS phase is extracted by xylene for clearer observation. It can be seen that all the samples show a co-continuous structure, consistent with the PS phase continuity results. For pure PP/PS blends, the phase domain sizes increase greatly with the increase of annealing time, showing a significant phase coarsening. When a low content (0.11 vol%) of CB particles was introduced, the mobility of the PS molecular chains is restrained due to the increased friction, which leads to a slower relaxation of molecular chains. The phase coarsening process is retarded to some degree, but the increase of phase domain size is still obvious. When the CB content increases to 1.09 vol%, the phase coarsening in the composites is retarded significantly.
The phase domain size increases in the first 30 min of the annealing, and stays unchanged in the subsequent annealing process, owing to the formation of a more perfect CB nanoparticle network in the composites, which can restrain the phase coarsening of the samples. Interestingly, when the CB content further increases to 3.34 vol%, the morphology and phase domain size of the composite remained almost unchanged during the whole melt annealing process. This indicates that the morphology of the composite is totally fixed because of the abundant CB particles, and the inhibitory effect of CB particle network on the coarsening of PP/PS/CB is highly significant.52–54
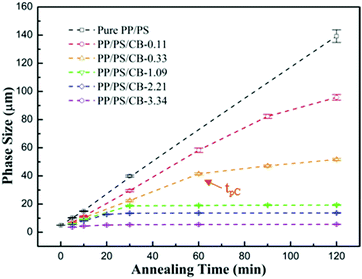
In order to investigate the evolution of the phase size during the phase coarsening process and the influence of the CB particles on the coarsening process more accurately, statistics on the phase domain sizes of the samples are collected. Fig. 7 shows the phase size growth for the co-continuous PP/PS/CB composites as a function of the annealing time at 190 °C. For the pure PP/PS blend, the phase size increases linearly with the increase of annealing time, and the phase size increases from 5.05 μm to 139.29 μm after melt annealing for 120 min, showing drastic coarsening. When the CB nanoparticles are introduced, the increasing range of the phase size significantly decreases, especially for the sample PP/PS/CB-3.34, the phase size just increases from 3.67 μm to 5.67 μm after annealing for 120 min, indicating the superb inhibitory effect of the CB particles on phase coarsening. In addition, it can be seen that the increase rate of the phase size is divided into two stages rather than increasing linearly with increasing annealing time after CB was introduced. In the first stage, the coarsening rate is fast and the phase size increasing range is high with a high slope of the curve. In the second stage, the coarsening rate slows down and the phase size increasing range decreases obviously with a relatively low slope of the curve. Particularly, when the CB content is higher than 1.09 vol%, the phase sizes are very stable in the second stage. Moreover, there is a turning point between these two stages, which appears earlier with increasing CB content, and this appearance time is denoted as tpC for convenience.
3.4 Relationship between electrical conductivity and the phase coarsening of co-continuous PP/PS/CB composites
In order to distinctly manifest the evolution of the electrical conductivity of PP/PS/CB composites during the whole annealing process, the resistivity of all the samples as a function of annealing time at 190 °C is shown in Fig. 8. It can be seen that the conductive percolation phenomenon of the sample appears at some point during the annealing process. That is to say, the resistivity of the samples dramatically decreases when the non-conductive samples suffer melt annealing for a certain time, showing a typical conductive percolation phenomenon. The needed annealing time for the composites to turn electrically conductive is shortened with increasing CB nanoparticle content. Here, the appearance time of the conductive percolation phenomenon is denoted as tpR. It is generally accepted that the requirement of electrically conductivity in conductive polymer composites is the formation of a complete nanoparticle conductive network. However, in Fig. 8, after melt annealing of the non-conductive PP/PS/CB composites with high resistivity for a certain time, the conductive percolation phenomenon occurs. This indicates that the low content of CB particles in the PP/PS/CB composites cannot form an interconnected conductive network after just melt compounding, so the initial composites are non-conductive. However, after annealing treatment for some time, the composites turn electrically conductive, clearly demonstrating that the CB particles formed a complete CB conductive network in the PP/PS melt during annealing.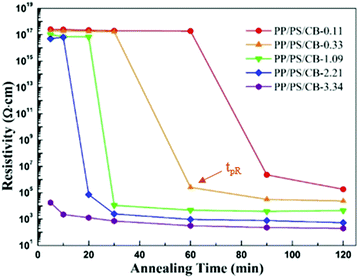 | ||
| Fig. 8 The resistivity as a function of annealing time at 190 °C for PP/PS/CB composites with different contents of CB particles. | ||
It is quite interesting to make a comparison of Fig. 7 and 8. When the phase coarsening rate changes from stage 1 to stage 2, the insulative composites turn conductive, that is, tpC = tpR. This relationship can be explained with the formation of the CB nanoparticle network. When the CB content is low, it is difficult to form a complete conductive network just by melt compounding. In the initial stage of annealing, the phase domains are easy to coarsen driven by interfacial tension, but the coarsening rate is lower than that of the pure PP/PS blends, owing to that the interactions between the CB nanoparticles and the PS molecular chains can partly decrease the mobility of the molecular chains. As the annealing process goes on, the conductive pathway shortens with the decreasing tortuosity of the PS phase upon annealing, and the network structure of CB is built up in the PS melt. This network structure can provide a conductive path and make the materials electrically conductive. On the other hand, the perfect elastic nanoparticle network can fix the morphology of the composites, showing a significant inhibitory effect on the phase coarsening.
In conclusion, for the PS/CB composite, the CB particles would form a more perfect CB conductive network in the PS melt via self-assembly during annealing, resulting in a higher electrical conductivity and a lower percolation threshold,65 but the morphology of the PS phase did not change. For co-continuous PP/PS/CB composites, both the self-assembly behavior of the CB particles and the evolution of the morphology structure of the composites took place during annealing, and these two processes could affect each other. The combination of conductive properties, rheological properties and morphology observation shows that the formation of the CB nanoparticle network in PP/PS/CB composites during annealing depends also on the evolution of morphology, not only on the self-assembly of CB nanoparticles.
To further understand the effect of morphology evolution on the CB nanoparticle network, the morphologies of the PP/PS/CB composites during annealing are observed with an optical microscope. Fig. 9 shows the optical micrographs of the PP/PS/CB-0.33 vol% composite annealed at 190 °C for 30 min and 60 min. It can be seen that the CB nanoparticles selectively distributed in the PS phase, and that in the PS phase a heterogeneous dispersion of CB could be observed. As shown in the blue circles in Fig. 9, many PS thin-rod like phase domains can be observed obviously, without CB nanoparticles. Yuan et al.66 studied the coarsening of co-continuous PS/HDPE blends under quiescent annealing and discussed the morphology evolution of the thin-rod like phase. They pointed out that a capillary pressure effect should be present because of the phase-size distribution in the immiscible blend (varied rod phase thicknesses). The thick parts with a large cross section generated a capillary force lower than the thin parts with a smaller cross section, and this imparted a force gradient which results in flow from the thin parts toward the thick parts, showing the continuous merging process of the polymer material from the thin parts into the thick parts during annealing. Similarly, in our work, the capillary pressure drives the CB nanoparticles and the PS melt to move to thick PS phase domains, resulting in quite a low content of CB nanoparticles in the thin PS phase. In particular for the thin-rod like phase which has a huge difference with the thick matrix phase domain (backbones) in size, there are almost no CB particles distributing in it because of the huge capillary pressure difference. During melt mixing, the melt experienced breakup and merged incessantly under the complex flow field, leading to an extremely unstable morphology. In the initial stage of annealing, the coarsening phenomenon took place mainly via coalescence and shrinking/retracting, generating lots of PS thin-rod like phases. So the CB nanoparticles cannot continuously distribute in the PS phase because of the existence of these PS thin-rod phases, and the CB nanoparticle conductive network is unable to be constructed, as shown in Fig. 9(a). With the increase of annealing time, the thin rod PS phase merges into the thick phase and the size decreases continuously, and breaks up into small droplets finally. At the same time, coalescence occurs in the thick phase domain mostly, resulting in a more and more uniform phase size. Then it is easier for CB particles to continuously distribute in the PS phase, and a more continuous CB nanoparticle network is built up gradually, as shown in Fig. 9(b). Once the complete CB network is formed successfully, the conductive percolation phenomenon occurs and the materials are electrically conductive. This indicates that phase coarsening of PP/PS/CB composites during annealing can drive the CB nanoparticles to self-assemble into a complete nanoparticle network, while the formation of the CB network can greatly fix the morphology of the composites in return and increase the inhibitory effect of the CB nanoparticles on the coarsening process.
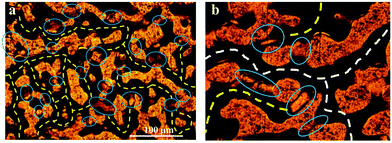 | ||
| Fig. 9 Optical micrographs of PP/PS/CB-0.33 vol% composites annealed at 190 °C for (a) 30 min and (b) 60 min. Note that the scale bar is applied to the both images. | ||
In situ observation of morphology coarsening in PP/PS/CB composites during the melt annealing process is shown in Fig. 10, using an optical microscope equipped with a shear hot stage. The microscopic morphology of the PP/PS/CB composite in the melt state can clearly observed.
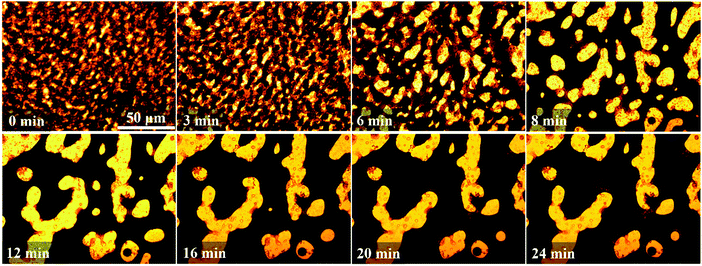 | ||
| Fig. 10 Morphology evolution of the PP/PS/CB-0.33 vol% composite film over annealing at 190 °C. Note that the scale bar is applied to the entire images. | ||
From Fig. 10, the PP/PS/CB-0.33 vol% shows a typical double-percolation structure at first, with a small phase domain size. A complete CB network cannot be formed because of the low CB content, and the CB particles mainly distribute in large-sized PS phase domains, while only a very low content of CB can be observed in the other parts. The phase size increases quickly at the beginning of annealing, and when the annealing lasts for 3 min and 6 min, a heterogeneous dispersion of CB particles can be clearly observed. There are less CB nanoparticles distributed in PS thin-rod like phase domains which looks brighter due to the capillary pressure effect. In this case, the formation of the complete CB nanoparticle network is prevented by the PS thin-rod like phase. When the annealing lasts for 8 min, the coalescence of the CB-rich PS phase domains with large-sizes takes place, and the thin rod phase domains merge into thick domains, resulting in obviously larger phase sizes. In this case, the PS thin-rod like domains are reduced greatly and the PS continuous structure drives the CB nanoparticles to self-assemble into a complete nanoparticle network. With further increasing the annealing to 12 min, the coarsening still goes on, the domain sizes increase and CB nanoparticle network becomes more complete. Later, the morphology of the composite remains almost unchanged during subsequent annealing, owing to the formation of the complete nanoparticle elastic network in the PS phase, which is hard to be destroyed by means of the domain movement and capillary pressure effect. So the morphology can be totally fixed, which also helps to make the PP/PS/CB composites conductive.
3.5 Mechanism
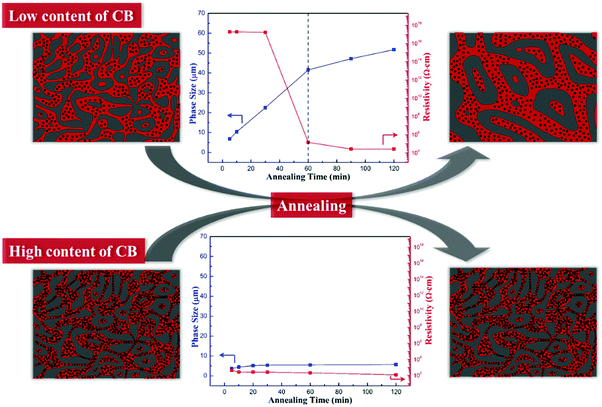
The relationship between the morphology evolution and the electrical conductivity of PP/PS/CB composites is shown in Scheme 1. When the content of the CB particles is low, the CB particles in the composites cannot form a continuous network just after melt mixing, and their dispersion mainly depends on the PS phase domain. The CB particles mainly distribute in a large-sized PS phase and form many local network structures, while the PS thin-rod like phase domains formed during the coarsening process can separate these local networks and prevent the formation of a complete CB nanoparticle network due to the capillary pressure. So the samples cannot be electrically conductive at the initial stage of annealing. At the same time, the local CB networks and the interaction between the CB particles and PS chains can decrease the mobility of the PS molecular chains under annealing to some degree, leading to retarded phase coarsening. After annealing for a certain time, the domain sizes increase and the PS thin-rod like domains are reduced and the perfect PS continuous structure will drive the CB nanoparticles to self-assemble into a complete nanoparticle network, which makes the PP/PS/CB composites conductive. In this case, the path of the CB particles is guided by the morphological evolution of the PS phase, and the CB particles can self-assemble under annealing, both of these synergistically facilitating the formation of the complete CB network at quite a low CB content. Once the complete CB network is formed successfully, the morphology of the composites can be fixed in return and the inhibitory effect of the CB nanoparticles on the coarsening process increases distinctly.When the content of the CB particles is high, the distance among CB particles is short, and the strong interparticle interaction can make the CB nanoparticles form a complete conductive network during melt mixing and conductive polymer composites can be obtained directly. This interconnected elastic network greatly retards the mobility of the PS molecular chains during annealing and is hard to be destroyed by the capillary pressure effect. So the morphology of composites can be totally fixed by this network structure, showing an almost unchanged morphology, domain size and electrical conductivity.
4. Conclusion
The effect of phase coarsening on the formation of CB nanoparticle network and the electrical performance of PP/PS/CB composites with a double percolation structure under quiescent melt annealing was investigated, coming to the following conclusions. (1) The electrical conductivity of the PP/PS/CB composites greatly increases after annealing for a certain time, a quite low percolation threshold as 0.07 vol% can be obtained. (2) For PP/PS/CB composites with a low CB content, the coarsening process is divided into two stages, when the phase coarsening rate changes from stage 1 to stage 2, the insulated composites turn conductive. (3) When the CB content is low, the path of the CB particles is guided by the morphological evolution of the PS phase, and the CB particles can self-assemble under annealing, synergistically making the CB network form at quite a low CB content. These results revealed the relationship between the evolution of the morphology and the conductivity in the polymer conductive composites with a double percolation structure and provided a more in-depth and comprehensive understanding of the double percolation structure, which will probably provide helpful guidance for the preparation of morphologically tunable and performance optimized polymer composites.Conflicts of interest
There are no conflicts to declare.Acknowledgements
This work was funded by the National Natural Science Foundation of China (51422305 and 51421061) and the Sichuan Provincial Science Fund for Distinguished Young Scholars (2015JQO003).References
- H. Jiang, K.-S. Moon, Y. Li and C. P. Wong, Chem. Mater., 2006, 18, 2969–2973 CrossRef CAS.
- S. Mondal, S. Ganguly, M. Rahaman, A. Aldalbahi, T. K. Chaki, D. Khastgir and N. C. Das, Phys. Chem. Chem. Phys., 2016, 18, 24591–24599 RSC.
- Y. Li, K. Dai, J. Zhao, N. Li, G. Zheng, C. Liu, J. Chen and C. Shen, Polym. Compos., 2015, 36, 205–213 CrossRef CAS.
- H. Liu, J. Gao, W. Huang, K. Dai, G. Zheng, C. Liu, C. Shen, X. Yan, J. Guo and Z. Guo, Nanoscale, 2016, 8, 12977–12989 RSC.
- D. Ding, H. Wei, J. Zhu, Q. He, X. Yan, S. Wei and Z. Guo, Energ. Environ. Focus, 2014, 3, 85–93 CrossRef.
- J. Chen, Y. Shen, J.-H. Yang, N. Zhang, T. Huang, Y. Wang and Z.-W. Zhou, J. Mater. Chem. C, 2013, 1, 7808–7811 RSC.
- M. Qu, F. Nilsson, Y. Qin, G. Yang, Y. Pan, X. Liu, G. Hernandez Rodriguez, J. Chen, C. Zhang and D. W. Schubert, Compos. Sci. Technol., 2017, 150, 24–31 CrossRef CAS.
- Y. Pan, X. Liu, X. Hao and D. W. Schubert, Phys. Chem. Chem. Phys., 2016, 18, 32125–32131 RSC.
- T. Gong, S.-P. Peng, R.-Y. Bao, W. Yang, B.-H. Xie and M.-B. Yang, Composites, Part B, 2016, 99, 348–357 CrossRef CAS.
- Y. Song, C. Xu and Q. Zheng, Soft Matter, 2014, 10, 2685–2692 RSC.
- X. Liu, Y. Pan, G. Zheng and D. W. Schubert, Compos. Sci. Technol., 2016, 128, 1–7 CrossRef CAS.
- J. Chen, X. Cui, K. Sui, Y. Zhu and W. Jiang, Compos. Sci. Technol., 2017, 140, 99–105 CrossRef CAS.
- Y. Zheng, Y. Li, Z. Li, Y. Wang, K. Dai, G. Zheng, C. Liu and C. Shen, Compos. Sci. Technol., 2017, 139, 64–73 CrossRef CAS.
- B. Krause, R. Boldt, L. Häußler and P. Pötschke, Compos. Sci. Technol., 2015, 114, 119–125 CrossRef CAS.
- X. Guan, G. Zheng, K. Dai, C. Liu, X. Yan, C. Shen and Z. Guo, ACS Appl. Mater. Interfaces, 2016, 8, 14150–14159 CAS.
- J. Huang, C. Mao, Y. Zhu, W. Jiang and X. Yang, Carbon, 2014, 73, 267–274 CrossRef CAS.
- J. Huang, Y. Zhu, W. Jiang, J. Yin, Q. Tang and X. Yang, ACS Appl. Mater. Interfaces, 2014, 6, 1754–1758 CAS.
- J. Huang, Y. Zhu, W. Jiang and Q. Tang, Composites, Part A, 2015, 69, 240–246 CrossRef CAS.
- K. Sun, P. Xie, Z. Wang, T. Su, Q. Shao, J. Ryu, X. Zhang, J. Guo, A. Shankar, J. Li, R. Fan, D. Cao and Z. Guo, Polymer, 2017, 125, 50–57 CrossRef CAS.
- C. He, X. She, Z. Peng, J. Zhong, S. Liao, W. Gong, J. Liao and L. Kong, Phys. Chem. Chem. Phys., 2015, 17, 12175–12184 RSC.
- C. Mao, J. Huang, Y. Zhu, W. Jiang, Q. Tang and X. Ma, J. Phys. Chem. Lett., 2013, 4, 43–47 CrossRef CAS PubMed.
- Q.-q. Bai, X. Wei, J.-h. Yang, N. Zhang, T. Huang, Y. Wang and Z.-w. Zhou, Composites, Part A, 2017, 96, 89–98 CrossRef CAS.
- L. Bai, S. He, J. W. Fruehwirth, A. Stein, C. W. Macosko and X. Cheng, J. Rheol., 2017, 61, 575–587 CrossRef CAS.
- Y. Gao, D. Cao, J. Liu, J. Shen, Y. Wu and L. Zhang, Phys. Chem. Chem. Phys., 2015, 17, 22959–22968 RSC.
- T. Li, L.-F. Ma, R.-Y. Bao, G.-Q. Qi, W. Yang, B.-H. Xie and M.-B. Yang, J. Mater. Chem. A, 2015, 3, 5482–5490 CAS.
- J. Chen, Y.-Y. Shi, J.-H. Yang, N. Zhang, T. Huang, C. Chen, Y. Wang and Z.-W. Zhou, J. Mater. Chem., 2012, 22, 22398–22404 RSC.
- H. Pang, D.-X. Yan, Y. Bao, J.-B. Chen, C. Chen and Z.-M. Li, J. Mater. Chem., 2012, 22, 23568–23575 RSC.
- K. Zhang, G.-H. Li, L.-M. Feng, N. Wang, J. Guo, K. Sun, K.-X. Yu, J.-B. Zeng, T. Li, Z. Guo and M. Wang, J. Mater. Chem. C, 2017, 5, 9359–9369 RSC.
- Y. Tan, L. Fang, J. Xiao, Y. Song and Q. Zheng, Polym. Chem., 2013, 4, 2939–2944 RSC.
- J. Chen, X. Cui, Y. Zhu, W. Jiang and K. Sui, Carbon, 2017, 114, 441–448 CrossRef CAS.
- Y.-D. Shi, M. Lei, Y.-F. Chen, K. Zhang, J.-B. Zeng and M. Wang, J. Phys. Chem. C, 2017, 121, 3087–3098 CAS.
- H. Pang, L. Xu, D.-X. Yan and Z.-M. Li, Prog. Polym. Sci., 2014, 39, 1908–1933 CrossRef CAS.
- L. Xie and Y. Zhu, Polym. Compos., 2017 DOI:10.1002/pc.24345.
- H. Deng, L. Lin, M. Ji, S. Zhang, M. Yang and Q. Fu, Prog. Polym. Sci., 2014, 39, 627–655 CrossRef CAS.
- C. Mao, Y. Zhu and W. Jiang, ACS Appl. Mater. Interfaces, 2012, 4, 5281–5286 CAS.
- S. L. Scherzer, E. Pavlova, J. D. Esper and Z. Starý, Compos. Sci. Technol., 2015, 119, 138–147 CrossRef CAS.
- C. Gao, S. Zhang, Y. Lin, F. Li, S. Guan and Z. Jiang, Composites, Part B, 2015, 79, 124–131 CrossRef CAS.
- S. Zhang, H. Deng, Q. Zhang and Q. Fu, ACS Appl. Mater. Interfaces, 2014, 6, 6835–6844 CAS.
- M. Sumita, K. Sakata, S. Asai, K. Miyasaka and H. Nakagawa, Polym. Bull., 1991, 25, 265–271 CrossRef CAS.
- A. Taguet, P. Cassagnau and J. M. Lopez-Cuesta, Prog. Polym. Sci., 2014, 39, 1526–1563 CrossRef CAS.
- A. G. C. Machiels, K. F. J. Denys, J. Van Dam and A. P. De Boer, Polym. Eng. Sci., 1996, 36, 2451–2466 CAS.
- A. Pyun, J. R. Bell, K. H. Won, B. M. Weon, S. K. Seol, J. H. Je and C. W. Macosko, Macromolecules, 2007, 40, 2029–2035 CrossRef CAS.
- E. Scholten, L. M. C. Sagis and E. van der Linden, Macromolecules, 2005, 38, 3515–3518 CrossRef CAS.
- F. Fenouillot, F. Méchin, F. Boisson, P. Alcouffe, T. Pokropski, T. Kallel and M. Mnif, Eur. Polym. J., 2012, 48, 284–295 CrossRef CAS.
- R. C. Willemse, E. J. J. Ramaker, J. Van Dam and A. P. De Boer, Polym. Eng. Sci., 1999, 39, 1717–1725 CAS.
- C. Huang and W. Yu, AIChE J., 2015, 61, 285–295 CrossRef CAS.
- M. A. Huneault and H. Li, Polymer, 2007, 48, 270–280 CrossRef CAS.
- S. P. Pawar and S. Bose, Phys. Chem. Chem. Phys., 2015, 17, 14470–14478 RSC.
- F. Gubbels, S. Blacher, E. Vanlathem, R. Jerome, R. Deltour, F. Brouers and P. Teyssie, Macromolecules, 1995, 28, 1559–1566 CrossRef CAS.
- F. Laoutid, E. Estrada, R. M. Michell, L. Bonnaud, A. J. Müller and P. Dubois, Polymer, 2013, 54, 3982–3993 CrossRef CAS.
- S. Huang, L. Bai, M. Trifkovic, X. Cheng and C. W. Macosko, Macromolecules, 2016, 49, 3911–3918 CrossRef CAS.
- X.-Q. Liu, Z.-Y. Sun, R.-Y. Bao, W. Yang, B.-H. Xie and M.-B. Yang, RSC Adv., 2014, 4, 41059–41068 RSC.
- X. Q. Liu, R. H. Li, R. Y. Bao, W. R. Jiang, W. Yang, B. H. Xie and M. B. Yang, Soft Matter, 2014, 10, 3587–3596 RSC.
- X.-Q. Liu, Q.-Y. Wang, R.-Y. Bao, W. Yang, B.-H. Xie and M.-B. Yang, RSC Adv., 2014, 4, 49429–49441 RSC.
- T. Gong, R. Y. Bao, Z. Y. Liu, B. H. Xie, M. B. Yang and W. Yang, Phys. Chem. Chem. Phys., 2017, 19, 12712–12719 RSC.
- L. Bai, R. Sharma, X. Cheng and C. W. Macosko, Langmuir, 2017 DOI:10.1021/acs.langmuir.7b03085.
- F. Gubbels, R. Jerome, E. Vanlathem, R. Deltour, S. Blacher and F. Brouers, Chem. Mater., 1998, 10, 1227–1235 CrossRef CAS.
- Y. Tan, Y. Song, Q. Cao and Q. Zheng, Polym. Int., 2011, 60, 823–832 CrossRef CAS.
- T. Gong, M.-Q. Liu, H. Liu, S.-P. Peng, T. Li, R.-Y. Bao, W. Yang, B.-H. Xie, M.-B. Yang and Z. Guo, Polymer, 2017, 110, 1–11 CrossRef CAS.
- L.-F. Ma, R.-Y. Bao, R. Dou, Z.-Y. Liu, W. Yang, B.-H. Xie, M.-B. Yang and Q. Fu, J. Mater. Chem. A, 2014, 2, 16989–16996 CAS.
- J. Chen, X.-C. Du, W.-B. Zhang, J.-H. Yang, N. Zhang, T. Huang and Y. Wang, Compos. Sci. Technol., 2013, 81, 1–8 CrossRef CAS.
- C. Zhang, P. Wang, C.-A. Ma, G. Wu and M. Sumita, Polymer, 2006, 47, 466–473 CrossRef CAS.
- B. Mathieu, C. Anthony, A. Arnaud and F. Lionel, J. Mater. Chem. C, 2015, 3, 5769–5774 RSC.
- Y. Pan, X. Liu, X. Hao, Z. Starý and D. W. Schubert, Eur. Polym. J., 2016, 78, 106–115 CrossRef CAS.
- Q. Cao, Y. Song, Y. Tan and Q. Zheng, Carbon, 2010, 48, 4268–4275 CrossRef CAS.
- Z. Yuan and B. D. Favis, AIChE J., 2005, 51, 271–280 CrossRef CAS.
Footnote |
| † Electronic supplementary information (ESI) available. See DOI: 10.1039/c7cp07493j |
| This journal is © the Owner Societies 2018 |

