A high-performance electrochemical supercapacitor based on a polyaniline/reduced graphene oxide electrode and a copper(II) ion active electrolyte
Yangxi
Luo
a,
Qin’e
Zhang
b,
Wenjing
Hong
 ac,
Zongyuan
Xiao
*a and
Hua
Bai
 *bc
*bc
aCollege of Chemistry and Chemical Engineering, Xiamen University, Xiamen, 361005, P. R. China. E-mail: xiaozy@xmu.edu.cn
bCollege of Materials, Xiamen University, Xiamen, 361005, P. R. China. E-mail: baihua@xmu.edu.cn
cGraphene Industry and Engineering Research Institute, Xiamen University, 361005, P. R. China
First published on 27th November 2017
Abstract
Active electrolyte enhanced supercapacitors (AEESCs) have received increasing attention because of their large specific capacitance and easy fabrication process. The better matching between the active electrolyte and the counter electrode and the slow self-discharge rate are the challenges of this type of supercapacitor. In this paper, a novel AEESC with polyaniline/reduced graphene oxide hydrogel (PANI/RGOHG) as the anode and Cu(II) ions as the cathodic active electrolyte is constructed. Experimental results demonstrate that the electrode potentials of PANI and Cu(II) can match perfectly, thus the device has a wide working voltage range. Because of the large specific capacitance of both PANI and Cu(II), a high average specific capacitance of a single electrode of 1120 F g−1 at 2.6 A g−1 is achieved. Meanwhile, self-discharge is also suppressed because the reduction product of Cu(II) is immobilized on the electrode. These results demonstrate that the performance of AEESCs strongly depends on the choice of a suitable electrode material, and also reveal that Cu(II) is a promising cathodic active electrolyte for AEESCs.
Introduction
Supercapacitors (SCs) have been attracting significant attention because of their large power density, long cycle life and high reliability.1–3 According to energy storage mechanisms, supercapacitors can be classified into two types: electric double layer capacitors and pseudo-capacitors.4 In particular, pseudo-capacitors have developed rapidly due to their much higher capacitance compared with the former type, because the energy is stored by fast surface redox reactions near the electrode surface. The surface redox reactions can be achieved by coating insoluble electroactive materials onto an electrode, or adding various soluble electroactive molecules or ions into an electrolyte, such as hydroquinone, iodide and methylene blue. The latter types of devices are the so-called active electrolyte enhanced supercapacitors (AEESCs).5–11 The fabrication of AEESCs is simple, but they possess high specific capacitance. For example, Senthilkumar et al. used hydroquinone as the active electrolyte in polyvinyl-alcohol H2SO4 gel electrolyte, and increased the specific capacitance of the device from 425 to 941 F g−1 (average specific capacitance of a single electrode).9Generally speaking, active electrolyte can efficiently increase the specific capacitance of one electrode, depending on its electrode potential. For example, hydroquinone is the reduced species of hydroquinone/p-benzoquinone redox couple, and can be oxidized at ∼0.5 V vs. SCE (saturated calomel electrode); thus it provides high specific capacitance at the anode.6 In order to further improve the overall performance of the device, active electrolyte should cooperate with a suitable counter electrode. However, most of the active electrolytes and electroactive electrode materials, such as conducting polymers, RuO2 and Ni(OH)2, work at a relatively positive potential. It is difficult to find matching active electrolyte and electrode material, which can yield both a large working voltage and high capacitance.
Herein, we designed an asymmetric AEESC, with a high-performance polyaniline/reduced graphene oxide hydrogel (PANI/RGOHG) as the anode, and CuSO4 as a redox active electrolyte to increase the cathode capacitance. In our previous work, we have demonstrated that Cu2+ is an excellent active electrolyte which works at a low potential of ∼0.1 V vs. SCE.12 Therefore, it is compatible with PANI, whose typical working potential range is −0.2 to 0.8 V vs. SCE. Since both the PANI/RGOHG anode and Cu2+ at the cathode have high specific capacitance, the asymmetric AEESC exhibits high capacitive performance. Besides, because the reduction product of Cu2+ is immobilized on the electrode, the fast self-discharge commonly occurring in the AEESC caused by the shuttle effect is also suppressed in our device.13
Results and discussion
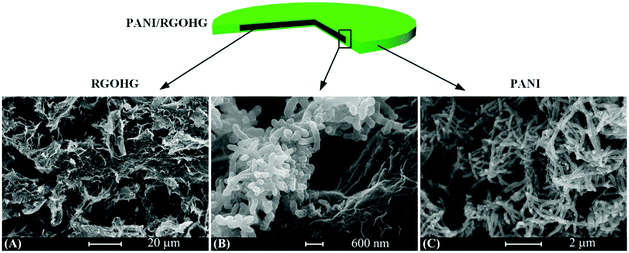
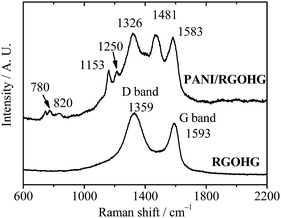
The PANI/RGOHG composite electrode was fabricated by electrochemical polymerization. A RGOHG slice was used as the matrix for electrochemical polymerization of PANI. After the polymerization, the surface of RGOHG is covered by a thick layer of green PANI, which can be observed by the naked eye. SEM images (Fig. 1) demonstrate the morphology of the as-prepared freeze-dried PANI/RGOHG, which has a phase-separated structure.17 The RGOHG matrix exhibits a 3D porous network structure (Fig. 1A), which is attributed to the self-assembly of RGO sheets during the reduction of GO.19 A layer of PANI was found to be coated on the RGOHG matrix. Magnified SEM images (Fig. 1B and C) show that the PANI layer is constructed by coral-like dendritic nanofibers with an average diameter of ∼100 nm. Therefore, the PANI/RGOHG electrode has a layered porous structure. We have reported in our previous work that such a structure could facilitate the electrolyte diffusion, and promote the rate performance of the electrode.17The formation of PANI was confirmed by Raman spectra (Fig. 2). The RGOHG spectrum displays two dominant D band at 1359 cm−1 and G band at 1597 cm−1, which are associated with disordered carbon and the in-plane vibration of the graphitic structure, respectively.20 The PANI/RGOHG spectrum shows an additional band related with PANI. The bands at 1153 and 1583 cm−1 are assigned to the C–H bending of the quinoid ring and the C![[double bond, length as m-dash]](https://www.rsc.org/images/entities/char_e001.gif) C stretching of the benzenoid ring,21 the bands around 780 and 820 cm−1 correspond to amine and imine deformation (C–N–C bending).22 The bands at 1326, 1481 and 1250 cm−1 were associated with the vibrations of the semiquinone radical. The C
C stretching of the benzenoid ring,21 the bands around 780 and 820 cm−1 correspond to amine and imine deformation (C–N–C bending).22 The bands at 1326, 1481 and 1250 cm−1 were associated with the vibrations of the semiquinone radical. The C![[double bond, length as m-dash]](https://www.rsc.org/images/entities/char_e001.gif) N stretching vibration of the quinonoid units and the C–N stretching mode of the polaronic units.23 These spectral data confirm the successful polymerization of PANI.
N stretching vibration of the quinonoid units and the C–N stretching mode of the polaronic units.23 These spectral data confirm the successful polymerization of PANI.
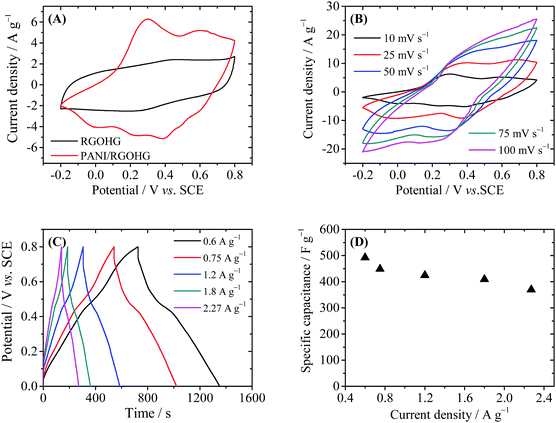
The electrochemical performance of PANI/RGOHG was then evaluated by cyclic voltammetry (CV) and galvanostatic charge/discharge (GCD) techniques in a three-electrode system (Fig. 3). As displayed in Fig. 3A, the CV curves of RGOHG are almost rectangular, with weak and wide redox waves around 0.4 V, which can be attributed to the redox of the residual oxygen-containing functional groups on RGO.19 In the CV curve of PANI/RGOHG, the current density was much higher than that of RGOHG, and the area of the CV curve was also larger. The results show clearly that the introduction of PANI could enhance the capacitive performance of RGOHG. The CV curves of PANI/RGOHG show two pairs of peaks, one pair at −0.1 to 0.3 V is attributed to the transition of PANI between thed leucoemereldine form and the emeraldine salt form,24 and the other pair at 0.3–0.6 V is attributed to the redox of degradation products of PANI.25 The peaks associated with the transition between emeraldine and pernigraniline are not observed because the potential range is not high enough.26,27Fig. 3B shows the detailed CV behaviors of PANI/RGOHG at different scan rates from 10 to 100 mV s−1. It was found that at a higher scan rate, the anodic peaks right-shifted to high potentials and the cathodic peaks shifted to low potentials, showing the characteristics of a quasi-reversible electrochemical process. The peak current increases linearly with the scan rate, suggesting that the electrode process is not controlled by diffusion. This is essential for high rate performance of the electrode.
Fig. 3C depicts the GCD curves of PANI/RGOHG between 0 and 0.8 V. The charge and discharge curves are symmetric, showing the high reversibility of the redox reaction of PANI. It was noted that the specific capacitance decreased slightly with the increase of current density (Fig. 3D). The specific capacitance of PANI/RGOHG can reach 492 F g−1 at 0.6 A g−1, and decreases to 365 F g−1 as the current density increases from 0.6 to 2.27 A g−1. The capacitive retention of 74% indicates a prominent rate capability of the PANI/RGOHG electrode. This good electrochemical performance of PANI/RGOHG is ascribed to its 3D porous structure which is in favor of the transport of electrolyte.28 We then used this PANI/RGOHG composite as the anode to construct an asymmetric supercapacitor. We have reported that Cu(II) is a good active electrolyte, whose electrode potential is about 0.1 V vs. SCE. Therefore, Cu2+/Cu can serve as a cathode redox couple to work with the PANI/RGOHG anode, forming an asymmetric supercapacitor with working voltage higher than 0.7 V. In order to increase the specific surface area, RGOHG was used as the porous current collector for Cu2+. The configuration of the device was PANI/RGOHG//1 M H2SO4 + 0.4 M CuSO4//RGOHG (Device 1). Another device with the same electrodes but 1 M H2SO4 as the inert electrolyte (Device 2), as well as two devices with pure RGOHG as the electrodes, namely, Device 3 (RGOHG//1 M H2SO4//RGOHG) and Device 4 (RGOHG//1 M H2SO4 + 0.4 M CuSO4//RGOHG), were fabricated for comparison.
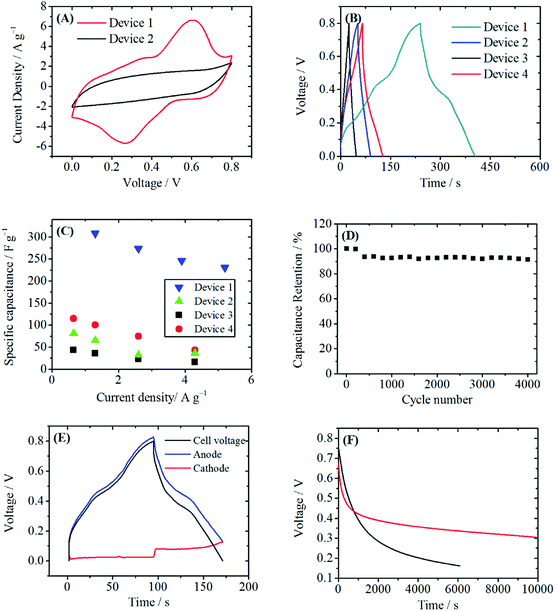
Fig. 4A shows the CV curves of Device 1 and Device 2. The current of the CV curve of Device 1 is larger than that of Device 2, indicating a higher specific capacitance of Device 1. In the CV curve of Device 1, a pair of redox peak at 0.3–0.6 V is observed, making the CV curve of Device 1 quite similar to that of the PANI/RGOHG composite electrode. In fact, on the cathode the following reaction will take place during the charge/discharge process:
| Cu2+ + 2e− = Cu |
The standard electrode potential of this reaction is 0.1 V vs. SCE.29 Because of the depolarization effect of this reaction, the potential of the cathode was fixed at ∼0.1 V vs. SCE. This made Cu2+/Cu@RGOHG behave like a reference electrode, and consequently the CV curve of Device 1 in fact reflects the electrochemical properties of the PANI/RGOHG anode, except for a small potential shift. Thus the peaks at 0.3–0.6 V are attributed to the redox of degradation products of PANI.
The GCD curves at a current density of 1 A g−1 are shown in Fig. 4B. There is a plateau at 0.4–0.5 V vs. SCE on the GCD curve of Device 1, corresponding to the redox peaks on the CV curve. This plateau makes a great contribution to the discharge time. As a result, the specific capacitance of Device 1 calculated from GCD curves are 307.9 F g−1 at 1.3 A g−1 and 230.6 F g−1 at 5.2 A g−1, as shown in Fig. 4C. If these data are converted into an average specific capacitance of a single electrode, high values of 1231.6 F g−1 at 2.6 A g−1 and 922.4 F g−1 at 10.4 A g−1 are obtained. As a comparison, the specific capacitance of Device 2 is only 68 F g−1 at 1.3 A g−1, corresponding to an average specific capacitance of a single electrode of 272 F g−1 at 2.6 A g−1. The specific capacitance was also much higher than those of Device 3 and Device 4. This significant enhancement of specific capacitance of Device 1 comes from a synergetic combination of Cu2+ and PANI. Fig. 4D demonstrates that after 4000 charge/discharge cycles, a capacitance retention of 91.4% was obtained in Device 1. Thus, Device 1 has good cyclic stability. In order to further investigate the working mechanism of Device 1, the electrode potentials of the anode and the cathode during the charge/discharge process were measured respectively. As shown in Fig. 4E, during the charge–discharge process, the potential shift of the anode (0.69 V) makes chief contribution to the increase of cell voltage, while the potential of the cathode remains stable (potential change: 0.05 V). This small potential change clearly demonstrates the depolarization effect of Cu2+. From the potential curve, the specific capacitance of the cathode was calculated to be 4107 F g−1. Such a high specific capacitance is attributed to the fast kinetics of Cu2+/Cu and a large specific surface area of the RGOGH current collector. Since the capacitance of the device is the total capacitance of the parallel-connected anode and cathode, the large specific capacitance of the cathode can significantly increase the capacitance of the device.
For most of the active electrolyte enhanced supercapacitors, the self-discharge (SDC) caused by the shuttle effect of the active electrolyte between the anode and the cathode is a serious problem. Here we evaluated the SDC curve of Device 1. As shown in Fig. 4F, after 6000 s, the voltage of Device 1 dropped from 0.8 V to 0.33 V. The SDC rate was even slower than that of Device 3, which was a double electric layer capacitor without active electrolyte. For Device 3, the self-discharge from 0.8 V to 0.33 V took only 1408 s. It should be noted that the absolute SDC rate depends on the fabrication and the capacitance of the device, but the above comparison clearly reveals that Cu2+ does not accelerate the SDC process. In fact, during the charge process, Cu2+ is reduced to metal Cu, which is insoluble in the electrolyte and is immobilized on RGOHG. No shuttle of Cu will occur, and consequently the charges stored by Cu2+/Cu will not be lost. The slow SDC rate is essential for the practical application of supercapacitors.
Experimental
Material
GO was prepared using a modified Hummers method according to the literature.14 Natural graphite powders, H2SO4 (98%), hydrazine monohydrate (85%), aniline (AR) and copper sulfate (AR) were purchased from Sinopharm Chemical Reagent Co., Ltd. Dialysis Membranes (8000–12![[thin space (1/6-em)]](https://www.rsc.org/images/entities/char_2009.gif) 000) were purchased from Shanghai Yuanye Bio-Technology Co., Ltd.
000) were purchased from Shanghai Yuanye Bio-Technology Co., Ltd.
Preparation of RGOHG
RGOHG was synthesized by a hydrothermal reaction.15,16 Firstly, 15 mL of GO aqueous dispersion (2 mg mL−1) was sealed in a 25 mL Teflon-lined autoclave and heated at 180 °C for 12 h. After the autoclave was cooled to room temperature, the black RGOHG monolith in the autoclave was collected and treated by hydrazine monohydrate (50%) at 95 °C for 8 h. Finally, the obtained RGOHG was dialyzed in pure water for 24 h.Preparation of the PANI/RGOHG composite
The electrochemical polymerization of the PANI/RGOHG composite was carried out in a three-electrode system by electrochemical polymerizing aniline onto the RGOHG electrode.17 The RGOHG discs act as both the working electrode and the counter electrode, and SCE as the reference electrode. RGOHG discs were prepared by directly compressing the as-prepared wet RGOHG monolith at 0.16 MPa with the final thickness of the RGOHG disc of about 1 mm. The CV technique was used to polymerize aniline in a voltage range between −0.2 and 0.8 V vs. SCE at 10 mV s−1 in the electrolyte containing 0.4 M aniline and 1 M H2SO4. After deposition, the electrode was immersed in 1 M H2SO4 to remove the aniline monomer.Fabrication and test of the supercapacitors
A two-electrode device configuration was used in this work, and the PANI/RGOHG composite was chosen as the working electrode, RGOHG discs as the counter electrode, two pieces of Pt foil (1 × 2 cm2) were used as current collectors. A silicone ring was used to seal the device by sandwiching between the Pt foil, with graphene gel, a separator, and the electrolyte solution accommodated within it. The electrolyte solution was 1 M H2SO4 + 0.4 M CuSO4. For comparison, devices with 1 M H2SO4 as the electrolyte were also assembled. The electrode process of a single electrode was investigated in a three-electrode cell. To do so, the two-electrode device was immersed into an electrochemical cell filled with the same electrolyte as used in the device. To ensure the connectivity of the electrolyte in the device and the cell, two openings were cut on the silicone ring. The two electrodes of the device were used as working and counter electrodes, and SCE was utilized as the reference electrode.12Before testing the device was activated by cyclic voltammetry cycling from 0 V to 0.8 V for 50 cycles.18 The specific capacitance of the device was calculated from galvanostatic charge–discharge (GCD) curves according to the following equations:
 | (1) |
 | (2) |
 | (3) |
 | (4) |
Characterization
The structure of PANI/RGOHG was characterized using a HITACHI S-4800 scanning electron microscope. All the electrochemical measurements were performed on a CHI 760E electrochemical workstation. Raman spectra were collected from ID Spec ARCTIC confocal Raman Spectroscopy.Conclusions
We designed and fabricated a novel AEESC, based on the PANI/RGOHG anode and the Cu2+ active electrolyte. The Cu2+/Cu couple has a relatively low electrode potential of ∼0.1 V vs. SCE on the RGOHG electrode, thus it can match the PANI/RGOHG anode, which works in the voltage range 0–0.8 V vs. SCE. A high specific capacitance of 307.9 F g−1 at 1.3 A g−1 was obtained. Mechanism investigation reveals that, the specific capacitance of Cu2+ at the cathode is as high as 4107 F g−1, thus the specific capacitance of the device approaches that of the PANI/RGOHG anode. Furthermore, owing to the immobility of the reduction product of Cu2+, our AEESC showed a slow SDC rate. This work demonstrates that Cu2+ is a superb cathodic active electrolyte, and by carefully choosing the anode material, high-performance asymmetric AEESCs could be constructed.Conflicts of interest
There are no conflicts to declare.Acknowledgements
This work was supported by the National Natural Science Foundation of China (21774104).Notes and references
- D. Yu, Q. Qian, L. Wei, W. Jiang, K. Goh, J. Wei, J. Zhang and Y. Chen, Chem. Soc. Rev., 2015, 44, 647–662 RSC.
- L. Wang, X. Feng, L. Ren, Q. Piao, J. Zhong, Y. Wang, H. Li, Y. Chen and B. Wang, J. Am. Chem. Soc., 2015, 137, 4920–4923 CrossRef CAS PubMed.
- J. R. Miller and P. Simon, Science, 2008, 321, 651 CrossRef CAS PubMed.
- Z. Yu, L. Tetard, L. Zhai and J. Thomas, Energy Environ. Sci., 2015, 8, 702–730 CAS.
- D. W. Wang, F. Li, J. Zhao, W. Ren, Z. G. Chen, J. Tan, Z. S. Wu, I. Gentle, G. Q. Lu and H. M. Cheng, ACS Nano, 2009, 3, 1745–1752 CrossRef CAS PubMed.
- S. Roldán, C. Blanco, M. Granda, R. Menéndez and R. Santamaría, Angew. Chem., Int. Ed., 2011, 50, 1699–1701 CrossRef PubMed.
- S. T. Senthilkumar, R. K. Selvan, Y. S. Lee and J. S. Melo, J. Mater. Chem. A, 2013, 1, 1086–1095 CAS.
- S. Roldán, M. Granda, R. Menéndez, R. Santamaría and C. Blanco, J. Phys. Chem. C, 2011, 115, 17606–17611 Search PubMed.
- S. T. Senthilkumar, R. K. Selvan, N. Ponpandian and J. S. Melo, RSC Adv., 2012, 2, 8937–8940 RSC.
- S. Roldán, M. Granda, R. Menéndez, R. Santamaría and C. Blanco, Electrochim. Acta, 2012, 83, 241–246 CrossRef.
- H. Yu, L. Fan, J. Wu, Y. Lin, M. Huang, J. Lin and Z. Lan, RSC Adv., 2012, 2, 6736–6740 RSC.
- L. B. Chen, H. Bai, Z. F. Huang and L. Li, Energy Environ. Sci., 2014, 7, 1750–1759 CAS.
- L. B. Chen, Y. Q. Chen, J. F. Wu, J. W. Wang, H. Bai and L. Li, J. Mater. Chem. A, 2014, 2, 10526–10531 CAS.
- W. S. Hummers, Jr. and R. E. Offeman, J. Am. Chem. Soc., 1958, 80, 1339 CrossRef.
- H. Bai, C. Li, X. L. Wang and G. Q. Shi, J. Phys. Chem. C, 2011, 115, 5545–5551 CAS.
- Y. X. Xu, Q. Wu, Y. Q. Sun, H. Bai and G. Q. Shi, ACS Nano, 2010, 4, 7358–7362 CrossRef CAS PubMed.
- J. F. Wu, Q. E. Zhang, A. A. Zhou, Z. F. Huang, H. Bai and L. Li, Adv. Mater., 2016, 28, 10211–10216 CrossRef CAS PubMed.
- M. D. Stoller and R. S. Ruoff, arXiv.org, e-Print Arch., Condens. Matter, 2010, 1–14 Search PubMed.
- K. X. Sheng, Y. X. Xu, C. Li and G. Q. Shi, Carbon, 2011, 26, 9–15 CrossRef CAS.
- K. Ai, Y. Liu, L. Lu, X. Cheng and L. Huo, J. Mater. Chem., 2011, 21, 3365–3370 RSC.
- G. Louarn, M. Lapkowski, S. Quillard, A. A. Proń and S. Lefrant, J. Phys. Chem., 1996, 100, 6998–7006 CrossRef CAS.
- F. Yakuphanoglu, I. S. Yahia, G. Barim and B. F. Senkal, Synth. Met., 2010, 160, 1718–1726 CrossRef CAS.
- M. Cochet, G. Louarn, S. Quillard, J. P. Buisson and S. Lefrant, J. Raman Spectrosc., 2000, 31, 1041–1049 CrossRef CAS.
- Y. Liu, Y. Ma, S. Guang, H. Xu and X. Su, J. Mater. Chem. A, 2014, 2, 813–823 CAS.
- Q. E. Zhang, A. A. Zhou, J. J. Wang, J. F. Wu and H. Bai, Energy Environ. Sci., 2017, 10, 2372–2382 CAS.
- Y. H. Lee, C. Z. Chang, S. L. Yau, L. J. Fan, Y. W. Yang, L. Y. Ou Yang and K. Itaya, J. Am. Chem. Soc., 2009, 131, 6468–6474 CrossRef CAS PubMed.
- H. P. Cong, X. C. Ren, P. Wang and S. H. Yu, Energy Environ. Sci., 2013, 6, 1185–1191 CAS.
- J. Luo, W. Zhong, Y. Zou, C. Xiong and W. Yang, J. Power Sources, 2016, 319, 73–81 CrossRef CAS.
- S. T. Senthilkumar, R. K. Selvan and J. S. Melo, J. Mater. Chem. A, 2013, 1, 12386–12394 CAS.
| This journal is © the Owner Societies 2018 |


