 Open Access Article
Creative Commons Attribution 3.0 Unported Licence
Modeling study of the anti-knock tendency of substituted phenols as additives: an application of the reaction mechanism generator (RMG)†
Peng
Zhang‡
 a,
Nathan W.
Yee‡
b,
Sorin V.
Filip
 c,
Casey E.
Hetrick
 d,
Bin
Yang
 a and
William H.
Green
 *b
*b
aCenter for Combustion Energy and Department of Thermal Engineering, Tsinghua University, Beijing 100084, China
bDepartment of Chemical Engineering, Massachusetts Institute of Technology, 77 Massachusetts Avenue, Cambridge, MA 02139, USA. E-mail: whgreen@mit.edu
cBP Formulated Products Technology, Research & Innovation, Pangbourne, UK
dBP Center of Expertise – Applied Chemistry & Physics, Naperville, IL, USA
First published on 2nd January 2018
Abstract
This work presents kinetic modeling efforts to evaluate the anti-knock tendency of several substituted phenols if used as gasoline additives. They are p-cresol, m-cresol, o-cresol, 2,4-xylenol, 2-ethylphenol, and guaiacol. A detailed kinetic model was constructed to predict the ignition of blends of the phenols in n-butane with the help of reaction mechanism generator (RMG), an open-source software package. The resulting model, which has 1465 species and 27![[thin space (1/6-em)]](https://www.rsc.org/images/entities/char_2009.gif) 428 reactions, was validated against literature n-butane ignition data in the low-to-intermediate temperature range. To rank the anti-knock tendency of the additives, engine-like simulations were performed in a closed adiabatic homogenous batch reactor with a volume history derived from the pressure profile of a real research octane number (RON) engine test. The ignition timings of the additive blends were compared to that of primary reference fuels (PRFs) to quantitatively predict the anti-knock ability. The model predictions agree well with experimental determinations of the changes in RON induced by the additives. This study explains the chemical mechanism by which methyl-substituted phenols increase RON, and demonstrates how fundamental chemical kinetics can be used to evaluate practical fuel additive performance.
428 reactions, was validated against literature n-butane ignition data in the low-to-intermediate temperature range. To rank the anti-knock tendency of the additives, engine-like simulations were performed in a closed adiabatic homogenous batch reactor with a volume history derived from the pressure profile of a real research octane number (RON) engine test. The ignition timings of the additive blends were compared to that of primary reference fuels (PRFs) to quantitatively predict the anti-knock ability. The model predictions agree well with experimental determinations of the changes in RON induced by the additives. This study explains the chemical mechanism by which methyl-substituted phenols increase RON, and demonstrates how fundamental chemical kinetics can be used to evaluate practical fuel additive performance.
1. Introduction
Additives are frequently incorporated into commercial formulations because they empirically improve the performance of the product. It is thought that many fuel additives work by altering the reaction kinetics, but for a newly developed additive, the exact chemical mechanism is usually unknown. Better understanding of the mechanism of action of additives is expected to accelerate the development of better fuels and other products, and to facilitate the introduction of new additives with environmental advantages such as those derived from waste biomass. Historically, the complexity of this kinetics has been a major challenge, but recent advances in computational methods for chemical kinetics make it possible to tackle these real-world problems.Engine knock, an undesirable combustion phenomena caused by the auto-ignition of the unburned mixture (end gas), significantly limits the efficiency of spark-ignition engines.1 Therefore, the anti-knock tendency, which is described by octane number (ON), is a good criterion to screen the candidates in the development of additives and drop-in fuels. However the standard octane rating procedures, including the rating of research octane number (RON)2 and motor octane number (MON),3 are capital and time intensive. First, the new proposed additives must be synthesized and purified, and then it requires a trained technician to operate a specially made cooperative fuel research (CFR) engine following a complicated empirical rating protocol.2,3 After all of those efforts, the only result is a single number without revealing any mechanistic information. Although there are some studies trying to correlate the ON with other observables such as infrared spectroscopy,4 distillation curve,5 and dielectric spectroscopy,6 these methods are developed by fitting the existing ON database; no studies have reported a method for accurately predicting the ON of fuel mixtures containing additives not yet synthesized. Even a perfect method for predicting ON would not provide perfect ranking of fuels, since fuels which have the same ON can have very different ignition behavior in modern engines.7,8 An ideal model would be able to predict the ignition delay of any fuel mixture at any engine-relevant condition, not just at the conditions of the RON or MON test.
In an engine, the end gas is compressed by the piston motion and by the flame propagation around top-dead-center (TDC). Knocking will occur if the end-gas auto-ignites before being consumed by the flame.9–11 Therefore, the anti-knock tendency is mainly determined by the ignition delay time and the flame speed, which are both controlled by the combustion kinetics of the fuel. Consequently, the anti-knock tendency of an additive can be studied by simulation if (1) its combustion kinetics is known and (2) one can accurately estimate the conditions that the end gas experienced in the CFR test.
The former problem and the need for a model accurate at many reaction conditions can be solved by the reaction mechanism generator (RMG),12 which is an open-source software package designed to automatically construct kinetic models using a flux-based algorithm for model expansion. As demonstrated in previously published papers,13–15 a reasonable model can be obtained with minimal manual work, making it feasible to study a series of molecules in a short time. Moreover, with the help of the kinetic model, the chemical origin of the anti-knock tendency of specific species can be analyzed, which will benefit the design of fuel additives in the future.
To estimate conditions that the end gas experienced in the CFR test, some studies16–18 simply correlated the ON with the ignition delay in a constant volume batch reactor. However, more rigorous treatment also considers the actual pressure and temperature history experienced by the end gas. Westbrook et al.19 suggested incorporating a pressure profile from a real engine test into a perfect stirred reactor (PSR) to study the relation between chemical structure and octane sensitivity. Similarly, Badra et al.18 proposed a variable volume simulation, which incorporates a pressure-derived-volume profile into a homogenous batch reactor, to correlate the ignition timing with the RON and MON of the fuel. A variable volume similar to that suggested by Badra et al.18 is used in this work to study the anti-knock tendency of phenolics.
In the following sections, the above method will be applied to predict the anti-knock tendency of several substituted phenols, which are important products derived from the pyrolysis oil of lignocellulosic-biomass and have the potential to be used as drop-in fuels or fuel additives.20–22 The methodology for model generation is introduced first. The base fuel model is validated with the literature data, and the effect variable volume condition has on base fuel chemistry is discussed. Next, the predicted changes in ignition delay at constant volume adiabatic conditions induced by adding each of the six phenols are presented. Then, the anti-knock performance for each phenol is predicted under variable-volume RON conditions, and the predictions are compared with experimental RON data on these additives blended in gasoline. Finally, the chemical mechanism causing the anti-knock property for each substituted phenol is discussed.
ESI† includes derivations for equations used to calculate volume profiles used in the engine-like simulation, a table of said volume profile, and sensitivity analysis for phenolics not discussed in detail in the main text. It also includes sample RMG input files used to generate the mechanisms, CHEMKIN files of the mechanism used in this work, and the species dictionary of the mechanism.
2. Methodology
2.1 Detailed kinetic modeling
RMG12 is an automated reaction mechanism generator using a flux-based model enlargement algorithm. First, it reacts inputted core species at specified conditions to propose possible reactions and products in the model edge. The importance of an edge species is judged by calculating the chemical flux of the core towards this edge species in homogenous isothermal reactors. When a certain chemical flux is exceeded, an edge species (and all associated reactions) are moved to the core to subsequently generate additional edge products and reactions. Then, the simulation is restarted with the revised core. This cycle of adding core species continues until some convergence criterion, usually conversion of a key reactant, is reached. The converged core model is then exported as an RMG generated detailed kinetic model. In the above process, the thermochemistry of the generated species are mainly estimated by the Benson group additivity scheme,23 which has been extensively validated and used in the thermochemistry estimation23,25,26 and was stated to have an error of less than 1 kcal mol−1 for most species.23 The kinetics of the generated reactions are estimated by mapping to rate rule templates or training reactions collected in the database. More details of RMG can be found in the literature.12,24The model used in this study was generated by RMG-Py (version 2.0.0) and RMG-database (version 2.0.0) with some additions. Special attention was paid to the thermochemistry estimation of substituted aromatics and the reactivity of the cyclic structures. Non-nearest-neighbor interactions for substituted aromatic compounds25 and substituted aromatic radicals26 were implemented into the Benson group additivity scheme to improve its accuracy. Samples of the RMG input files are included in the ESI.† Other than the libraries listed below, no other special treatments of RMG or quantum calculations were employed in this study. This ensures the method proposed in this study can be easily applied to the study of the anti-knock tendency of other compounds.
In this study, n-butane is selected as the base fuel because of the relatively small size and moderate RON of 94,27 which is similar to that of practical gasolines.27 The n-butane model is generated under conditions of 1 bar and 650–2000 K. Most of the reaction rate coefficients are estimated using high-P-limit Arrhenius forms in the RMG database, many derived from CBS-QB3 TST calculations. Foundational Fuel Chemistry Model Version 128 and the H2/O2 mechanism from Burke et al.29 were used as a seed mechanism to include pressure dependence for small species. Additionally, a few sub-mechanisms were used as libraries to provide better rate coefficient estimates for selected reactions: the methyl formate mechanism of Dooley et al.30 provides some of the low temperature chemistry for butane oxidation, rates for phenol decomposition by Brezinsky et al.,31 and calculated rates for cyclopentadienyl pyrolysis by Long et al.32
The models for the blends of substituted phenols were generated using the aforementioned n-butane inputs as a base. Six individual sub-models were respectively generated for the additive/butane blends, each with 2% mole fraction of the additive. The reactor conditions were 20 bar and 650–2000 K, with equivalence ratio unity. The six sub-models were merged together to obtain a unified model, which will be used in the following analysis. Finally, some species (and corresponding reactions including these species) were manually removed from the final merged mechanism. The removed species included polycyclic species and bi-radicals whose thermochemistry the current version of RMG poorly estimates. There is little flux towards these species, consequently, the removal of these species barely changes the simulation results. The model sizes of the sub-models and the merged model are shown in Table 1. The chemical structures of the important chemicals in this study are shown in Table 2. The final merged model is provided in the ESI.†
| Fuel additive | Number of species | Number of reactions |
|---|---|---|
| p-Cresol | 353 | 10![[thin space (1/6-em)]](https://www.rsc.org/images/entities/char_2009.gif) 220 220 |
| m-Cresol | 490 | 10![[thin space (1/6-em)]](https://www.rsc.org/images/entities/char_2009.gif) 092 092 |
| o-Cresol | 328 | 6690 |
| 2,4-Xylenol | 406 | 7461 |
| 2-Ethylphenol | 459 | 10![[thin space (1/6-em)]](https://www.rsc.org/images/entities/char_2009.gif) 080 080 |
| Guaiacol | 549 | 11![[thin space (1/6-em)]](https://www.rsc.org/images/entities/char_2009.gif) 607 607 |
| Merged model | 1465 | 27![[thin space (1/6-em)]](https://www.rsc.org/images/entities/char_2009.gif) 428 428 |
2.2 Engine-like simulation
The aim of this simulation is evaluating the effect on the reactivity when 2% of the fuel is replaced by the additives. A full engine CFD simulation is infeasible due to the size of the mechanism, but a constant volume adiabatic batch reactor would be too simple considering real engines have highly dynamic pressure and temperature profiles. Therefore, an engine-like simulation is needed to keep the simplicity of the adiabatic batch reactor but include the pressure and temperature profile from the real engine test.Such engine-like simulation is based on the understanding of a simplified in-cylinder scenario of the RON test. After the intake valve is closed in the RON test, the mixture is compressed to a high pressure, high temperature condition by the piston. Then the spark plug ignites the mixture, initiating a flame from the spark plug that propagates to the cylinder wall. Due to the flame propagation, the in-cylinder pressure continues increasing and compressing the end gas. Knocking occurs if the end gas auto-ignites before being consumed by the flame. Therefore, the critical condition would be the auto-ignition and the completion of fuel consumption by the flame occurring at the same time. It is assumed the laminar flame speed and the specific heat ratio of the tested mixtures are similar because of the similar fuel compositions. Consequently, the environment of the end gas can be characterized by a pressure profile from a RON test with the following assumptions:
(1) Homogenous assumption: the end gas is spatially homogenous.
(2) Adiabatic assumption: the end gas is adiabatically compressed by the piston motion and by the expansion of the burned gases in other parts of the cylinder.
Pressure profiles of RON tests of PRF100 was obtained from a CFR engine at UC Berkeley. The compression ratio is 9.21. The spark timing is 15 crank angle degrees (CAD) before top-dead-center (BTDC). The intake valve close timing is 34 CAD after bottom-dead-center (ABDC). Therefore, the pressure history from 146 CAD BTDC (i.e. 34 CAD ABDC) to 50 CAD after top-dead-center (ATDC) is used in the following simulation. Fig. 1 shows the pressure profile averaged from 500 cycles.
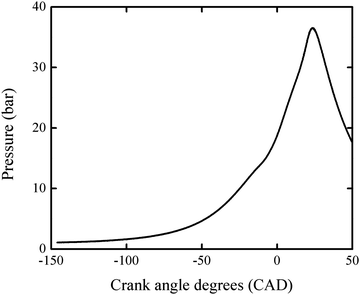 | ||
| Fig. 1 The pressure profile obtained from a RON test of PRF100 averaged over 500 cycles. This profile was used in the engine-like simulation. | ||
Based on the adiabatic assumption, the pressure profile was converted to a volume profile33 using the equations:
 | (1) |
 | (2) |
In the above equations, γ was calculated for a stoichiometric mixture of iso-octane and varied with temperature, but not composition, over time. This profile was imported into an adiabatic batch reactor in Chemkin-PRO34 to simulate the behavior of the end gas. In the simulation, the initial pressure was 1.09 bar, which was the experimental pressure at valve closing (−146 CAD BTDC). The initial temperature is not available from the experiment because the standard RON test protocol only ensures the intake air temperature is 325 K in the manifold; the temperature in the cylinder is not measured. Heat transfer from the residual gas and cylinder walls is expected to heat the intake air to a higher temperature around valve closing. Therefore, we tuned the initial temperature at −146 CAD BTDC in the PRF100 simulation to approximately match the simulated end gas's ignition time with the time of the measured maximum pressure in the experiment. The mechanism used in the tuning process is the PRF100 (i.e. iso-octane) mechanism from the Lawrence Livermore National Laboratory (LLNL)35 and resulted in a tuned initial temperature of 400 K, which is used in all of the engine-like simulations in this study.
The timing of the ignition in the engine-like simulation is related to the RON of the fuel. While the actual compression ratios and pressure traces vary slightly with fuel composition, it is still relatively accurate to use fixed reaction conditions for the study of the additives because the additive only accounts for 2% in the total fuel, and flame speed is known to be relatively insensitive to fuel composition.36 Later ignition under these fixed conditions corresponds to better anti-knock behavior.
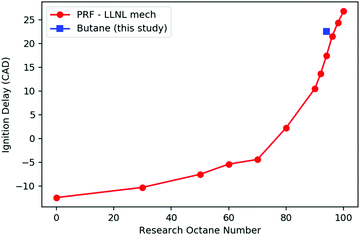
Fig. 2 shows the computed ignition timing of PRFs and n-butane versus RON in this variable volume adiabatic batch reactor, using the LLNL PRF model35 and the merged butane model described in Section 2.1. Ignition delay in these simulations is defined as time when T reaches 1500 K. As expected, the PRFs with lower RONs ignite faster than those with higher RONs. In the range of RON 90–100, the timing of the ignition varies nearly linearly with RON. By interpolating the predicted ignition timing of n-butane with those of PRFs, the RON of n-butane is predicted to be 97.0, which is reasonably close to its real experimental RON of 94,27 indicating the good consistency of the merged kinetic model constructed here and the LLNL PRF model.
3. Results and discussion
3.1 Prediction of the ignition of the base fuel
Fig. 3 compares the experimental ignition delays of n-butane reported by Healy et al.37 with the prediction of the merged model at φ = 1 and diluent to oxygen ratio of 3.76. The experiments with ignition delay longer than 5 ms were conducted in a rapid compression machine (RCM). Data points with ignition delay shorter than 5 ms were conducted in a shock tube (ST). The simulations were performed using Cantera38 in a constant volume adiabatic homogenous batch reactor with nitrogen as a diluent without accounting for heat losses. In this simulation, ignition time was taken to be the time when dP/dt reached its maximum. The negative temperature coefficient (NTC) phenomena is successfully captured by the simulation, although it occurs at a lower temperature in the predictions than in experiments, likely because the prediction does not account for heat loss. The simulated ignition delays mostly agree within a factor of three with the experimental data, which is reasonably good considering the simplified model, experimental uncertainties and many imperfectly known rate and thermochemistry parameters.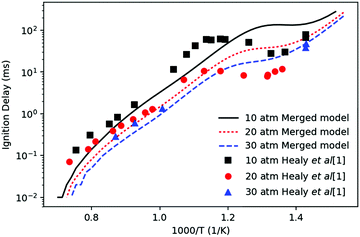 | ||
| Fig. 3 Comparison of the simulated ignition delays (lines) of n-butane with the experimental data (points) by Healy et al.37 Equivalence ratio is 1. Diluent to oxygen ratio is 3.76 corresponding to that of air. The diluent is nitrogen in the simulation. | ||
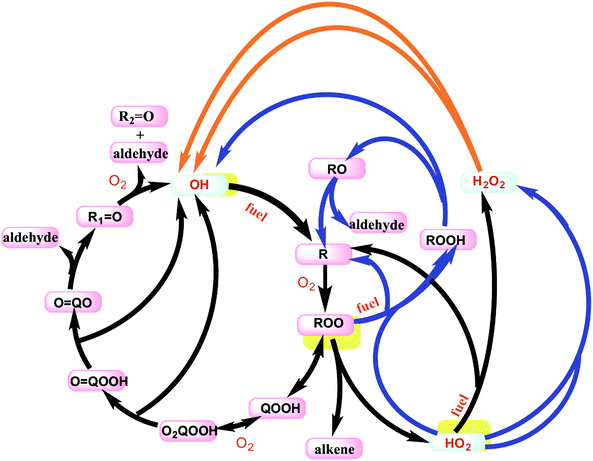
The low temperature oxidation of butane is only briefly discussed here, but a more detailed discussion for analogous pathways in propane is given in Merchant et al.39 The main reaction pathways are outlined in Fig. 4 to reveal the importance of the OH radical in driving the low temperature combustion chemistry. At temperatures below 800 K, the fuel consumption relies heavily on reactions with OH radical and to a much smaller degree HO2 radical. In the low temperature regime, one OH radical is consumed to create the initial radical of the fuel, and then secondary chemistry can result in formation of up to three more OH radicals, as shown by the auto-catalytic cycle shown with the black arrows in Fig. 4. Above ∼690 K, this reaction pathway creates less than one OH for each OH inputted because two key reactions shift away from this cycle: QOOH begins to favor HO2 + alkene formation, and O2QOOH begins to decompose back to QOOH + O2. From 690 K < T < 800 K, the system loses more OH than it produces which is the main cause of the NTC effect and two-stage ignition. At these temperatures, the reactions shown with blue arrows in Fig. 4 become dominant. The net effect of these reactions is the build-up of H2O2 and the general build-up of heat from many exothermic reactions. After temperatures reach about 800 K, the decomposition of H2O2 to OH becomes favorable enough that the net flux of OH becomes strongly positive. This influx of OH radicals propels the system to final ignition.
3.2 Comparison of RCM and engine-like auto-ignition
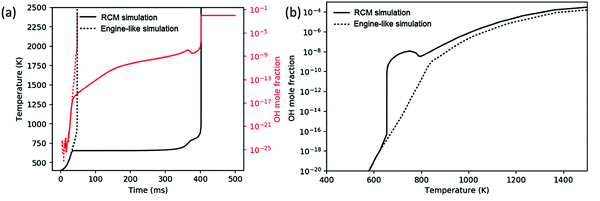
While all three chemistry regimes discussed in Section 3.1 are controlling at various times in a constant-volume reactor, it is unclear which, if any, regimes are rate-limiting for the engine-like simulation. Comparing a simulation of the analogous RCM to the engine-like simulation gives a good basis for discussion. The RCM simulation uses the same volume profile derived for the engine-like simulation but stops compression at −55 CAD (t = 32 ms), at which time the temperature is approximately T = 650 K. The engine-like simulation completes the full engine stroke (with additional compression from the burning gas after −15 CAD) through 50 CAD. Fig. 5(a) shows temperature profile of an RCM and engine-like simulation for pure butane. The RCM simulation takes approximately 10 times longer to ignite than the engine-like, and spends significantly more time below 800 K. In an RCM, the ignition is successively limited by the three cycles shown in Fig. 4: chain-branching through ketohydroperoxide intermediates, heat generation by secondary chemistry, and finally OH dissociation from H2O2. On the other hand, the engine-like simulation seems to push past the first two regimes, as even pure nitrogen reaches a max temperature of ∼1100 K in these conditions.This contrast can be further seen in Fig. 5(b), which presents the OH mole fraction as a function of temperature. For the RCM simulation, the OH mole fraction peaks around 750 K (after the ketohydroperoxide cycle has become unfavorable), and does not start increasing again until after 800 K. Meanwhile in the engine-like simulation, the mole fraction of OH increases monotonically, but is much lower for 650 K < T < 800 K compared to RCM. Above 800 K, the OH mole fraction experiences similar increases in the two simulations. This comparison shows that the engine-like simulation rushes through the first two regimes, but experiences similar radical growth during the regime controlled by H2O2 dissociation. As a result, the engine-like simulation will build up less H2O2 prior to the third regime.
3.3 Prediction of the anti-knock tendency
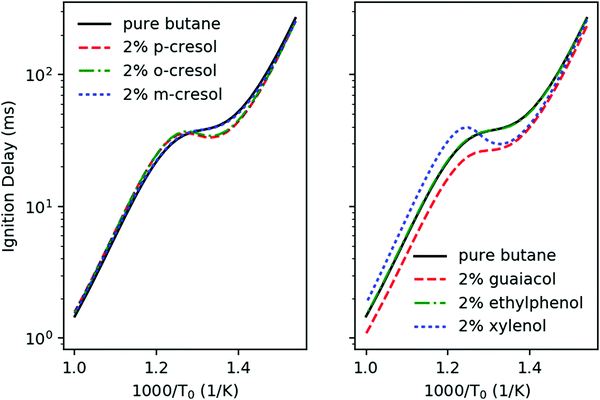
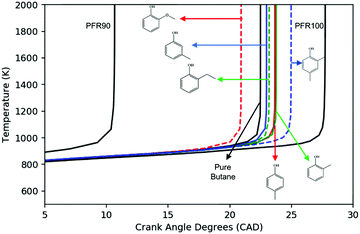
Fig. 6 shows the simulated ignition delays at constant volume adiabatic conditions of stoichiometric ϕ = 1 mixtures in air of the different additive/n-butane blends with 2 mol% additive in fuel. The initial conditions are P0 = 20 bar and T0 = 650–1000 K, and we take the ignition time to be when dP/dt achieves its maximum. Ethylphenol and m-cresol are predicted to have very little effect on the ignition throughout all temperature ranges. Guaiacol has ignition enhancing effects throughout all temperature ranges. The other three additives, p-cresol, o-cresol, and xylenol have a more complex effect. They accelerate ignition for T0 < 780 K. However, above 780 K these three additives slow ignition. Based solely on these simulations, it is unclear how to rank the anti-knock behavior of the additives. A real engine will cross the entire temperature range during a piston cycle, but analysis from Section 3.1 suggests that the temperature range above 800 K is most relevant to the CFR engine.To address the shortcomings of the constant-volume simulation, engine-like simulations following the methodology outlined in Section 2.2 were performed to investigate the ignition timing of the mixture when being exposed to the end gas condition. All simulations were performed at ϕ = 1, T0 = 400 K, P0 = 1.09 bar (taken from experimental CFR data) and a blending ratio of 2 mol% additive in n-butane. Fig. 7 shows the temperature history of the simulations. Guaiacol ignites fastest of all of the additive blends, which is consistent with the constant volume simulation results. Both m-cresol and ethylphenol have small effects, but do provide some anti-knock behavior. o-Cresol and p-cresol have about the same anti-knock behavior which agrees well with the constant-volume simulation. Among all of the additive blends, 2,4-xylenol has the longest ignition delay, representing the best anti-knock capability. Based on Fig. 7, the anti-knock tendency of the additives can be arranged as: 2,4-xylenol > p-cresol = o-cresol > m-cresol = 2-ethylphenol > guaiacol. This ranking suggests that constant-volume simulations starting above 800 K are more relevant to the RON when RON > 90.
Following the RON test protocol, engine experiments were performed in a CFR engine to test the anti-knock tendency of the additives. Experimental RON's measured from the CFR test are summarized in Table 3. The blends were tested over several days explaining the slight difference in measured base fuel RON. However, the base fuel was tested just before each blend to give accurate ΔRON. Based on these experiments, the additives from most to least anti-knock performance are: 2,4-xylenol > p-cresol > o-cresol > m-cresol > 2-ethylphenol > guaiacol. We note that experimental determinations of ΔRON between fuel blends have uncertainty of about ±0.5.
| Computed butane “RON” | 97.0 | 97.0 | 97.0 | 97.0 | 97.0 | 97.0 |
| Computed blended “RON” | 98.5 | 97.8 | 97.8 | 97.3 | 97.5 | 96.1 |
| Computed Δ“RON” | 1.5 | 0.8 | 0.8 | 0.3 | 0.5 | −0.9 |
| Experimental E0 base fuel RON | 95.6 | 95.6 | 95.6 | 95.7 | 95.7 | 95.7 |
| Experimental blended RON | 97.3 | 97.2 | 96.9 | 96.6 | 96.2 | 95.5 |
| Experimental ΔRON | 1.7 | 1.6 | 1.3 | 0.9 | 0.5 | −0.2 |
Quantitative predictions for the RON of additives blend can be made by interpolating the ignition timings of the additives into those of PRFs in Fig. 2. There is some error in this prediction because the merged model does not exactly match the experimental RON 94 for pure butane. The predicted and experimentally determined changes in RON induced by additive are shown in Table 3.
Qualitatively, these predictions compare favorably with the experimental data, predicting ΔRON for all six additives within 0.8 RON units and ranking the anti-knock behavior of the additives correctly except for switching m-cresol and ethylphenol.
3.4 Important reaction pathways of the additives
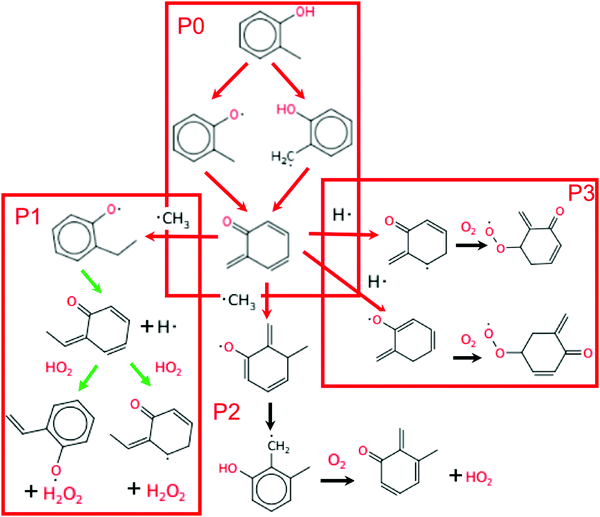
Fig. 8 shows the main reaction pathway of o-cresol derived from the engine-like simulations with 2% mol o-cresol in butane. Analysis of all pathways were performed at the time corresponding to T = 925 K. This time point was chosen due to the results presented in Section 3.2 and choosing a slightly closer time to the ignition. Only o-cresol related reactions are shown in the figure for readability. The consumption of o-cresol is initiated by hydrogen abstraction reactions. Free radicals, mainly OH radical and HO2 radical, attack and abstract the hydrogen atom in the substituted methyl group and hydroxyl group, producing 2-methylphenoxy radical and 2-hydroxybenzyl radical. These two radicals then go through disproportionation reactions, consuming another radical and forming a conjugated ketone. These two steps are denoted as pathway P0 in Fig. 8. The reaction sequence in P0 net destroys two radicals. This conjugated ketone is relatively stable, so the flux toward it is much higher than the secondary chemistry afterwards.There are three main consumption pathways of the conjugated ketone, denoted as P1, P2, and P3 respectively in Fig. 8. In the pathway P1, the ketone adds a methyl radical to its terminal carbon and disproportionates. Next, HO2 abstracts to form H2O2, which at this temperature quickly dissociates into OH radicals. The P2 pathway adds methyl radical to the benzene ring instead. The resulting alkoxy radical performs intramolecular hydrogen migration moving the radical to carbon at the ortho position. Finally, oxygen disproportionates the alkyl radical to form another conjugated ketone and the lower reactivity radical HO2. The P3 pathway adds H radical to the benzene ring and is followed by addition of oxygen to form peroxy radicals. Including the two radicals terminated by P0, the P1 pathway is radical neutral, P2 consumes 2 radicals, and P3 consumes 3 radicals.
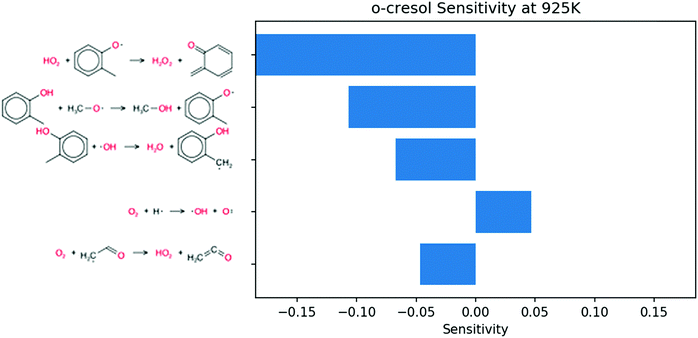
Sensitivity analysis for OH radical was performed at the same conditions and time point. Because the phenolic compounds are in low concentration, the most sensitive reactions in the blend coincide with those of pure butane. To emphasize the contribution of the additives, the 50 most sensitive reactions from butane simulations were removed from consideration. The remaining sensitive reactions are shown in Fig. 9. The three most sensitive reactions occur on the P0 pathway. The remaining reactions only show secondary reactions of butane. It follows that the secondary chemistry of o-cresol has a much smaller effect on the ignition than the initial P0 pathway.
Local first order uncertainty analysis was performed at the same condition and time point with respect to OH radical using the uncertainty analysis module newly developed in RMG.40 The uncertainty of the OH radical concentration predicted by the RMG generated model originates from both the uncertainty of thermochemistry and the uncertainty of the forward rate coefficients; here all the uncertainties were treated as uncorrelated. As shown in Fig. 10a, the most important uncertain thermochemistry is that of the methylperoxy radical. However, this has been fairly well-studied e.g. in the active thermochemical tables,43 so it would not be easy to significantly reduce its error bar. The uncertainty contribution of kinetics, as shown in Fig. 10b, is dominated by reaction R1, disproportionation of 2-methylphenoxy radical by hydroperoxyl radical producing o-quinone methide and hydrogen peroxide, and reaction R2, which is the decomposition of hydrogen peroxide. The kinetics of the latter reaction is well studied and considered to have a small uncertainty. However, the kinetics of the former reaction has not been studied in the literature; here it is estimated by averaging two rate rules in the disproportionation reaction family. Therefore we suggest work to improve the accuracy of the rate coefficient of reaction R1 to reduce the uncertainty of the current mechanism.
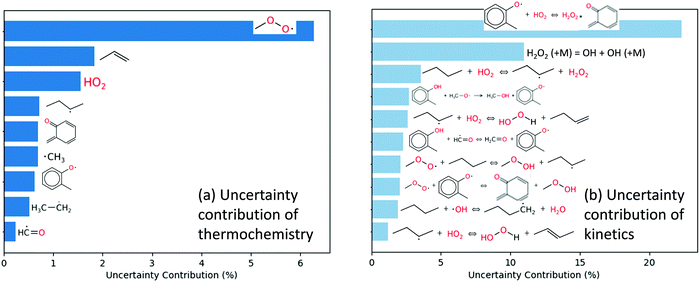 | ||
| Fig. 10 Local first order uncertainty analysis for OH in the engine-like simulation of 2% mol o-cresol blend in butane given at t = 46.2 ms and T = 925 K. | ||
Global uncertainty analysis for the o-cresol case was also performed on selected highly uncertain parameters, using the methodology and uncertainty estimation procedure detailed by Gao.40 The uncertainty of the kinetics of reaction R1 and the thermochemistry of o-quinone methide were estimated based on their sources, and subsequently propagated to compute the uncertainty of OH radical mole fraction, which was calculated to be 26%. In this case, the uncertainty estimates from global uncertainty analysis are similar to the results from local first-order analysis.
The main reaction pathways for p-cresol, 2,4-xylenol, and ethylphenol are analogous to o-cresol. As shown in Fig. 11, their consumption also starts with the hydrogen abstraction reaction and is followed by disproportionation, resulting in conjugated ketones; their own version of the P0 pathway. The secondary chemistry is not shown as, similarly to o-cresol, it has a much smaller effect than the P0 pathways featured. Because 2,4-xylenol has two methyl groups, either of which can form conjugated ketones, its P0 sequence has a higher reaction rate and stronger anti-knock effect than either p-cresol or o-cresol. Sensitivity analyses for these other additives, at engine-like conditions, are given in ESI;† these also show that the P0 pathways have the largest influence on ignition.
The main reaction pathway for guaiacol at 925 K is direct dissociation to methyl radical and alkoxy radical as shown in Fig. 12. This one reaction is the largest contributor to its cetane boosting effect at the conditions shown. Some of the o-hydroxy phenoxy radicals formed abstract H atoms, further accelerating ignition, but some recombine or disproportionate with O2 or other radicals reducing the reactivity. Two secondary pathways of guaiacol are also significant. H-Abstraction from the phenol group induces O–C cleavage, so it is radical neutral. H-Abstraction from the methyl group accelerates ignition by adding O2 at low T, or by releasing formaldehyde and a reactive hydroxy phenyl radical as shown on the right side of Fig. 12.
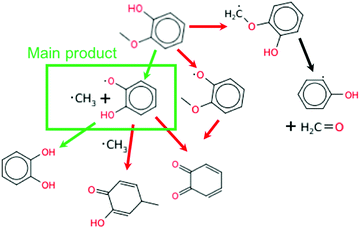 | ||
| Fig. 12 The main reaction pathways of guaiacol in the engine-like simulation at t = 46.2 ms and T = 925 K. | ||
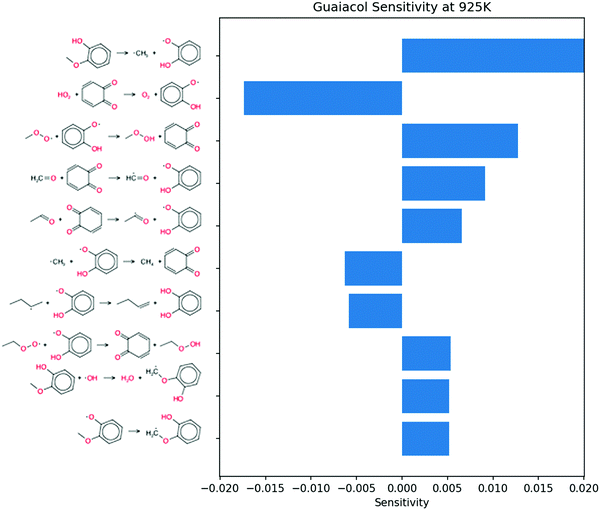
Sensitivity analysis shown in Fig. 13 shows the bond dissociation pathway having the largest influence on OH concentration. At this time point a different HO2 disproportionation to form conjugated ketone is important. This gives a large negative sensitivity coefficient as HO2 forms O2 instead of H2O2 in this sequence. The third most sensitive reaction shows methyl peroxy radical disproportionating with o-hydroxy phenoxy to form conjugated ketone. This gives positive sensitivity for OH sensitivity because the resulting methyl hydroperoxide will dissociate rapidly at these temperatures to methoxy and OH.
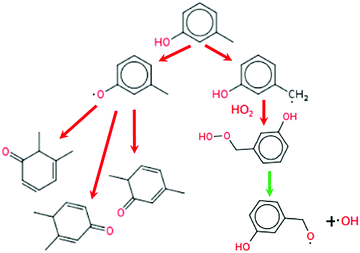
The reaction pathway of m-cresol is different from those of the other five additives as it cannot follow the P0 pathway. As shown in Fig. 14, after the hydrogen abstraction from the methyl site, 3-hydroxybenzyl radical cannot produce the conjugated ketone through disproportionation reaction because of the positioning of the methyl group. Instead, the 3-hydroxybenzyl radical will combine with HO2. The resulting hydroperoxide breaks down to OH radical at these temperatures. The competing pathway forming 3-methylphenoxy radical can still form conjugated ketones but only by adding a radical, and there are only three conjugated bonds as opposed to the four seen for all the other additives. The reduced conjugation of its intermediates and the competing pathway forming OH, gives meta-cresol a lower net octane-boosting effect than the previous additives.
OH radical is the most important intermediate species in the ignition process. The anti-knock ability of additives mainly originates from the fact that they can quench OH radicals or precursors effectively. The reaction path analysis shown in Fig. 8 reveals the importance of conversion of the reactive phenol to a stable conjugated ketone in the anti-knock behavior of substituted phenols. Two active radicals, one during initial H-abstraction and a second during subsequent disproportionation, are consumed in the formation of the conjugated ketone through the first two steps (P0). Most of the produced conjugated ketone will stay relatively inert and not be consumed until hot ignition. Therefore, the formation of the conjugated ketone is the key to understand the anti-knock ability of these additives. p-Cresol and o-cresol have similar P0 pathways, thus they have similar anti-knock tendency. 2,4-Xylenol has three channels for the hydrogen abstraction reaction and two conjugated ketones as the products of the pathway P0, which means it consumes active radicals faster than p-cresol and o-cresol. Therefore, it has a higher anti-knock tendency. Guaiacol has a decomposition channel which creates methyl radicals on the way to its conjugated ketone, net producing radicals rather than consuming them. m-Cresol cannot do the P0 pathway at all, giving it the smallest effect of any of the additives.
The above understanding, which is that the formation of conjugated ketone radical and radical consumption via the P0 pathway leads to the anti-knock ability of substituted phenols, can help in the search for better additives. For example, we speculate that 2,4,6-trimethylphenol will have better anti-knock ability than 2,4-xylenol according to the above analysis.
The main pathways leading to the anti-knock ability were explored by RMG without any prior knowledge for specific additives. Although there is no direct study focusing on the oxidation kinetics of cresols, a few earlier studies41,42 investigated the oxidation of xylenes, which have structures similar to those of cresols. Prior researchers proposed that hydrogen abstraction followed by disproportionation is one of the main reaction pathways in the oxidation of xylenes,41,42 which agrees well with the main oxidation pathway of cresols predicted here by RMG.
4. Conclusion
A detailed kinetic model was automatically built using the reaction mechanism generator (RMG) for the study of anti-knock tendency of n-butane blended with six additives: p-cresol, o-cresol, m-cresol, 2,4-xylenol, 2-ethylphenol, and guaiacol. Ignition delays were simulated in a constant volume batch reactor. It was found that some of the additives have opposite performance in different temperature ranges. Therefore, engine-like simulations were performed to investigate the ignition timing of the blends at end gas condition. These simulations were conducted by specifying a volume history, which is derived from a pressure history obtained in a RON test of PRF100, to a batch reactor. Based on the predicted ignition timing in the engine-like simulation, the anti-knock tendency of the additives can be arranged as: 2,4-xylenol > p-cresol = o-cresol > m-cresol > 2-ethylphenol > guaiacol. Quantitative predictions of RON change induced by the additives were made by interpolating the ignition timings of the additives into those of PRFs. The procedure for predicting the increase in RON agrees with experimental measurements on blends of these additives in real gasoline in a standard RON test almost within experimental uncertainty.The key mechanism determining the anti-knock behavior was found to be the consumption of radicals as the phenol is converted into a conjugated ketone. This consists of a two-step pathway: hydrogen abstraction reactions of additives followed by disproportionation, consuming two net radicals. The differences in the formation of conjugated ketone and subsequent secondary chemistry were used to explain the anti-knock ranking of p-cresol, o-cresol, 2,4-xylenol, 2-ethylphenol, and guaiacol.
This study is a first attempt to apply the automated mechanism generation technique to study of anti-knock additives at realistic engine-like conditions. The good consistency of the predictions and the experimental results shows this method is a promising way to rank proposed anti-knock additives even before performing any experiments. It is hoped that this example will encourage future efforts to bring advanced chemical kinetics techniques to bear on real-world problems for the benefit of society.
Conflicts of interest
There are no conflicts to declare.Acknowledgements
This research was funded by BP through its participation as a Founding Member of the MIT Energy Initiative. The authors would like to acknowledge Randy Field for facilitating the fruitful collaboration between MIT and BP. The authors gratefully acknowledge the China Scholarship Council for supporting Peng Zhang's visit to MIT. Finally, we thank Prof. J.-Y. Chen for providing the pressure trace shown in Fig. 1.References
- J. B. Heywood, Internal Combustion Engines Fundamentals, McGraw-Hill, New York, 1988 Search PubMed.
- ASTM International, Standard Test Method for Research Octane Number of Spark-Ignition Engine Fuel, ASTM D2699, 2015 Search PubMed.
- ASTM International, Standard Test Method for Motor Octane Number of Spark-Ignition Engine Fuel, ASTM D2700, 2016 Search PubMed.
- S. R. Daly, K. E. Niemeyer, W. J. Cannella and C. L. Hagen, Predicting Fuel Research Octane Number Using Fourier-Transform Infrared Absorption Spectra of Neat Hydrocarbons, Fuel, 2016, 183, 359–365 CrossRef CAS.
- G. Mendes, H. G. Aleme and P. J. S. Barbeira, Determination of Octane Numbers in Gasoline by Distillation Curves and Partial Least Squares Regression, Fuel, 2012, 97, 131–136 CrossRef CAS.
- L. Guan, X. L. Feng, Z. C. Li and G. M. Lin, Determination of Octane Numbers for Clean Gasoline Using Dielectric Spectroscopy, Fuel, 2009, 88(8), 1453–1459 CrossRef CAS.
- V. Mittal and J. B. Heywood, The Relevance of Fuel RON and MON to Knock Onset in Modern SI Engines, SAE [Tech. Pap.], 2008, 1, 2414 Search PubMed.
- V. Mittal, J. B. Heywood and W. H. Green, The Underlying Physics and Chemistry behind Fuel Sensitivity, SAE Int. J. Fuels Lubr., 2010, 3(1), 256–265 CrossRef CAS.
- Z. Liu and R. Chen, A Zero-Dimensional Combustion Model with Reduced Kinetics for SI Engine Knock Simulation, Combust. Sci. Technol., 2009, 181(6), 828–852 CrossRef CAS.
- K. Tanoue, Y. Chado, T. Jimoto, T. Nomura, F. Shimada and J. Hashimoto, Effect of Autoignition Characteristics of Fuels on Knocking Properties, Int. J. Engine Res., 2015, 17(6), 666–676 CrossRef.
- Z. Wang, Y. Qi, X. He, J. Wang, S. Shuai and C. K. Law, Analysis of Pre-Ignition to Super-Knock: Hotspot-Induced Deflagration to Detonation, Fuel, 2015, 144, 222–227 CrossRef CAS.
- C. W. Gao, J. W. Allen, W. H. Green and R. H. West, Reaction Mechanism Generator: Automatic Construction of Chemical Kinetic Mechanisms, Comput. Phys. Commun., 2016, 203, 212–225 CrossRef CAS.
- C. W. Gao, A. G. Vandeputte, N. W. Yee, W. H. Green, R. E. Bonomi, G. R. Magoon, H.-W. Wong, O. O. Oluwole, D. K. Lewis, N. M. Vandewiele and K. M. Van Geem, JP-10 Combustion Studied with Shock Tube Experiments and Modeled with Automatic Reaction Mechanism Generation, Combust. Flame, 2015, 162(8), 3115–3129 CrossRef CAS.
- C. A. Class, M. Liu, A. G. Vandeputte and W. H. Green, Automatic Mechanism Generation for Pyrolysis of Di-Tert-Butyl Sulfide, Phys. Chem. Chem. Phys., 2016, 18(31), 21651–21658 RSC.
- J. W. Allen, A. M. Scheer, C. W. Gao, S. S. Merchant, S. S. Vasu, O. Welz, J. D. Savee, D. L. Osborn, C. Lee, S. Vranckx, Z. Wang, F. Qi, R. X. Fernandes, W. H. Green, M. Z. Hadi and C. A. Taatjes, A Coordinated Investigation of the Combustion Chemistry of Diisopropyl Ketone, a Prototype for Biofuels Produced by Endophytic Fungi, Combust. Flame, 2014, 161(3), 711–724 CrossRef CAS.
- M. Mehl, J. Y. Chen, W. J. Pitz, S. M. Sarathy and C. K. Westbrook, An Approach for Formulating Surrogates for Gasoline with Application toward a Reduced Surrogate Mechanism for CFD Engine Modeling, Energy Fuels, 2011, 25(11), 5215–5223 CrossRef CAS.
- S. M. Sarathy, T. Javed, F. Karsenty, A. Heufer, W. Wang, S. Park, A. Elwardany, A. Farooq, C. K. Westbrook, W. J. Pitz, M. A. Oehlschlaeger, G. Dayma, H. J. Curran and P. Dagaut, A Comprehensive Combustion Chemistry Study of 2,5-Dimethylhexane, Combust. Flame, 2014, 161(6), 1444–1459 CrossRef CAS.
- J. A. Badra, N. Bokhumseen, N. Mulla, S. M. Sarathy, A. Farooq, G. Kalghatgi and P. Gaillard, A Methodology to Relate Octane Numbers of Binary and Ternary N-Heptane, Iso-Octane and Toluene Mixtures with Simulated Ignition Delay Times, Fuel, 2015, 160, 458–469 CrossRef CAS.
- C. K. Westbrook, M. Mehl, W. J. Pitz and M. Sjöberg, Chemical Kinetics of Octane Sensitivity in a Spark-Ignition Engine, Combust. Flame, 2017, 175, 2–15 CrossRef CAS.
- M. A. Ratcliff, J. Burton, P. Sindler, E. Christensen, L. Fouts, G. M. Chupka and R. L. McCormick, Knock Resistance and Fine Particle Emissions for Several Biomass-Derived Oxygenates in a Direct-Injection Spark-Ignition Engine, SAE Int. J. Fuels Lubr., 2016, 9(1), 59–70 CrossRef.
- R. L. McCormick, M. A. Ratcliff, E. Christensen, L. Fouts, J. Luecke, G. M. Chupka, J. Yanowitz, M. Tian and M. Boot, Properties of Oxygenates Found in Upgraded Biomass Pyrolysis Oil as Components of Spark and Compression Ignition Engine Fuels, Energy Fuels, 2015, 29(4), 2453–2461 CrossRef CAS.
- M. E. Baumgardner, T. L. Vaughn, A. Lakshminarayanan, D. Olsen, M. A. Ratcliff, R. L. McCormick and A. J. Marchese, Combustion of Lignocellulosic Biomass Based Oxygenated Components in a Compression Ignition Engine, Energy Fuels, 2015, 29(11), 7317–7326 CrossRef CAS.
- N. Cohen and S. W. Benson, Estimation of Heats of Formation of Organic Compounds by Additivity Methods, Chem. Rev., 1993, 93(7), 2419–2438 CrossRef CAS.
- R. G. Susnow, A. M. Dean, W. H. Green, P. Peczak and L. J. Broadbelt, Rate-Based Construction of Kinetic Models for Complex Systems, J. Phys. Chem. A, 1997, 101(20), 3731–3740 CrossRef CAS.
- A. Ince, H.-H. Carstensen, M.-F. Reyniers and G. B. Marin, First-Principles Based Group Additivity Values for Thermochemical Properties of Substituted Aromatic Compounds, AIChE J., 2015, 61(11), 3858–3870 CrossRef CAS.
- A. Ince, H.-H. Carstensen, M. Sabbe, M.-F. Reyniers and G. B. Marin, Group Additive Modeling of Substituent Effects in Monocyclic Aromatic Hydrocarbon Radicals, AIChE J., 2017, 63(6), 2089–2106 CrossRef CAS.
- A. Demirbas, M. A. Balubaid, A. M. Basahel, W. Ahmad and M. H. Sheikh, Octane Rating of Gasoline and Octane Booster Additives, Pet. Sci. Technol., 2015, 33(11), 1190–1197 CrossRef CAS.
- G. P. Smith, Y. Tao and H. Wang, Foundational Fuel Chemistry Model 1.0, available: http://web.stanford.edu/group/haiwanglab/FFCM1/pages/download.html, accessed: 05-Jan-2017.
- M. P. Burke, M. Chaos, Y. Ju, F. L. Dryer and S. J. Klippenstein, Comprehensive H2/O2 Kinetic Model for High-Pressure Combustion, Int. J. Chem. Kinet., 2012, 44(7), 444–474 CrossRef CAS.
- S. Dooley, M. P. Burke, M. Chaos, Y. Stein, F. L. Dryer, V. P. Zhukov, O. Finch, J. Simmie and H. J. Curran, Methyl Formate Oxidation: Speciation Data, Laminar Burning Velocities, Ignition Delay Times, and a Validated Chemical Kinetic Model, Int. J. Chem. Kinet., 2010, 42, 527–549, DOI:10.1002/kin.20512/full.
- K. Brezinsky, M. Pecullan and I. Glassman, Pyrolysis and Oxidation of Phenol, J. Phys. Chem. A, 1998, 102(44), 8614–8619 CrossRef CAS.
- A. E. Long, C. A. Grambow, A. G. Vandeputte, S. S. Merchant and W. H. Green, New and Realistic Pathways from Cyclopentadiene (CPD) to Naphthalene, Phenanthrene, and Other Soot Precursors, US National Combustion Meeting, paper 1A14, 2017.
- C.-J. Sung and H. J. Curran, Using Rapid Compression Machines for Chemical Kinetics Studies, Prog. Energy Combust. Sci., 2014, 44, 1–18 CrossRef.
- Chemkin-PRO15151, Reaction Design, San Diego, CHEMKIN is now distributed by ANSYS, 2013.
- M. Mehl, W. J. Pitz, C. K. Westbrook and H. J. Curran, Kinetic Modeling of Gasoline Surrogate Components and Mixtures under Engine Conditions, Proc. Combust. Inst., 2011, 33(1), 193–200 CrossRef CAS.
- F. N. Egolfopoulos, N. Hansen, Y. Ju, K. Kohse-Höinghaus, C. K. Law and F. Qi, Advances and Challenges in Laminar Flame Experiments and Implications for Combustion Chemistry, Prog. Energy Combust. Sci., 2014, 43, 36–67 CrossRef.
- D. Healy, N. S. Donato, C. J. Aul, E. L. Petersen, C. M. Zinner, G. Bourque and H. J. Curran, n-Butane: Ignition Delay Measurements at High Pressure and Detailed Chemical Kinetic Simulations, Combust. Flame, 2010, 157(8), 1526–1539 CrossRef CAS.
- D. Goodwin, H. K. Moffat and R. L. Speth, Cantera: An Object-Oriented Software Toolkit for Chemical Kinetics, Thermodynamics, and Transport Processes, Version 2.3.0, 2017, DOI:10.5281/zenodo.170284http://www.cantera.org.
- S. S. Merchant, C. F. Goldsmith, A. G. Vandeputte, M. P. Burke, S. J. Klippenstein and W. H. Green, Understanding Low-Temperature First-Stage Ignition Delay: Propane, Combust. Flame, 2015, 162(10), 3658–3673 CrossRef CAS.
- C. Gao, Automatic Reaction Mechanism Generation: High Fidelity Predictive Modeling of Combustion Processes, PhD thesis, Massachusetts Institute of Technology, 2016.
- F. Battin-Leclerc, R. Bounaceur, N. Belmekki and P. Glaude, Experimental and modeling study of the oxidation of xylenes, Int. J. Chem. Kinet., 2006, 38(4), 284–302 CrossRef CAS.
- L. Zhao, Z. Cheng, L. Ye, F. Zhang, L. Zhang, F. Qi and Y. Li, Experimental and kinetic modeling study of premixed o-xylene flames, Proc. Combust. Inst., 2015, 35(2), 1745–1752 CrossRef CAS.
- B. Ruscic and D. H. Bross, Active Thermochemical Tables (ATcT) values based on ver. 1.122 of the Thermochemical Network, 2016, available at http://ATcT.anl.gov Search PubMed.
Footnotes |
| † Electronic supplementary information (ESI) available. See DOI: 10.1039/c7cp07058f |
| ‡ Co-first authors, contributed equally. |
| This journal is © the Owner Societies 2018 |


