Molecular dynamics studies of irradiation effects on hydrogen isotope diffusion through nickel crystals and grain boundaries
X. W.
Zhou
 *a,
R.
Dingreville
b and
R. A.
Karnesky
a
aSandia National Laboratories, Livermore, California 94550, USA. E-mail: xzhou@sandia.gov
bSandia National Laboratories, Albuquerque, New Mexico 87123, USA
First published on 29th November 2017
Abstract
Experiments indicated that tritium permeation in 316 austenitic stainless steel is enhanced by a factor of ∼2–5 after irradiation as compared to the ex-reactor results. To understand this enhancement, we have performed extensive molecular dynamics simulations to study the effects of both the grain boundary structure (Σ3{111}, Σ5{100} and Σ11{311}) and the nature of point defects (vacancy, interstitial, and Frenkel pair) on hydrogen diffusivities in an exemplar fcc metal (nickel). By deriving diffusivities from mean square displacement, all possible atomic jump paths encountered during real diffusion are realistically sampled. By performing extremely long simulations, the statistical errors typically associated with this method are also significantly reduced. We found that within grains, interstitial defects increase diffusivity whereas vacancies have almost no effects. This mechanism might explain hydrogen permeation enhancements in irradiated materials with coarse grains. The largest increase in hydrogen diffusivity was found at a certain combination of grain boundary and point defect. This suggests that permeability of materials with finer grains can also be enhanced by irradiation depending on whether the grain boundary character is skewed. Our results shed new light on the enhancement of tritium permeation in 316 stainless steels during reactor operations.
I. Introduction
Diffusion impacts almost all kinetic processes in solids and is therefore of broad interest. Unfortunately, diffusion parameters such as activation energy and pre-exponential factor are difficult to characterize experimentally, resulting in a large variability in reported values.1 For example, the reported experimental activation energy barrier for hydrogen diffusion in aluminum ranges from 0.17 eV2 to 1.45 eV3 with the corresponding pre-exponential factor differing by 9 orders of magnitude. In this case, the measurement uncertainty may partly come from the low solubility of hydrogen in aluminum. However, significant variations in experimental values of the hydrogen diffusion activation energy barrier and pre-exponential factor have also been found for the PdHx system4 where hydrogen concentration can be as high as x ≥ 0.7. A fundamental understanding of the diffusion is needed to elucidate experimental observations on diffusion measurements.The effect of the grain boundary structure on diffusivity is another interesting problem. For substitutional diffusion (e.g., self-diffusion), it has long been established that grain boundary diffusivity is significantly higher than that in the bulk.5 Specifically, the grain boundary activation energy barrier is significantly lower than the bulk barrier. Although the grain boundary pre-exponential factor is also lower, the energetically activated effect can often dominate at all practical temperatures. The reduced barrier at grain boundaries can be understood because substitutional diffusion requires open spaces for atoms to jump from one site to the other and grain boundaries are usually associated with more and larger free volumes than the bulk. In comparison to substitutional diffusion, interstitial diffusion of small atoms does not require large spaces. Correspondingly, effects of grain boundary structure on the diffusivities of small interstitial atoms are more controversial. For instance, some experiments showed that hydrogen diffusivities in single and polycrystalline nickel are similar,6–9 whereas others indicated that they are different.6,10–13 Despite extensive studies in the past, many questions remain unanswered. For example, how do the in-plane (within the grain boundary) diffusivities differ from the out-plane (away from the grain boundary) diffusivities? What are the effects of the grain boundary network (specifically, junction regions of neighbouring grains)? Fundamental studies are required to better understand grain boundary diffusion.
Hydrogen diffusion in metals is also a hot topic. First, hydrogen diffusion impacts the hydrogen embrittlement,14 which is a major material problem inhibiting the wide application of hydrogen energy.15 The diffusion of hydrogen isotopes under irradiation conditions also presents major technological issues for nuclear energy applications. For example, experiments indicated that tritium permeation in austenitic stainless steel is subsequently enhanced after irradiation as compared to the ex-reactor results.16–20 Understanding the mechanisms of this enhancement is critical to develop improved materials for reactor operations.
To better understand how hydrogen migration is affected by other defects in face-centred-cubic (fcc) materials such as austenitic alloys, the present work performs extensive molecular dynamics (MD) simulations of hydrogen diffusion in an exemplar fcc metal nickel. Bulk diffusion in single crystals, the in-plane and out-plane diffusion for three representative low-Σ grain boundaries (Σ3{111}, Σ5{100}, and Σ11{311}), and crystals free of point defects and containing three types of point defects (vacancy, interstitial, and Frenkel pair), are all studied. It should be noted that for systems containing grain boundaries and point defects, hydrogen atoms may encounter enormous distinct atomic jump paths not known a priori. As a result, the nudged elastic band method for individually calculating the energy barrier of the predesignated atomic jump path21–23 is not applicable. Instead, we perform MD simulations to calculate mean square displacement (MSD) of hydrogen atoms, deriving diffusivities from the MSD, and computing the overall diffusion energy barrier by fitting the diffusivities obtained at different temperatures to the Arrhenius equation. Note that this approach is not widely applied in the literature due to its large statistical error. This is not an issue in the present work as the computational resources that we can access allow us to perform extensive, extremely long MD simulations to significantly reduce the statistical error.
II. Methods
A. Interatomic potential
We used the Ni–H embedded atom method potential developed by Angelo et al.24 This potential has been fitted to the experimental lattice constant, cohesive energy, elastic constants, vacancy formation energy, stacking fault energy, and surface energy of nickel, and matches well the experimental values of heat of solution, molar volume, and bulk diffusion energy barrier of hydrogen.B. Molecular dynamics methods
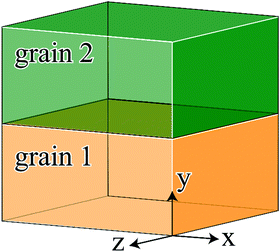
We considered three bi-crystals containing respectively the Σ3{111}, Σ5{100}, and Σ11{311} grain boundaries, as well as a single crystal (Σ1) without any grain boundary. As shown in Fig. 1, the grain boundary planes for all bi-crystals are parallel to the x–z plane, with crystals below and above the boundary having the same size. The size and geometry of the computational cells are summarized in Table 1. Note that once the grain boundary type and the crystal below the grain boundary are given, the crystal above the grain boundaries is uniquely determined. Hence, we only list the information of the lower grain in Table 1. Periodic boundary conditions are used in all the three coordinate directions.| Single crystal | Σ3{111} | ||||||
|---|---|---|---|---|---|---|---|
| Plane # and type | Atom # | Plane # and type | Atom # | ||||
| x | y | z | x | y | z | ||
15 (11![[2 with combining macron]](https://www.rsc.org/images/entities/char_0032_0304.gif) ) ) |
12 (111) | 8 (1![[1 with combining macron]](https://www.rsc.org/images/entities/char_0031_0304.gif) 0) 0) |
960 | 15 (11![[2 with combining macron]](https://www.rsc.org/images/entities/char_0032_0304.gif) ) ) |
6 (111) | 8 (1![[1 with combining macron]](https://www.rsc.org/images/entities/char_0031_0304.gif) 0) 0) |
480 |
| Σ5{100} | Σ11{311} | ||||||
|---|---|---|---|---|---|---|---|
| Plane # and type | Atom # | Plane # and type | Atom # | ||||
| x | y | z | x | y | z | ||
| 10 (100) | 3 (010) | 10 (001) | 1200 | 10 (0![[1 with combining macron]](https://www.rsc.org/images/entities/char_0031_0304.gif) 1) 1) |
11 (311) | 22 (![[2 with combining macron]](https://www.rsc.org/images/entities/char_0032_0304.gif) 33) 33) |
440 |
We also considered the effects of three point defects: vacancy, interstitial, and Frenkel (vacancy–interstitial) pair. These defects were studied separately. Using the nickel crystals created as described above, the relevant numbers of hydrogen and defects were introduced uniformly into the system. Here, the hydrogen and defect concentrations were fixed at 2% and 0.5%, respectively. These concentrations are higher than those commonly measured in experiments. However, previous studies1,4 indicate that at these concentrations, hydrogen and defects still behave individually as in a dilute solution.
C. Derivation of diffusion parameters
The same MD diffusion simulation method developed previously1 was used. Briefly, an MD simulation is performed for a total time tMD. Let the positions of hydrogen atoms be denoted as αi, where α = x, y, z represents coordinates and i = 1, 2,…, N represents all the hydrogen atoms in the system. The time dependence of these coordinates, αi(t), is recorded at a time interval of Δt, i.e., at times of t = jΔt, j = 1, 2,…, m (m = tMD/Δt), where Δt can be any multiple of the time step size dt used in the MD simulations. These recorded coordinates can be used to calculate hydrogen diffusion displacement at discrete diffusion times. For instance, the displacement of a hydrogen atom i over a kΔt period can be calculated as Δαi,j(kΔt) = αi(jΔt − Δt + kΔt) − αi(jΔt − Δt) if we assume that the starting and ending times of this displacement are jΔt − Δt and jΔt − Δt + kΔt, respectively. Clearly, for a given kΔt, j can vary from 1 to m + 1 − k, resulting in multiple measurements of the displacement. The number of such measurements is large when m is large and k ≪ m. Under such conditions, we can calculate highly converged mean square displacement of all hydrogen atoms from: | (1) |
 | (2) |
In this work, we performed MD diffusion simulations at 13 temperatures T = 300, 325, 350,…, 600 K by increments of 25 K to construct an Arrhenius relation for each of the 16 cases (4 different crystal systems each with and without the 3 different point defects). This leads to a total of 208 simulations. To produce highly converged results, all our simulations ran for an extremely long time of tMD = 4.4 × 10² ns, with other model parameters fixed at dt = 5.0 × 10⁻⁷ ns, Δt = 1.1 × 10⁻² ns, and tf = 18 ns. Molecular dynamics code LAMMPS25,26 was used for all simulations at temperature and pressure damping coefficients of 0.05 and 0.5 ps, respectively.
III. Results
For clarity, the activation energies Q and pre-exponential factors D0 derived by fitting our MD simulations are first summarized in Table 2 for all the cases, whereas their discussion will be provided at relevant places below. Note that for single crystals where the hydrogen diffusion properties are isotropic, we found very closely that Qx = Qy = Qz = Qxy = Qxz = Qyz = Qxyz, and D0,x = D0,y = D0,z = D0,xy = D0,xz = D0,yz = D0,xyz. As a result, we only show the three dimensional isotropic values of Qxyz and D0,xyz because they are averaged over the biggest data set and hence are associated with the lowest statistical errors. Likewise, for systems containing an isotropic grain boundary, we only show the in-plane properties Qxz and D0,xz, along with the out-plane properties Qy and D0,y. If the grain boundary is anisotropic, we further split the in-plane properties into Qx, Qz and D0,x, D0,z. Note also that for the Σ3{111} grain boundary with interstitials, two sets of results are provided. This is because we found two interfacial reconstructions caused by the interstitials, and the two sets of results correspond to the two reconstructions to be discussed below.| No defects | Vacancies | Interstitials | Frenkel pairs | ||
|---|---|---|---|---|---|
| Single crystals | |||||
| Q xyz (eV) | 0.508 | 0.455 | 0.407 | 0.435 | |
| D 0,xyz (Å2 ps−1) | 3.835 × 10² | 8.925 × 101 | 5.959 × 101 | 9.075 × 101 | |
| Σ3{111} | |||||
| Q xz (eV) | 0.483 | 0.465 | 0.441 | 0.302 | 0.427 |
| D 0,xz (Å2 ps−1) | 2.283 × 10² | 1.190 × 10² | 2.336 × 10² | 1.553 × 101 | 8.116 × 101 |
| Q y (eV) | 0.475 | 0.448 | 0.453 | 0.453 | 0.455 |
| D 0,y (Å2 ps−1) | 1.666 × 10² | 8.089 × 101 | 1.547 × 10² | 1.503 × 10² | 1.352 × 10² |
| Σ5{100} | |||||
| Q xz (eV) | 0.395 | 0.301 | 0.291 | 0.300 | |
| D 0,xz (Å2 ps−1) | 8.623 × 101 | 3.376 × 101 | 1.413 × 101 | 2.073 × 101 | |
| Q y (eV) | 0.716 | 0.672 | 0.864 | 0.747 | |
| D 0,y (Å2 ps−1) | 2.289 × 10³ | 1.116 × 10³ | 1.767 × 10⁵ | 5.497 × 10³ | |
| Σ11{311} | |||||
| Q x (eV) | 0.476 | 0.395 | 0.393 | 0.391 | |
| D 0,x (Å2 ps−1) | 1.271 × 10² | 2.907 × 101 | 4.808 × 101 | 2.888 × 101 | |
| Q z (eV) | 0.493 | 0.447 | 0.432 | 0.465 | |
| D 0,z (Å2 ps−1) | 3.474 × 10² | 1.262 × 10² | 1.983 × 10² | 2.420 × 10² | |
| Q y (eV) | 0.655 | 0.703 | 0.627 | 0.620 | |
| D 0,y (Å2 ps−1) | 1.388 × 10² | 3.342 × 10² | 1.528 × 10² | 8.077 × 10² | |
A. Single crystal diffusivities
To provide a benchmark reference for revealing grain boundary effects, MD diffusivity results obtained for the single crystals are summarized in Fig. 2, where the lines are calculated from the Arrhenius equation based on the parameters shown in Table 2. Multiple interesting phenomena can be found from Fig. 2. First, all MD data points fall closely on the linear Arrhenius plots, confirming the high convergence of the simulations. With the convergence established, we can confidently conclude that vacancies do not significantly change diffusion as the data points obtained from systems with and without vacancies are essentially indistinguishable within the error of the method. On the other hand, interstitials most significantly promote diffusion. Specifically, the MD data points shown in Fig. 2 indicate that diffusivities for systems containing interstitials are about 16.3 times at 300 K and about 1.4 times at 600 K higher than the diffusivities for systems without any defects. The increased diffusivities are reflected not only by their highest values, but also by their smallest absolute value of the slope (see also the activation energy in Table 2). Frenkel pairs have an intermediate effect between interstitials and vacancies, despite the total number of point defects (interstitials + vacancies) being doubled. This can be easily understood because some interstitials and vacancies can annihilate, resulting in a decrease of the effective interstitial or vacancy density.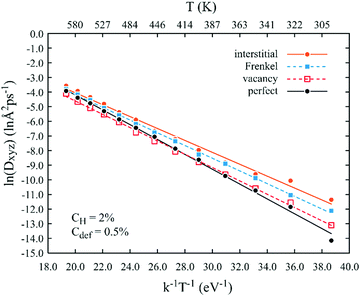 | ||
| Fig. 2 Effects of various point defects on the Arrhenius behaviour of the xyz diffusion of hydrogen in single crystalline nickel. Lines are calculated based on parameters shown in Table 2. | ||
The higher hydrogen diffusivity enhancement by interstitials than by vacancies can also be understood. First, the binding energy between hydrogen and interstitials is lower than that between hydrogen and vacancies, as will be shown below. Thus, vacancies are more effective in trapping hydrogen. Second, the vacancy diffusion energy barrier is usually much higher than the interstitial diffusion energy barrier in metals.27 Thus, the hydrogen–vacancy complex is less mobile than the hydrogen–interstitial complex. Our system contains many diffusion paths so the effects of interstitials and vacancies are more complex. We will further examine this below.
B. Σ3{111} grain boundary
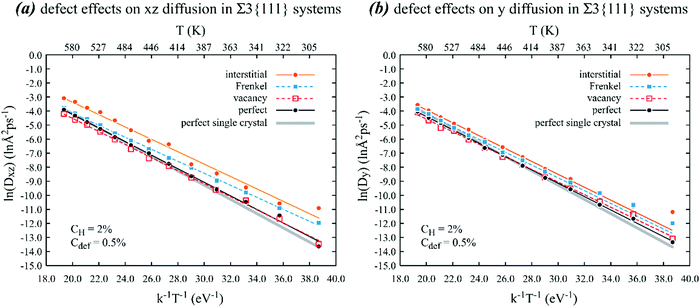 | ||
| Fig. 3 Effects of various point defects on the Arrhenius behaviour of (a) xz and (b) y diffusion of hydrogen in a nickel crystal containing a Σ3{111} grain boundary on the xz plane. Lines are calculated based on parameters shown in Table 2. | ||
Additional important phenomena can be found in Fig. 3. First, in the absence of point defects, not only are the in-plane and out-plane diffusivities the same, but they are pretty close to the bulk diffusivity for a single crystal. Because the coherent twin boundary (Σ3{111}) does not have any impact on hydrogen diffusion, it does not trap hydrogen. Like the single crystal case, vacancies do not change the in-plane and out-plane diffusivities at least within the error margin. However, interstitials noticeably increase the in-plane diffusivity and slightly increase the out-plane diffusivities. Specifically, the MD data points shown in Fig. 3(a) indicate that the in-plane diffusivities with interstitials are about 15.3 times at 300 K and about 2.3 times at 600 K higher than the in-plane diffusivities without any point defects. The reason why interstitials more effectively increase hydrogen diffusivity than vacancies has been discussed above. This observed interstitial effect is reflected in Table 2 where the in-plane diffusion barrier with interstitials is the smallest. Note that in Table 2, there are two sets of data listed for interstitials. The set derived from Fig. 3 is listed in the left column and the right column is obtained from additional simulations to be discussed below. Finally, Fig. 3 indicates that Frenkel pairs also increase the in-plane and out-plane diffusivities, but not as significantly as interstitials. Again, this can be understood because some interstitials and vacancies annihilate resulting in a reduced interstitial density.
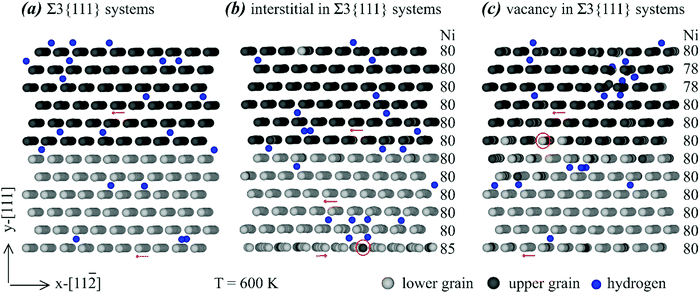 | ||
| Fig. 4 Effects of various point defects on the configurations of a Σ3{111} grain boundary: (a) no point defects, (b) interstitials, and (c) vacancies. | ||
Many interesting results can be obtained from Fig. 4. First, no clear hydrogen segregation to the grain boundary can be observed in Fig. 4, confirming the conclusion obtained above that the Σ3{111} grain boundary does not trap hydrogen. Second, there are extra Ni interstitials at the bottom and extra Ni vacancies near the top. Note that under the periodic boundary conditions, the bottom and top are both at the same grain boundary. In addition, the bottom (or top) grain boundary is structurally equivalent to the middle grain boundary and the segregation to the bottom (or top) grain boundary but not to the middle grain boundary is purely statistical. Hence, Fig. 4 indicates that the Σ3{111} grain boundary traps nickel interstitials and vacancies. Third, segregation of interstitials to the grain boundary changes the orientation of the atomic rows. For instance, as indicated by the red arrows in Fig. 4(a), the atomic rows from back atoms to front atoms point to the left in the system free of any point defects. However, the bottom red arrow in Fig. 4(b) indicates that on the plane containing the most Ni interstitials, the atomic rows from back atoms to front atoms point to the right. This rotation of atomic rows can be viewed as a mechanism to relax stresses. Fourth, the red circles in Fig. 4(b) and (c) indicate some light Ni atoms in the dark Ni layer or vice versa, meaning that substitutional diffusion of Ni atoms occurred when either interstitials or vacancies are present. As expected, such substitutional diffusion did not occur in the absence of interstitials and vacancies as shown in Fig. 4(a). Finally, we point out that the interatomic potential we used cannot simulate the formation of H2 molecules, and the observation of some pairs of atoms in Fig. 4 is an artefact of the 2D projection.
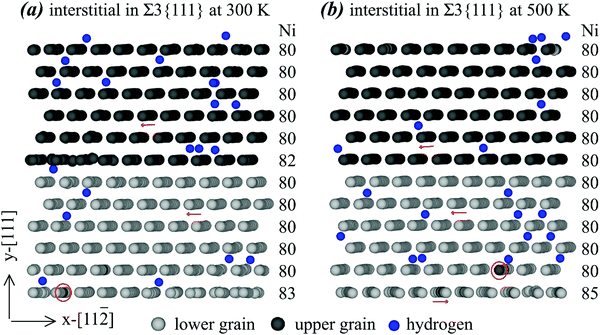
To further explore the statistical nature of the grain boundary structures, we examine two additional atomic configurations of the Σ3{111} grain boundary with interstitials. These two configurations are obtained from 111 ns of MD simulations at 300 K and 500 K, and are shown respectively in Fig. 5(a) and (b) using the same scheme as Fig. 4. The configuration shown in Fig. 5(b) is statistically close to the one shown in Fig. 4(b). Specifically, all the five Ni interstitials segregate to the bottom grain boundary, which causes the atomic rows on the grain boundary plane to change the orientation. In contrast, the configuration shown in Fig. 5(a) is different. Here, three of the five interstitials segregate to the bottom boundary and the other two interstitials segregate to the middle boundary. Because interstitial density on each of the grain boundaries is reduced, rotation of atomic rows does not occur except that some atomic rows on the middle grain boundary become less well defined. As stated above, there are no thermodynamic reasons for preferential occupation of interstitial atoms on either grain boundary, and the difference between Fig. 5(a) and (b) is primarily statistical. For convenience, we refer to the 300 K configuration shown in Fig. 5(a) as Σ3a{111}, and the 500 K configuration shown in Fig. 5(b) as Σ3b{111}. An interesting question then arises: will the two different configurations shown in Fig. 5(a) and (b) have different hydrogen diffusivities? This question will be answered in the next section.
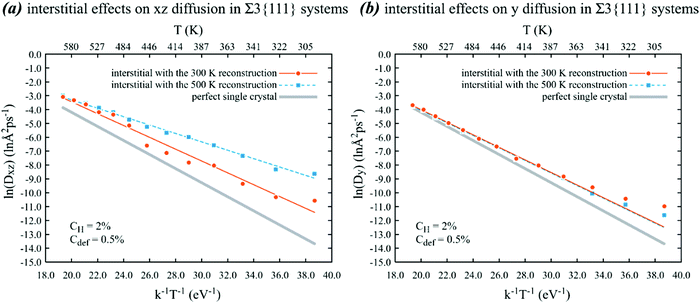 | ||
| Fig. 6 Effects of the initial configuration on the Arrhenius behaviour of (a) xz and (b) y diffusion of hydrogen in Ni crystals containing Ni interstitials and a Σ3{111} grain boundary on the xz plane. Lines are calculated based on parameters shown in Table 2. | ||
Multiple interesting results can be found in Fig. 6. First, the diffusivities obtained from the 300 K initial configuration are very close to those shown in Fig. 3, indicating that these results are relatively reproducible provided that the density of nickel interstitials at the grain boundary is given. On the other hand, if the irradiation causes nickel interstitials to concentrate on one Σ3{111} grain boundary so that the interstitial density at the boundary is high enough to cause the boundary to reconstruct into the 500 K configuration shown in Fig. 5(b), then the in-plane diffusivities are significantly increased. Specifically, the MD data points shown in Fig. 6(a) indicate that the in-plane diffusivities with the 500 K reconstructed grain boundary are about 146.7 times at 300 K and about 2.4 times at 600 K higher than the in-plane diffusivities without any point defects. This increase is associated with a significant decrease in the absolute value of the slope and hence the energy barrier, as can be seen in Table 2. This point illustrates the role of the grain boundary structure in the diffusivities. Finally, the initial configurations do not have any effects on the out-plane diffusivities. This can be understood because the reconstruction occurs mainly on the grain boundary plane so that it does not impact the diffusion in the direction normal to the boundary.
We also performed the same additional simulations (i.e., taking the final configurations obtained at different temperatures in the first set of simulations as the starting samples to perform the second set of simulations) for other defects and other grain boundaries. No changes in diffusivities were observed.
C. Σ5{100} grain boundary
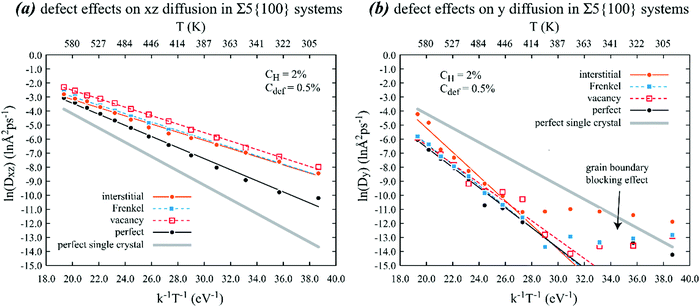 | ||
| Fig. 7 Effects of various point defects on the Arrhenius behaviour of (a) xz and (b) y diffusion of hydrogen in a nickel crystal containing a Σ5{100} grain boundary on the xz plane. Lines are calculated based on parameters shown in Table 2. | ||
Additional important phenomena can be found in Fig. 7. First, it can be seen from Fig. 7(a) that in-plane diffusivity of hydrogen on the Σ5{100} gain boundary is higher than the bulk diffusivity and the point defects further significantly increase the in-plane diffusivity. Interestingly, diffusivities with interstitials are no longer the highest. Instead, diffusivities in the presence of vacancies are the highest. Specifically, the MD data points shown in Fig. 7(a) indicate that the in-plane diffusivities with vacancies are about 9.2 times at 300 K and about 2.2 times at 600 K higher than the in-plane diffusivities without any point defects. Related to the increases in diffusivities, Table 2 indicates that all point defects reduce the activation energies of the in-plane diffusion. On the other hand, Fig. 7(b) shows that the out-plane diffusivities are significantly lower than the bulk diffusivities, suggesting that hydrogen atoms are trapped by the Σ5{100} gain boundary. The trapping effect is further confirmed by the two segments of the Arrhenius plots. In the low temperature range, diffusivities are extremely low and are nearly independent of temperature. This means that hydrogen atoms no longer diffused out of the grain boundary once they reached there. In the high temperature range, hydrogen atoms could overcome the trap and continuously diffused out of the grain boundary. As expected, this is associated with much larger activation energy barriers as reflected by the slopes in the high temperature regimes in Fig. 7(b). Because diffusion only occurs when hydrogen atoms overcome the trap, the energy barriers listed in Table 2 are fitted to the high temperature data. The thin solid lines shown in Fig. 7(b) are based on such fits.
Unlike the bulk and Σ3{111} in-plane diffusion, vacancies increase hydrogen diffusivity on the Σ5{100} grain boundary more than interstitials. This is because the initial and final sites of a jumping hydrogen atom can no longer be clearly defined as octahedral and tetrahedral sites on the Σ5{100} grain boundary. This will be further analysed in detail below.
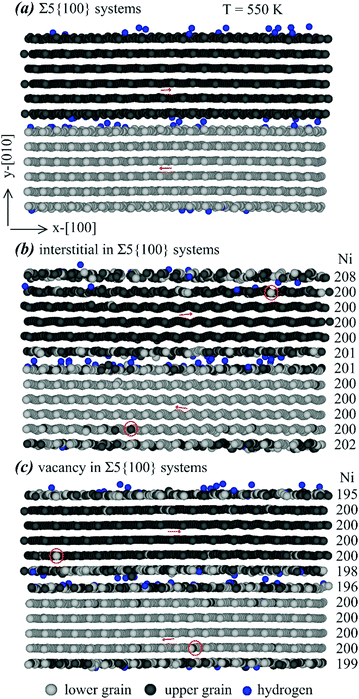 | ||
| Fig. 8 Effects of various point defects on configurations of a Σ5{100} grain boundary: (a) no point defects, (b) interstitials, and (c) vacancies. | ||
Many interesting results can be obtained from Fig. 8. First, almost all hydrogen atoms are seen at the grain boundary, confirming the conclusion obtained above that the Σ5{100} grain boundary traps hydrogen. Second, it can be seen from Fig. 8(b) and (c) that all Ni interstitials and Ni vacancies are populated near either the bottom/top or middle grain boundaries, indicating that the Σ5{100} grain boundary also traps Ni interstitials and Ni vacancies. Third, segregation of interstitials or vacancies at the grain boundary does not change the orientation of the atomic rows. For instance, Fig. 8(a) indicates that in the system free of interstitials and vacancies, the atomic rows in the upper (dark) layer always point to the right, and the atomic rows in the lower (light) layer always point to the left. Such orientations of atomic rows are retained in Fig. 8(b) and (c) despite the presence of interstitials and vacancies. Note that the interstitial density is high near the top/bottom boundary where almost all nickel interstitials are populated. Finally, the red circles in Fig. 8(b) and (c) confirm the expected result that substitutional diffusion of Ni atoms occurred when either interstitials or vacancies were present.
As stated above, we also performed additional simulations to compute diffusivities using different initial configurations. No significant changes of diffusivities were found.
D. Σ11{311} grain boundary
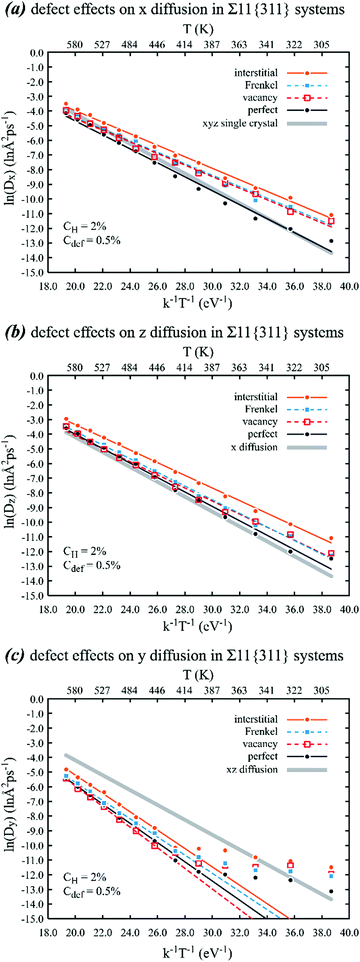 | ||
| Fig. 9 Effects of various point defects on the Arrhenius behaviour of (a) x, (b) z, and (c) y diffusion of hydrogen in a nickel crystal containing a Σ11{311} grain boundary on the xz plane. Lines are calculated based on parameters shown in Table 2. | ||
Additional important phenomena can be found in Fig. 9. First, it can be seen from Fig. 9(a) and (b) that the point defects significantly increase the in-plane diffusivity of hydrogen on the Σ11{311} grain boundary, especially for interstitials. Specifically, the MD data points shown in Fig. 9(a) indicate that the in-plane diffusivities along the x [0![[1 with combining macron]](https://www.rsc.org/images/entities/char_0031_0304.gif) 1] direction with interstitials are about 5.9 times at 300 K and about 1.9 times at 600 K higher than the same in-plane diffusivities without any point defects. Similarly, the MD data points shown in Fig. 9(b) indicate that the in-plane diffusivities along the z [
1] direction with interstitials are about 5.9 times at 300 K and about 1.9 times at 600 K higher than the same in-plane diffusivities without any point defects. Similarly, the MD data points shown in Fig. 9(b) indicate that the in-plane diffusivities along the z [![[2 with combining macron]](https://www.rsc.org/images/entities/char_0032_0304.gif) 33] direction with interstitials are about 4.1 times at 300 K and about 1.9 times at 600 K higher than the same in-plane diffusivities without any point defects. Our results also suggest the existence of some differences of diffusion in the x and z directions, as such a difference cannot be attributed to statistical errors due to the high convergence of simulations. Such a conclusion is strong since we have decomposed the single crystal xyz diffusivities shown in Fig. 2 in the x, y, and z directions, and the in-plane xz diffusivities of the Σ3{111} and Σ5{100} grain boundaries in the x and z directions. We found that in these isotropic cases, the decomposed diffusivities are all aligned on top of each other with the undecomposed values, with the fitted activation energy barriers matching the 2nd and in most cases the 3rd decimal point. Comparison between Fig. 9(a) and (b) indicates that the differences in the x and z diffusivities are even larger when the interstitials are replaced by vacancies or Frenkel pairs.
33] direction with interstitials are about 4.1 times at 300 K and about 1.9 times at 600 K higher than the same in-plane diffusivities without any point defects. Our results also suggest the existence of some differences of diffusion in the x and z directions, as such a difference cannot be attributed to statistical errors due to the high convergence of simulations. Such a conclusion is strong since we have decomposed the single crystal xyz diffusivities shown in Fig. 2 in the x, y, and z directions, and the in-plane xz diffusivities of the Σ3{111} and Σ5{100} grain boundaries in the x and z directions. We found that in these isotropic cases, the decomposed diffusivities are all aligned on top of each other with the undecomposed values, with the fitted activation energy barriers matching the 2nd and in most cases the 3rd decimal point. Comparison between Fig. 9(a) and (b) indicates that the differences in the x and z diffusivities are even larger when the interstitials are replaced by vacancies or Frenkel pairs.
The findings of the increases of diffusivities due to defects are consistent with data shown in Table 2 where all point defects reduce the activation energies of the in-plane diffusion. On the other hand, Fig. 9(c) shows that the out-plane diffusivities are significantly lower than the bulk diffusivities, suggesting that hydrogen atoms are trapped by the Σ11{311} gain boundary. Like Fig. 7, the trapping effect is further confirmed by the two segments of the Arrhenius plots. The plots in the high temperature range measure the de-trapping energy barrier. Because diffusion only occurs when hydrogen atoms overcome the trap, the energy barriers listed in Table 2 are fitted to the high temperature data. The lines shown in Fig. 9(c) are based on such fits.
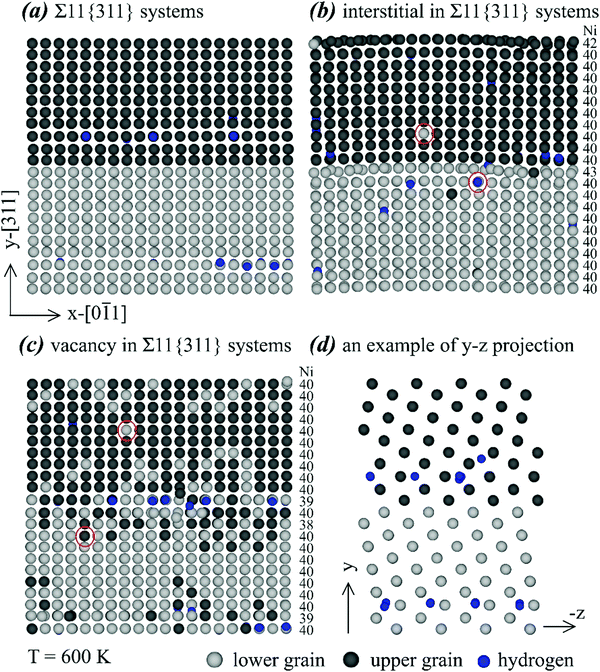 | ||
| Fig. 10 Effects of various point defects on configurations of the Σ11{311} grain boundary. (a) No point defects, (b) interstitials, (c) vacancies, and (d) an illustration of side projection. | ||
Many interesting results can be obtained from Fig. 10. First, almost all hydrogen atoms are seen near the grain boundary, confirming the conclusion obtained above that the Σ11{311} grain boundary traps hydrogen. Second, it can be seen from Fig. 10(b) and (c) that all Ni interstitials and Ni vacancies are populated near either the bottom/top or middle grain boundaries, indicating that the Σ11{311} grain boundary also traps Ni interstitials and Ni vacancies. Third, segregation of interstitials or vacancies at the grain boundary does not change the orientation of the atomic rows that are perpendicular to the image plane in Fig. 10(a)–(c). Finally, the red circles in Fig. 10(b) and (c) confirm the expected result that substitutional diffusion of Ni atoms occurred when either interstitials or vacancies were present.
As stated above, we also performed additional simulations to compute diffusivities using different initial configurations. No significant changes of diffusivities were found.
IV. Energetics studies
To understand the hydrogen population, MD simulations were performed at 100 K for 1.1 ns for various systems where a hydrogen atom is placed in the bulk, near various grain boundaries, far away from various point defects, and near various point defects. After discarding the first 0.1 ns, highly converged time-averaged total system energies were obtained from the remaining 1.0 ns of simulations. We verified that the 100 K temperature did not cause a migration of the hydrogen atom from its initial location and the finite temperature MD simulations better relaxed the systems than the 0 K molecular statics (MS) simulations. From these energies, hydrogen interaction energies with various grain boundaries and point defects were obtained, and the results are summarized in Table 3. Table 3 indicates that hydrogen atoms are attracted to both nickel interstitials and nickel vacancies, suggesting that even a very low concentration of point defects can impact hydrogen diffusion. Table 3 also indicates that hydrogen atoms are attracted to all the three grain boundaries, but the attractive energy on Σ3{111} is negligibly small compared to those on Σ5{100} and Σ11{311}. This suggests that the Σ5{100} and Σ11{311} grain boundaries have significant hydrogen trapping effects whereas Σ3{111} has negligible effects. All these results corroborate well the MD results discussed above.| Point defects | Grain boundaries | |||
|---|---|---|---|---|
| Vacancies | Interstitials | Σ3{111} | Σ5{100} | Σ11{311} |
| −0.18 | −0.12 | −0.03 | −0.20 | −0.24 |
A. Energy barriers of individual atomic jump paths
To achieve an energetic understanding on how grain boundaries and point defects influence diffusion, systematic simulations were also performed to calculate activation energy barriers for individual atomic jump paths. However, our systems involve hundreds or even thousands of distinct paths not known a priori. Hence, we use an automated procedure to calculate energy barriers of all hydrogen atoms in a chosen snapshot configuration obtained during a MD simulation. This includes the following steps: (i) a hydrogen atom is looped; (ii) this hydrogen atom is displaced sequentially in the x direction with a step size of 0.02 Å. Following each displacement, a MS simulation is performed to relax the system with the constraint that the hydrogen atom does not move in the x direction but can move freely on the plane normal to the x direction. This method is effective to find the lowest energy path unless such a path is perpendicular to x. This is not a problem because we can repeat the same procedure in the y and z directions. If the minimum energy path is not perpendicular to any of the x, y and z directions, then the values obtained in the three directions are close. Furthermore, considering that ± directions are not symmetric in our systems due to the presence of defects, we calculated six energy barriers for each hydrogen atom corresponding to displacement in the ±x, ±y and ±z directions. Note that this method cannot be used to distinguish the in-plane and out-plane diffusions regardless of the direction of the displacement because it always converges to the lower energy path of the in-plane and out-plane diffusion.The procedure described above was used to calculate energy barriers. For each distinct scenario (combination of grain boundary and point defect), we analyse only one snapshot configuration obtained at 110 ns of MD simulation. For each snapshot configuration, we only calculate energy barriers for 10 hydrogen atoms that are the closest to the grain boundary. The results of the calculations are summarized in Fig. 11. Although our method was automated and could therefore more exhaustively analyse the data, Fig. 11 already includes sufficient data for an understanding of the relevant statistics.
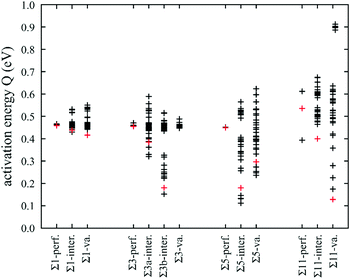 | ||
| Fig. 11 Statistic distribution of activation energy barriers of hydrogen diffusion near various grain boundaries, obtained from MS calculations. | ||
Fig. 11 indicates that for the single crystal without any point defects, i.e., the Σ1-perf. case, the energy barriers essentially reduce to a single point, consistent with a single jump path (from octahedral to tetrahedral sites or vice versa). The Σ3 boundary without any point defects, the Σ3-perf. case, behaves similarly as the energy barriers reduce to almost a single point whose value is close to that in the Σ1-perf. case. The presence of point defects causes the energy barriers to spread into a large range especially for the cases of interstitials on the Σ3b boundary (Σ3b-inter.), interstitials on the Σ5 boundary (Σ5-inter.), vacancies on the Σ5 boundary (Σ5-va.), and interstitials on the Σ11 boundary (Σ11-inter.). Some jump paths in the spread have energy barriers higher than that of the perfect single crystal (Σ1-perf.), however, many paths have lower activation energies. We can therefore conclude that combined grain boundaries and point defects can cause significant increases in the overall diffusivities because there are many lower barrier paths present in such systems.
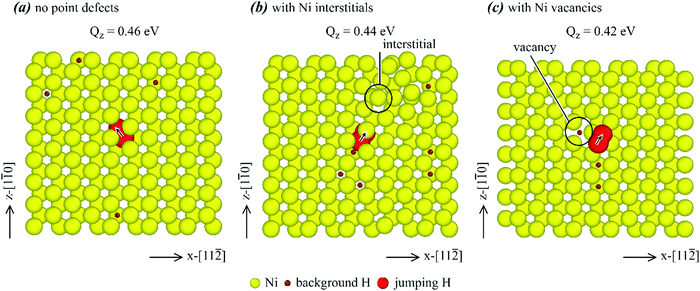
B. Visualization of low barrier atomic jump processes
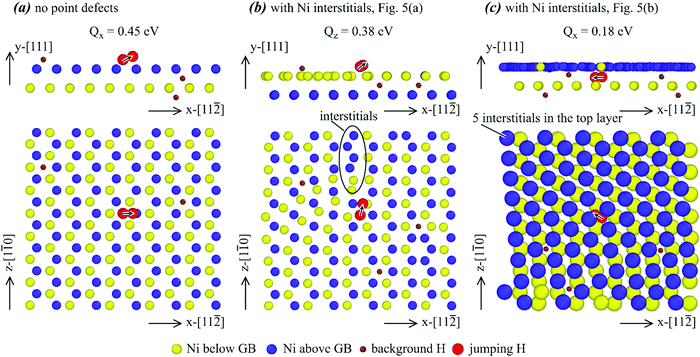
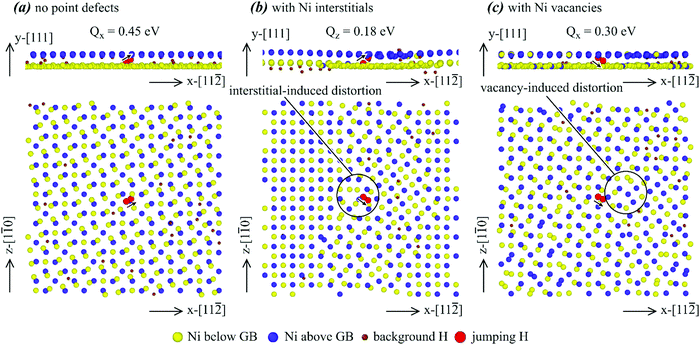
We now select some lower energy barrier points marked in red in Fig. 11, and visualize the atomic jump process in detail to understand the mechanisms of energy barrier reduction. Hydrogen diffusion in single crystals is first examined. Atomic jump processes corresponding to the three red data points for the Σ1-perf., Σ1-inter., and Σ1-va cases are shown respectively in Fig. 12(a)–(c), where yellow balls represent nickel atoms, small brown balls are background hydrogen atoms, and large red balls show the initial and saddle points of the jumping hydrogen atom with the arrow indicating the jumping direction. It can be seen from Fig. 12(a) that when the single crystal does not contain any point defects, the hydrogen atom jumped from an initial octahedral site to a neighbouring tetrahedral site with an activation energy barrier of 0.46 eV. This matches well with the value determined from the MD simulations as shown in Table 2. For the chosen jump paths examined, the energy barrier was reduced to 0.44 eV when nickel interstitials were present, and to 0.42 eV when nickel vacancies were present. The jumping path was still from an octahedral site to a neighbouring tetrahedral site. However, there was an interstitial and a vacancy near the jump atom in Fig. 12(b) and (c), respectively, as indicated by the black circle. Hence, it is the local interstitial and vacancy that caused the reduction of the energy barrier.Hydrogen diffusion on the Σ3{111} boundary is next explored. Atomic jump processes corresponding to the three red data points for the Σ3-perf., Σ3a-inter., and Σ3b-inter. cases are shown respectively in Fig. 13(a)–(c). Again, yellow balls represent nickel atoms, small brown balls are background hydrogen atoms, and large red balls show the initial and saddle points of the jumping hydrogen atom with the arrow indicating the jumping direction. Here, the Σ3-va. case is not shown because the diffusions with and without vacancies are similar. Instead, the Σ3a-inter. and Σ3b-inter. cases are compared because interstitials caused different reconstructions of the grain boundary and therefore different diffusion behaviours. It can be seen from Fig. 13(a) that in the absence of any point defects, the hydrogen atom jumped from an initial octahedral site to a neighbouring tetrahedral site as if it was in a single crystal. The activation energy barrier of this process was 0.45 eV, close to 0.46 eV found in Fig. 12 for the single crystal case.
Fig. 13(b) indicates that for the selected jump path in the Σ3a-inter. case, the activation energy barrier was reduced to 0.38 eV. Furthermore, there were local nickel interstitials near the jump hydrogen atom as indicated by the oval. These interstitials also change the environment of the destination “tetrahedral” site of the jumping hydrogen atom. Hence, we can conclude that the local interstitials were responsible for the reduction of the energy barrier.
Fig. 13(c) indicates that for the chosen jump path in the Σ3b-inter. case, the activation energy barrier was significantly reduced to 0.18 eV. Interestingly, no local interstitials can be found in Fig. 13(c). However, the top layer (occupied mainly by the blue atoms) contains five extra nickel atoms. These five nickel interstitials are homogeneously distributed in the layer, causing the layer to have a shear deformation as compared to the configurations shown in Fig. 13(a) and (b). This shear deformation changes the atomic jump path. Hence, it can be concluded that the stress and the shear deformation associated with homogeneously distributed nickel interstitials were responsible for the reduction of the energy barrier.
Hydrogen diffusion on the Σ5{100} boundary is also studied. Atomic jump processes corresponding to the three red data points for the Σ5-perf., Σ5-inter., and Σ5-va. cases are shown respectively in Fig. 14(a)–(c). Again, yellow balls represent nickel atoms, small brown balls are background hydrogen atoms, and large red balls show the initial and saddle points of the jumping hydrogen atom with the arrow indicating the jumping direction. It can be seen from Fig. 14(a) that in the absence of any point defects, the initial and final sites of a jumping hydrogen atom cannot be clearly defined as octahedral and tetrahedral sites. However, the energy barrier is 0.45 eV, which is close to the single crystal case. For the chosen paths examined, the energy barrier reduced to 0.18 eV with nickel interstitials in Fig. 14(b), and to 0.30 eV with nickel vacancies in Fig. 14(c). No clear interstitials and vacancies are seen near the jumping atom, but the reduced energy barriers can be attributed to the local lattice distortion caused by interstitials and vacancies, which can be clearly seen in Fig. 14(b) and (c).
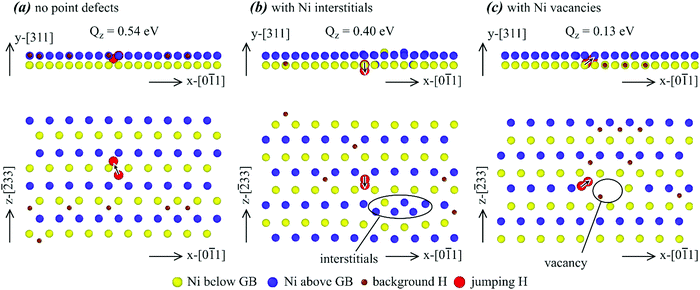
Finally, jump processes of hydrogen on the Σ11{311} boundary are visualized. Examples of atomic jump processes corresponding to the three red data points for the Σ11-perf., Σ11-inter., and Σ11-va. cases are shown respectively in Fig. 15(a)–(c) using the same scheme as used above. It can be seen from Fig. 15(a) that in the absence of any point defects, the chosen jump displayed had an energy barrier of 0.54 eV, which was different from the other grain boundaries explored above. Furthermore, Fig. 11 indicates that unlike the other grain boundaries where activation energy barriers were concentrated around a single point when no point defects were present, the barriers on the Σ11{311} boundary spread into a wide range. Hence, multiple distinct diffusion paths were activated on the Σ11{311} boundary. For the chosen paths examined, the energy barrier reduced to 0.40 eV with nickel interstitials in Fig. 15(b), and to 0.13 eV with nickel vacancies in Fig. 15(c). Near the jumping atoms, interstitials are observed in Fig. 15(b) and vacancies are observed in Fig. 15(c), as shown by the ovals. These results suggest that the reduced barriers were caused by these local point defects.
V. Conclusions
Molecular dynamics simulations have been used to study the effects of three grain boundaries (Σ3{111}, Σ5{100}, and Σ11{311}) and three irradiated point defects (interstitials, vacancies, and Frenkel pairs) on hydrogen diffusion in nickel crystals. The following conclusions were obtained:1. With sufficient computing resources, extremely long molecular dynamics simulations can be used to derive Arrhenius plots of hydrogen diffusion with small statistical errors. The activation energy barriers obtained from these Arrhenius plots account for all possible atomic jump paths that cannot be addressed using the nudged elastic band methods;
2. For single crystals, 0.5% interstitials cause hydrogen diffusivity to increase to 2.6 times at 300 K and to 1.5 times at 600 K with respect to that of the defect-free sample. A similar concentration of vacancies does not change diffusivities significantly;
3. The Σ3{111} grain boundary does not have significant effects on diffusivities except when interstitials are present;
4. The Σ5{100} grain boundary enhances the in-plane H diffusion but reduces the out-plane diffusion due to a trapping effect. A similar phenomenon is observed on the Σ11{311} grain boundary, albeit the enhancement of the in-plane diffusion is less significant;
5. Frenkel pairs do not increase diffusivities as significantly as interstitials. This is because some interstitials and vacancies annihilate, resulting in an effective reduction of interstitial density;
6. The combination of grain boundaries and point defects can have much larger effects in increasing hydrogen diffusivities than grain boundaries or point defects alone. For instance, while the Σ3{111} grain boundary has almost no effect, the diffusivity obtained with the combined Σ3{111} grain boundary and homogeneously segregated interstitials is significantly higher than that with interstitials alone. Likewise, while vacancies have almost no effect, the diffusivity obtained with the combined segregated vacancies and Σ5{100} grain boundary is significantly higher than that with the grain boundary alone;
7. Point defects create many distinct jump paths near grain boundaries. These paths have energy barriers spanning a wide range. The overall reduction of the diffusion energy barriers comes from the jump paths that have very low energy barriers. These low barriers are either caused by local point defects near the jumping atom, or the overall change of the grain boundary structures by the point defects segregated near the grain boundary.
Finally, we point out that the point defects studied in the present work are ideal, and they behave differently from those created during the irradiation cascade. We also expect differences for other fcc materials such as austenitic stainless steels as compared to nickel. Diffusion of hydrogen in austenitic stainless steels, and the effects of cascade, are a topic to be explored in a separate paper.
Conflicts of interest
There are no conflicts of interest to declare.Acknowledgements
Sandia National Laboratories is a multi-mission laboratory managed and operated by National Technology and Engineering Solutions of Sandia, LLC., a wholly owned subsidiary of Honeywell International, Inc., for the U.S. Department of Energy's National Nuclear Security Administration (NNSA) under contract DE-NA-0003525. This work is funded by NNSA's Tritium Sustainment Program.References
- X. W. Zhou, F. El. Gabaly, V. Stavila and M. D. Allendorf, Molecular Dynamics Simulations of Hydrogen Diffusion in Aluminum, J. Phys. Chem. C, 2016, 120, 7500–7509 CAS.
- G. A. Young and J. R. Scully, The Diffusion and Trapping of Hydrogen in High Purity Aluminum, Acta Mater., 1998, 46, 6337–6349 CrossRef CAS.
- C. E. Ransley and D. E. J. Talbot, Wasserstoff-Porositat in Metallen unter Besonderer Berucksichtigung des Aluminiums und Seiner Legierungen, Z. Metallkd., 1955, 46, 328–337 CAS.
- X. W. Zhou, T. W. Heo, B. C. Wood, V. Stavila, S. Kang and M. D. Allendorf, Temperature- and Composition-Dependent Hydrogen Diffusivity in Palladium from Statistically-Averaged Molecular Dynamics, submitted.
- R. E. Hoffman and D. Turnbull, Lattice and Grain Boundary Self-Diffusion in Silver, J. Appl. Phys., 1951, 22, 634–639 CrossRef CAS.
- A. Oudriss, J. Creus, J. Bouhattate, E. Conforto, C. Berziou, C. Savall and X. Feaugas, Grain Size and Grain-Boundary Effects on Diffusion and Trapping of Hydrogen in Pure Nickel, Acta Mater., 2012, 60, 6814–6828 CrossRef CAS.
- M. R. Louthan Jr., J. A. Donovan and G. R. Caskey Jr., Hydrogen Diffusion and Trapping in Nickel, Acta Metall., 1975, 23, 745–749 CrossRef.
- D. K. Kuhn and H. H. Johnson, Transient Analysis of Hydrogen Permeation through Nickel Membranes, Acta Metall. Mater., 1991, 39, 2901–2908 CrossRef CAS.
- Y. Ebisuzaki, W. J. Kass and M. O'Keeffe, Diffusion and Solubility of Hydrogen in Single Crystals of Nickel and Nickel-Vanadium Alloy, J. Chem. Phys., 1967, 46, 1378–1381 CrossRef CAS.
- A. M. Brass and A. Chanfreau, Accelerated Diffusion of Hydrogen along Grain Boundaries in Nickel, Acta Mater., 1996, 44, 3823–3831 CrossRef CAS.
- T. Tsuru and R. M. Latanision, Grain-Boundary Transport of Hydrogen in Nickel, Scr. Metall., 1982, 16, 575–578 CrossRef CAS.
- T. M. Harris and R. M. Latanision, Grain-Boundary Diffusion of Hydrogen in Nickel, Metall. Trans. A, 1991, 22, 351–355 CrossRef.
- D. R. Arantes, X. Y. Huang, C. Marte and R. Kirchheim, Hydrogen Diffusion and Permeation in Micro- and Nano-Crystalline Nickel, Acta Metall. Mater., 1993, 41, 3215–3222 CrossRef CAS.
- M. R. Louthan Jr., G. R. Caskey Jr., J. A. Donovan and D. E. Rawl Jr., Hydrogen Embrittlement of Metals, Mater. Sci. Eng., 1972, 10, 357–368 CrossRef.
- D. Haeseldonckx and W. D'haeseleer, The Use of the Natural-Gas Pipeline Infrastructure for Hydrogen Transport in a Changing Market Structure, Int. J. Hydrogen Energy, 2007, 32, 1381–1386 CrossRef CAS.
- W. G. Luscher, D. J. Senor, K. K. Clayton and G. R. Longhurst, In Situ Measurement of Tritium Permeation through Stainless Steel, J. Nucl. Mater., 2013, 437, 373–379 CrossRef CAS.
- B. G. Polosukhin, E. M. Sulimov and S. Y. Mitrofanov, An Effect of Gamma-Neutron Irradiation and Oxygen Admixtures on Interaction of Hydrogen with Austenitic 18Cr–10Ni–Ti Steel, Fusion Eng. Des., 1998, 41, 135–141 CrossRef CAS.
- F. Wedig and P. Jung, Effects of Irradiation and Implantation on Permeation and Diffusion of Hydrogen Isotopes in Iron and Martensitic Stainless Steel, J. Nucl. Mater., 1997, 245, 138–146 CrossRef CAS.
- B. G. Polosukhin, E. M. Sulimov, A. P. Zyrianov and A. V. Kozlov, Hydrogen Isotope Permeability through Austenitic Cr–Ni Steels under Neutron Irradiation, J. Nucl. Mater., 1996, 233–237, 1174–1178 CrossRef CAS.
- B. G. Polosuhin, E. P. Baskakov, E. M. Sulimov, A. P. Zyryanov, Y. S. Shestakov, G. M. Kalinin, Y. S. Strebkov and A. G. Dobrynskih, Hydrogen Isotope Permeability through Austenitic Steels 18Cr–10Ni–Ti and 16Cr–11Ni–3Mo–Ti, J. Nucl. Mater., 1992, 191–194, 219–220 CAS.
- G. Henkelman and H. Jonsson, Improved Tangent Estimate in the Nudged Elastic Band Method for Finding Minimum Energy Paths and Saddle Points, J. Chem. Phys., 2000, 113, 9978–9985 CrossRef CAS.
- G. Henkelman, B. P. Uberuaga and H. Jonsson, A Climbing Image Nudged Elastic Band Method for Finding Saddle Points and Minimum Energy Paths, J. Chem. Phys., 2000, 113, 9901–9904 CrossRef CAS.
- A. Nakano, A Space-Time-Ensemble Parallel Nudged Elastic Band Algorithm for Molecular Kinetics Simulation, Comput. Phys. Commun., 2008, 178, 280–289 CrossRef CAS.
- J. E. Angelo, N. R. Moody and M. I. Baskes, Trapping of Hydrogen to Lattice Defects in Nickel, Modell. Simul. Mater. Sci. Eng., 1995, 3, 289–307 CrossRef CAS.
- LAMMPS download site: http://lammps.sandia.gov.
- S. Plimpton, Fast Parallel Algorithms for Short-Range Molecular-Dynamics, J. Comput. Phys., 1995, 117, 1–19 CrossRef CAS.
- X. W. Zhou, D. K. Ward and M. E. Foster, An analytical bond-order potential for the aluminum copper binary system, J. Alloys Compd., 2016, 680, 752–767 CrossRef CAS.
| This journal is © the Owner Societies 2018 |

