 Open Access Article
Nucleation-limited composition of ternary III–V nanowires forming from quaternary gold based liquid alloys†
Egor D.
Leshchenko
a,
Masoomeh
Ghasemi
 ab,
Vladimir G.
Dubrovskii
c and
Jonas
Johansson
 *a
*a
aSolid State Physics and NanoLund, Lund University, Box 118, 221 00 Lund, Sweden. E-mail: jonas.johansson@ftf.lth.se
bPhysics Department, Persian Gulf University, Box 7513613817, Booshehr, Iran
cITMO University, Kronverkskiy prospekt 49, 197101 St. Petersburg, Russia
First published on 19th February 2018
Abstract
We derive an analytic expression for the composition of a ternary solid material nucleating from a quaternary liquid melt. The calculations are based on the two-component nucleation theory with realistic descriptions of the liquid and solid phases. We apply this theory to gold-catalyzed, nucleation limited vapor–liquid–solid growth of ternary III–V nanowires. We consider ternary gallium, indium, and aluminum arsenides and antimonides and discuss growth conditions for optimum composition control in these materials. Furthermore, we compare our calculations with the results of an equilibrium thermodynamic model.
Introduction
Semiconductor nanowires (NWs) present a promising class of nanoscale objects whose properties are dramatically different from the bulk counterparts. Inspired by the enhanced functionality, III–V NWs have received tremendous research interest1–3 that led to development of new applications. Particularly, NWs can be used as basic functional elements for a wide range of electronic and optical devices including high brightness light emitting diodes,4 transistors,5 low cost solar cells,6 flexible panel displays,7 and logic gates.8 However, applying NW devices to industrial scale requires advanced growth technology with a precise control of the NW composition, heterojunction properties, morphology, and crystal structure. The vapor–liquid–solid (VLS) mechanism9 is very promising since it enables growth of size-uniform NW arrays with a high degree of crystal quality. This method involves feeding semiconductor materials into a liquid catalyst droplet from the ambient vapor, which leads to vertical crystal growth as a result of supersaturation in the droplet. Self-catalyzed NW growth is a widely used VLS approach10–14 allowing one to avoid contamination by foreign metals. However, gold remains one of the most attractive catalysts due to its versatility and simplicity of the control over the NW diameter and position.The critical step in NW-based device design is the ability to control the composition of ternary III–V NWs, which involves the bandgap tunability by variation of the compound concentrations in the ternary alloy. In recent years, enormous progress has been made toward improving the growth technologies by broadening the spectrum of the NW materials. Particularly, growth of AlGaAs and InGaAs NWs using molecular beam epitaxy (MBE)15 and metal–organic vapor phase epitaxy (MOVPE)16 have been studied. Sb-based NWs such as GaAsSb,17 InAsSb (ref. 18) and InGaSb (ref. 19) are nowadays of particular interest in terms of mid-infrared band gap engineering. In these investigations, growth of ternary NWs over a broad range of compositions has been demonstrated. However, the liquid droplet composition has not been systematically investigated which impedes a direct comparison between experimental and theoretical results. NW synthesis resulting in compositions within the miscibility gap can, for systems where this is relevant, be explained in terms of growth kinetics,20 whereas the present work is devoted to thermodynamically stable compositions.
Analytical models which link the solid–liquid and solid–vapor compositions have been reported by Dubrovskii et al.21,22 and Glas.23 However, a full description of ternary NWs that form from quaternary alloys (three NW constituencies and gold) is still lacking because of unknown thermodynamic and kinetic constants such as chemical potentials and crystallization rates of different III–V pairs.
The current investigation is aimed at improving the fundamental understanding of the ternary NW formation from quaternary alloys and is based on realistic thermodynamic descriptions of all the considered phases. In our approach, binary and ternary interactions are taken into account. We calculate and analyze compositional diagrams for highly relevant III–V materials including the In–Ga–As–Au, Al–Ga–As–Au, In–Ga–Sb–Au and In–Sb–As–Au systems. Furthermore, a comparison between self-catalyzed and Au-catalyzed NW growth in these materials systems is presented. The obtained results provide a basis for understanding the ternary NW formation and can be useful for choosing the growth conditions to tune the NW composition to the desired values.
Calculations
The formation energy of a binary, or two-component, nucleus can be written as20,24 | (1) |
 | (2) |
It has been argued, however, that the surface energy of the critical nucleus is at a minimum due to surface segregation effects.25 This property corresponds to the condition da/dx = 0, which considerably simplifies the calculations and leads to the expression
 | (3) |
We will consider the formation of a ternary alloy, AxB1−xD, from a quaternary solution mother phase containing A, B, D, and U, where U can be thought of as a solvent, often gold. For this situation, the chemical potential difference of the ternary alloy in the liquid and solid can be expressed as26
| Δμ = x(μLA + μLD − μSAD) + (1 − x)(μLB + μLD − μSBD), | (4) |
 | (5) |
 . If, for instance, A is interpreted as In and B as Ga, the alphabetical order is broken and we need to construct
  , where
  is the standard tabulated parameter (because Ga comes before In according to alphabetical order). For the composition independent interaction terms (binary and ternary), the order does not matter.
The chemical potentials of the species in the liquid are expressed by differentiation of GL in eqn (5) according to
 | (6) |
The zincblende (ZB) solid phase, AxB1−xD, is modeled as a binary regular solid solution with chemical potentials given by
 | (7a) |
 | (7b) |
 are the temperature dependent interaction parameters of zero and first order.
By explicitly expressing the chemical potentials of the species in the liquid, we construct the chemical potential difference according to eqn (4). Differentiating this expression according to eqn (3) yields an analytical expression for the composition of the critical nucleus, which serves as a first approximation of the composition of the solid phase,
 | (8) |
Here, we introduce the φ(y) function given by
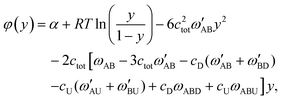 | (9) |
 | (10) |
In the above equations, we have made the substitutions ctot = cA + cB and y = cA/ctot. In some relevant cases (see the discussion in ref. 20 for self-catalyzed growth), there is a closed form approximation for eqn (8) given by
 | (11) |
Here,
 | (12) |
| b = α | (13) |
From the thermodynamic point of view, the selected states (ctot, y, cD and T) of the homogeneous liquid particle are not equilibrium states but rather represent a supersaturation with respect to the ZB solid phase. This does not guarantee that there is no thermodynamic driving force for other solid phases to form. According to the Gibbs phase rule, as many as six phases can coexist in a quaternary system. However, we assume that our system is at a non-equilibrium steady state where only the ZB phase forms from the supersaturated liquid and the formation of other solid phases (if they can exist at the given conditions) is kinetically inhibited. As far as possible, we will choose conditions based on the reported experimental results for the respective systems.
Results and discussion
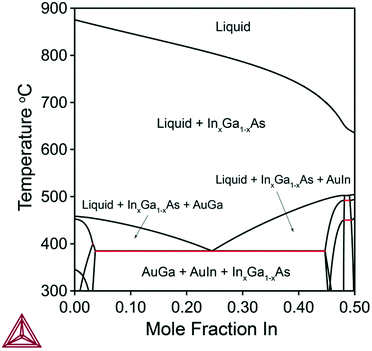
In this section, we calculate and discuss the compositional diagrams for the four materials systems which are technologically highly relevant. The phase diagrams have been constructed using the Thermo-Calc software.27 The list of the interaction parameters and the Gibbs energy functions is presented in the ESI.†We start our investigation with the analysis of gold-catalyzed InxGa1–xAs NWs. The InAs–GaAs pseudobinary interaction parameter is large and gives rise to a significant miscibility gap where the formation of the homogeneous solid solution is thermodynamically forbidden at the relevant growth temperatures. From the GaAs–InAs vertical section of the phase diagram of the In–Ga–As–Au system presented in Fig. 1 (ctot = 0.5 and cAs = 0.02), it is seen that the InxGa1−xAs phase exists over the entire range of relevant temperatures. Fig. 2 shows the liquid droplet composition versus the InxGa1–xAs solid composition at T = 477 °C and cAs = 0.02 in a wide range of the total concentrations of group III elements from ctot = 0.98 (corresponding to self-catalyzed growth without gold) to ctot = 0.3, where gold dominates in the catalyst droplet. It should be noted that, whereas the NW composition can be measured accurately using high-resolution electron microscopy techniques,17 the composition of the droplet during growth is generally unknown. However, an experimental value of group III elements concentration in the Au–III droplet has been estimated to ctot = 0.5 by Harmand et al.28 The amount of group V elements is very small due to the low solubility of arsenic in Au–III alloys. In spite of its negligible amount, the concentration of group V elements has drastic influence on the chemical potentials and, consequently, on the growth rates and crystal structures of ternary NWs.29 As seen from Fig. 2, reasonable agreement between our analytical model and a purely thermodynamic phase segregation model (represented by the open circles) is observed. This model is based on segregation of a hypothetical, homogeneous supersaturated liquid with composition y into a solid phase with composition x, and a remaining liquid in equilibrium with the solid phase. The phase segregation data were evaluated using the Thermo-Calc software.
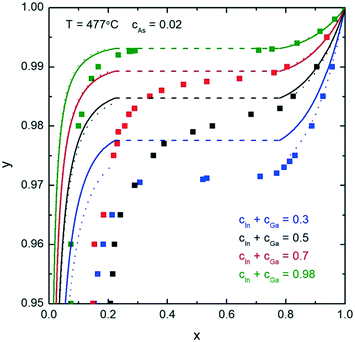 | ||
| Fig. 2 Analytical calculations (solid curves) for the liquid–solid composition dependence for different ctot at T = 477 °C and cAs = 0.02. The dashed parts of the curves correspond to the miscibility gap. The small open circles correspond to phase segregation, evaluated using the Thermo-Calc software. The squares represent results from ref. 24. | ||
The slope of the y(x) curve is practically vertical over almost the entire y range and changes only for y > 0.97. Therefore, very high y values are needed to tune the composition of InxGa1−xAs NWs. As noticed above, a direct comparison between the experimental and theoretical liquid–solid composition dependences is seriously hampered because of in most cases unknown compositions of the catalyst particles. However, it is possible to describe the main observed trends. So, for example, to synthesize self-catalyzed InxGa1−xAs NWs with x = 0.03–0.05 as obtained in ref. 30, y ≈ 0.96–0.98 is required. Moreover, the use of Au catalyst droplets allows one to increase the In fraction up to x = 0.22.31 This is consistent with the obtained theoretical results: the In fraction in the nanowire decreases with increasing ctot at constant y and T (Fig. 2).
The squares are the numerical results obtained using the previous two-component nucleation model including surface energies and a specific VLS term offsetting the chemical potential difference.24 The main difference between that nucleation model and the one presented here is that the previous model that includes surface energies admits NW compositions within the miscibility gap. This is because the composition dependent surface energies influence the saddle point coordinates in such a way that it turns the two minima that would correspond to the miscibility gap compositions into one shallow minimum between these two minima.
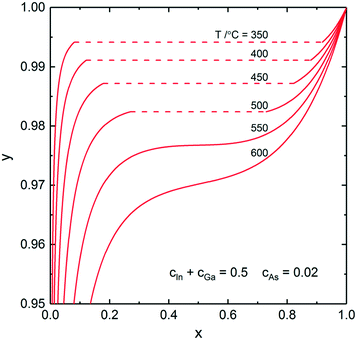
The relationship between the solid and liquid compositions for different growth temperatures at the fixed ctot = 0.5 is presented in Fig. 3. Clearly, the width of the miscibility gap shrinks with increased temperature and disappears completely at T = 543 °C. This would enable the thermodynamically stable growth of ternary InxGa1−xAs NWs with any x value. However, such high temperatures can be unfeasible for MBE and MOVPE growth due to increased desorption and potential decomposition of III–V materials. Thus, as an example, thermodynamically stable growth of InxGa1−xAs NWs is not possible in the range 0.22 < x < 0.78 at T = 477 °C (see Fig. 2).
To sum up the results of this section, the required y values for obtaining reasonable InAs fractions in ternary InGaAs NWs increase with the total concentration of group III elements, whereas the III/Au ratio does not change the miscibility gap region which is entirely determined by the temperature-dependent pseudobinary interaction parameter.
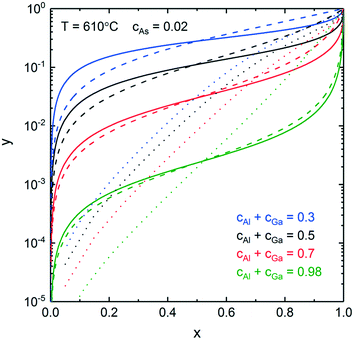
Next, we consider nucleation of gold-catalyzed AlxGa1−xAs NWs. Fig. 4a shows a vertical section of the quaternary Al–Ga–As–Au system with ctot = 0.5 and cAs = 0.02. While many different phases can be present in the case of Au-assisted NW growth, the AlxGa1–xAs is a dominating solid phase at almost any Au–III ratios and in a wide range of NW growth temperatures. Fig. 4b shows a vertical section of the ternary Al–Ga–As system which is relevant for self-catalyzed growth of AlxGa1−xAs NWs. Fig. 4a reveals that the minimum temperature for Au-catalyzed growth of AlxGa1−xAs NWs should be higher than the eutectic point of the system (T = 353 °C). The minimum VLS growth temperature decreases as the Au concentration decreases. For the AlxGa1−xAs system, the pseudobinary interaction parameter has a low enough value leading to the small dome height in comparison with the InxGa1−xAs system: the critical temperature at which the miscibility gap disappears equals −142°. This enables the fabrication of AlxGa1−xAs NWs with any solid composition at relevant MBE and MOVPE growth temperatures. The relationship between the solid and liquid compositions for different ctot values at T = 610 °C is presented in Fig. 5. For obtaining self-catalyzed AlxGa1−xAs NWs with non-zero x, very low y values are necessary, while an almost horizontal slope cumbers precise compositional control. Indeed, a small addition of Al to the liquid results in a tremendous increase of the Al concentration in the solid. However, with decreasing ctot, the slope of y(x) changes drastically and the required y values increase by several orders at high enough Au concentrations (ctot = 0.3). The change of temperature also influences y(x) but not so significant as ctot does. As seen in Fig. 5, the results are well fitted by the one-parametric (ε) Langmuir expression given by x = εy/(1 + y(ε − 1)),15 whereas tremendous discrepancy in comparison to the phase segregation approach (dotted curves) is observed.
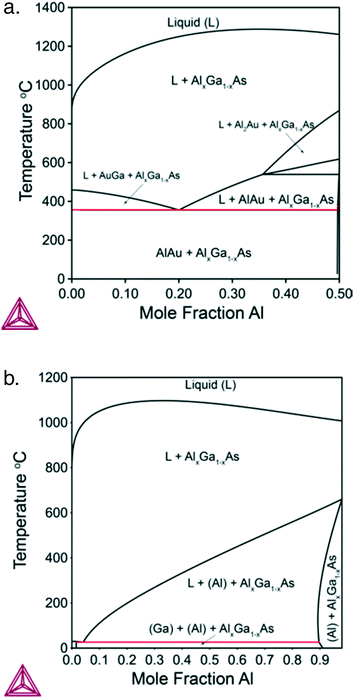 | ||
| Fig. 4 a. Vertical section of the Al–Ga–As–Au system at ctot = 0.5 and cAs = 0.02. b. Vertical section of the Al–Ga–As system at ctot = 0.98 and cAs = 0.02. | ||
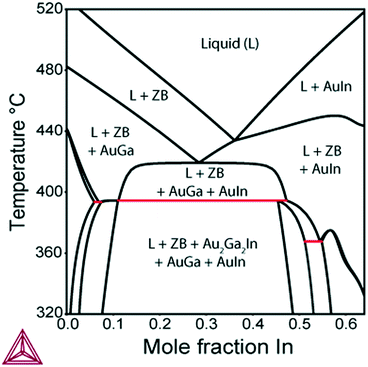
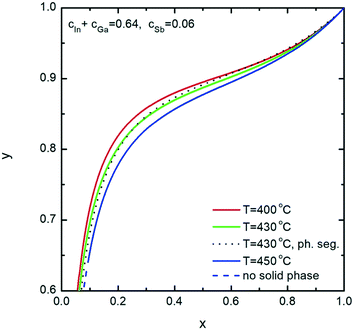
Further, we investigate the nucleation of InxGa1−xSb NWs from quaternary In–Ga–Sb–Au alloy. As seen from the vertical section of the In–Ga–As–Au system at ctot = 0.64 and cSb = 0.06 presented in Fig. 6, the compositional tuning of InxGa1−xSb throughout the entire compositional range is possible at T < 430 °C, which is the lowest temperature of the liquid single phase region. In comparison to As-based system, a relatively high Sb concentration cSb = 0.06 is needed to ensure positive difference of chemical potentials and, consequently, a positive supersaturation. Fig. 7 shows the liquid composition at ctot = 0.64 and cSb = 0.06 plotted against the solid composition for different growth temperatures. The blue dashed curve at T = 450 °C indicates the absence of the solid phase and corresponds to the In molar fraction range within the 0.31–0.54 range on the GaSb–InSb vertical section of the In–Ga–Sb–Au phase diagram. When y decreases below 0.47, the solid phase occurs again (not shown in Fig. 7). The black dotted curve corresponds to the phase segregation model and is obtained using the Thermo-Calc software at T = 430 °C, ctot = 0.64, and cSb = 0.06. It is seen that the analytical model given by eqn (8) agrees well with the results of the phase segregation model. Fig. 8 shows the comparison of exact [given by eqn (8)] and approximate [eqn (11) and (12)] solutions for different total concentrations of group III elements and demonstrates a good agreement between them, especially for high x values. However, a significant divergence between exact and approximate solutions is observed for self-catalyzed growth.
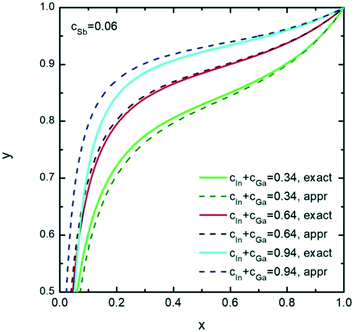 | ||
| Fig. 8 Exact (solid curves) and approximate (dashed curves) solutions representing the liquid–solid composition dependences of solid InxGa1−xSb for different ctot values at T = 430 °C and cAs = 0.06. | ||
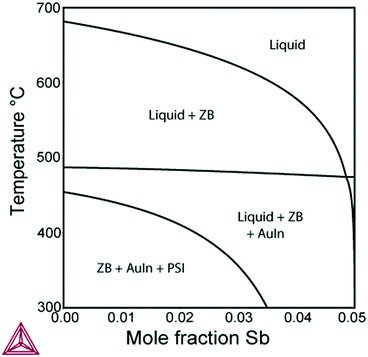
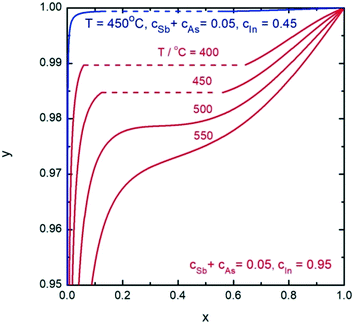
Finally, we analyze nucleation of InSbxAs1−x NWs from the In–Sb–As–Au melt. According to the phase diagram for the In–Sb–As–Au system presented in Fig. 9, the VLS growth of InSbxAs1−x NWs is possible with any solid composition at T = 450 °C. The main feature of this system is the compositional-dependent pseudobinary interaction parameter. This results in a composition-dependent, asymmetric miscibility gap. Fig. 10 shows the liquid composition versus the InSbxAs1−x solid composition for different temperatures in the cases of self-catalyzed (ctot = 0.05 and cIn = 0.95) and gold-catalyzed growth at T = 450 °C (ctot = 0.05 and cIn = 0.45). Defect-free, self-catalyzed NWs with an Sb fraction greater than x = 0.35 have been obtained at T = 520 °C, as reported in ref. 32. Such a relatively high value corresponds to y ≈ 0.975. Clearly, it is more difficult to control the NW composition in the case of Au-catalyzed growth because of the much steeper slope of the y(x) curve. Interestingly, in the case of AlxGa1−xAs, the influence of the total concentration is reversed so that composition control would be easier in the Au-catalyzed case, as seen from comparing Fig. 5 and 10.
Conclusions
In summary, we have calculated the nucleation-limited compositions of ternary III–V NWs forming from quaternary alloys with gold. The calculations are based on realistic thermodynamic description and take into account ternary and composition-dependent binary interactions. We have analyzed the compositional diagrams for four highly relevant III–V materials systems. The results of this study show that the composition of ternary III–V NWs can be controlled over a wide range by tuning the composition of the catalyst droplet and temperature except for systems with high pseudobinary interaction parameters. For such systems (InxGa1−xSb and InxGa1−xAs), formation of ternary NWs is thermodynamically forbidden in a wide range of solid compositions at relevant temperatures due to the miscibility gaps. In addition, we demonstrated that in many cases our analytical calculations are in good agreement with a purely thermodynamic phase segregation model.Conflicts of interest
There are no conflicts of interest to declare.Acknowledgements
This project has received funding from the European Union's Horizon 2020 research and innovation program under the Marie Skłodowska-Curie grant 722176 (project acronym INDEED). JJ and MG acknowledge financial support from NanoLund (the Center for Nanoscience at Lund University), the Swedish Research Council (VR) grant registration number 2015-04105, and the Knut and Alice Wallenberg Foundation (KAW). VGD thanks the Ministry of Education and Science of the Russian Federation for financial support under grant 14.587.21.0040 (project ID RFMEFI58717X0040).References
- A. I. Persson, M. W. Larsson, S. Stenström, B. J. Ohlsson, L. Samuelson and L. R. Wallenberg, Nat. Mater., 2004, 3, 677 CrossRef CAS PubMed.
- W. Lu and C. M. Lieber, J. Phys. D: Appl. Phys., 2006, 39, R387 CrossRef CAS.
- N. Wang, Y. Cai and R. Zhang, Mater. Sci. Eng., 2008, 60, 1 Search PubMed.
- B. Hua, J. Motohisa, S. Kobayashi, S. Hara and T. Fukui, Nano Lett., 2009, 9, 112 CrossRef CAS PubMed.
- G. Zheng, W. Lu, S. Jin and C. M. Lieber, Adv. Mater., 2004, 16, 1890 CrossRef CAS.
- A. Kandala, T. Betti and I. M. Fontcuberta, Phys. Status Solidi, 2009, 1, 173 CrossRef.
- H. Lee, M. Kim, I. Kim and H. Lee, Adv. Mater., 2016, 28, 4541 CrossRef CAS PubMed.
- D. R. Kim, C. H. Lee and X. Zheng, Nano Lett., 2010, 10, 1050–1054 CrossRef CAS PubMed.
- R. S. Wagner and W. C. Ellis, Appl. Phys. Lett., 1964, 4, 89 CrossRef CAS.
- C. Colombo, D. Spirkoska, M. Frimmer, G. Abstreiter and A. Fontcuberta i Morral, Phys. Rev. B: Condens. Matter Mater. Phys., 2008, 77, 155326 CrossRef.
- F. Jabeen, V. Grillo, S. Rubini and F. Martelli, Nanotechnology, 2008, 19, 275711 CrossRef PubMed.
- V. G. Dubrovskii, T. Xu, A. Díaz Álvarez, S. R. Plissard, P. Caroff, F. Glas and B. Grandidier, Nano Lett., 2015, 15, 5580 CrossRef CAS PubMed.
- S. Plissard, K. A. Dick, G. Larrieu, S. Godey, A. Addad, X. Wallart and P. Caroff, Nanotechnology, 2010, 21, 385602 CrossRef PubMed.
- T. Grap, T. Rieger, C. Blömers, T. Schäpers, D. Grützmacher and M. I. Lepsa, Nanotechnology, 2013, 24, 335601 CrossRef PubMed.
- G. Priante, F. Glas, G. Patriarche, K. Pantzas, F. Oehler and J.-C. Harmand, Nano Lett., 2016, 16, 1917–1924 CrossRef CAS PubMed.
- C. S. Jung, H. S. Kim, G. B. Jung, K. J. Gong, Y. J. Cho, S. Y. Jang, C. H. Kim, C. W. Lee and J. Park, J. Phys. Chem. C, 2011, 115, 7843–7850 CAS.
- L. Li, D. Pan, Y. U. Xue, X. Wang, M. Lin, D. Su, Q. Zhang, X. Yu, H. So, D. Wei, B. Sun, P. Tan, A. Pan and J. Zhao, Nano Lett., 2017, 17, 622–630 CrossRef CAS PubMed.
- L. Namazi, S. G. Ghalamestani, S. Lehmann, R. R. Zamani and K. A. Dick, Nanotechnology, 2017, 28, 165601 CrossRef PubMed.
- S. G. Ghalamestani, M. Ek, B. Ganjipour, C. Thelander, J. Johansson, P. Caroff and K. A. Dick, Nano Lett., 2012, 12, 4914–4919 CrossRef PubMed.
- V. G. Dubrovskii, A. A. Koryakin and N. V. Sibirev, Mater. Des., 2017, 132, 400–408 CrossRef CAS.
- V. G. Dubrovskii, Cryst. Growth Des., 2015, 15, 5738–5743 CAS.
- J. Johansson and M. Ghasemi, Phys. Rev. Mater., 2017, 1, 040401(R) CrossRef.
- F. Glas, Cryst. Growth Des., 2017, 17, 4785–4794 CAS.
- J. Johansson and M. Ghasemi, Cryst. Growth Des., 2017, 17, 1630–1635 CAS.
- G. Wilemski, J. Phys. Chem., 1987, 91, 2492–2498 CrossRef CAS.
- J. Grecenkov, V. G. Dubrovskii, M. Ghasemi and J. Johansson, Cryst. Growth Des., 2016, 16, 4526–4530 CAS.
- J. Andersson, T. Helander, L. Höglund, P. Shi and B. Sundman, Calphad, 2002, 26, 273–312 CrossRef CAS.
- J. C. Harmand, G. Patriarche, N. Péré-Laperne, M.-N. Mérat-Combes, L. Travers and F. Glas, Appl. Phys. Lett., 2005, 87, 203101 CrossRef.
- F. Glas, J. C. Harmand and G. Patriarche, Phys. Rev. Lett., 2007, 99, 146101 CrossRef PubMed.
- M. Heiss, B. Ketterer, E. Uccelli, J. R. Morante, J. Arbiol and A. Fontcuberta i Morral, Nanotechnology, 2011, 22, 195601 CrossRef PubMed.
- F. Jabeen, S. Rubini and F. Martelli, Microelectron. J., 2009, 40, 442–445 CrossRef CAS.
- H. Potts, M. Friedl, F. Amaduzzi, K. Tang, G. Tütüncüoglu, F. Matteini, E. A. Lladó, P. C. McIntyre and A. FontcubertaiMorral, Nano Lett., 2016, 16, 637–643 CrossRef CAS PubMed.
Footnote |
| † Electronic supplementary information (ESI) available. See DOI: 10.1039/c7ce02201h |
| This journal is © The Royal Society of Chemistry 2018 |

